Zip Codes with the Highest Percentage of Population Employed in Production in Reading, PA
RELATED REPORTS & OPTIONS
Production
Reading
Compare Zip Codes
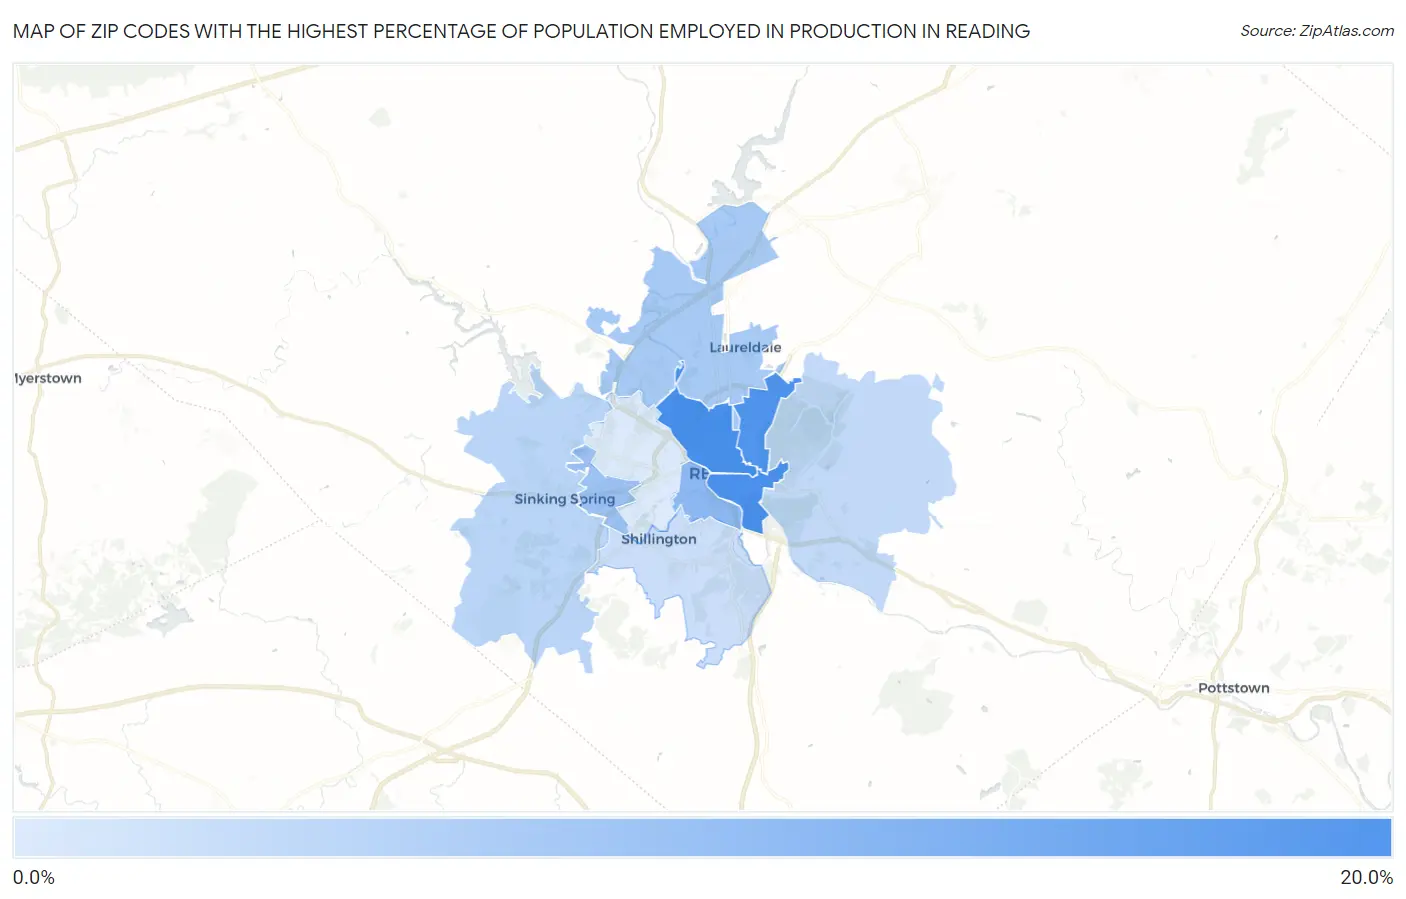
Map of Zip Codes with the Highest Percentage of Population Employed in Production in Reading
3.4%
18.4%
Zip Codes with the Highest Percentage of Population Employed in Production in Reading, PA
| Zip Code | % Employed | vs State | vs National | |
| 1. | 19601 | 18.4% | 5.8%(+12.6)#108 | 5.5%(+13.0)#1,748 |
| 2. | 19602 | 17.9% | 5.8%(+12.1)#122 | 5.5%(+12.5)#1,901 |
| 3. | 19604 | 17.4% | 5.8%(+11.6)#134 | 5.5%(+11.9)#2,091 |
| 4. | 19611 | 11.2% | 5.8%(+5.37)#388 | 5.5%(+5.71)#6,349 |
| 5. | 19609 | 9.6% | 5.8%(+3.83)#545 | 5.5%(+4.17)#8,357 |
| 6. | 19605 | 8.6% | 5.8%(+2.76)#657 | 5.5%(+3.10)#10,072 |
| 7. | 19608 | 6.8% | 5.8%(+0.960)#886 | 5.5%(+1.30)#13,518 |
| 8. | 19606 | 6.0% | 5.8%(+0.148)#983 | 5.5%(+0.489)#15,286 |
| 9. | 19607 | 5.1% | 5.8%(-0.682)#1,117 | 5.5%(-0.341)#17,318 |
| 10. | 19610 | 3.4% | 5.8%(-2.38)#1,341 | 5.5%(-2.04)#21,888 |
1
Common Questions
What are the Top 5 Zip Codes with the Highest Percentage of Population Employed in Production in Reading, PA?
Top 5 Zip Codes with the Highest Percentage of Population Employed in Production in Reading, PA are:
What zip code has the Highest Percentage of Population Employed in Production in Reading, PA?
19601 has the Highest Percentage of Population Employed in Production in Reading, PA with 18.4%.
What is the Percentage of Population Employed in Production in Reading, PA?
Percentage of Population Employed in Production in Reading is 17.0%.
What is the Percentage of Population Employed in Production in Pennsylvania?
Percentage of Population Employed in Production in Pennsylvania is 5.8%.
What is the Percentage of Population Employed in Production in the United States?
Percentage of Population Employed in Production in the United States is 5.5%.