Zip Codes with the Highest Percentage of Local Government Employees in Reading, PA
RELATED REPORTS & OPTIONS
Local Government Employees
Reading
Compare Zip Codes
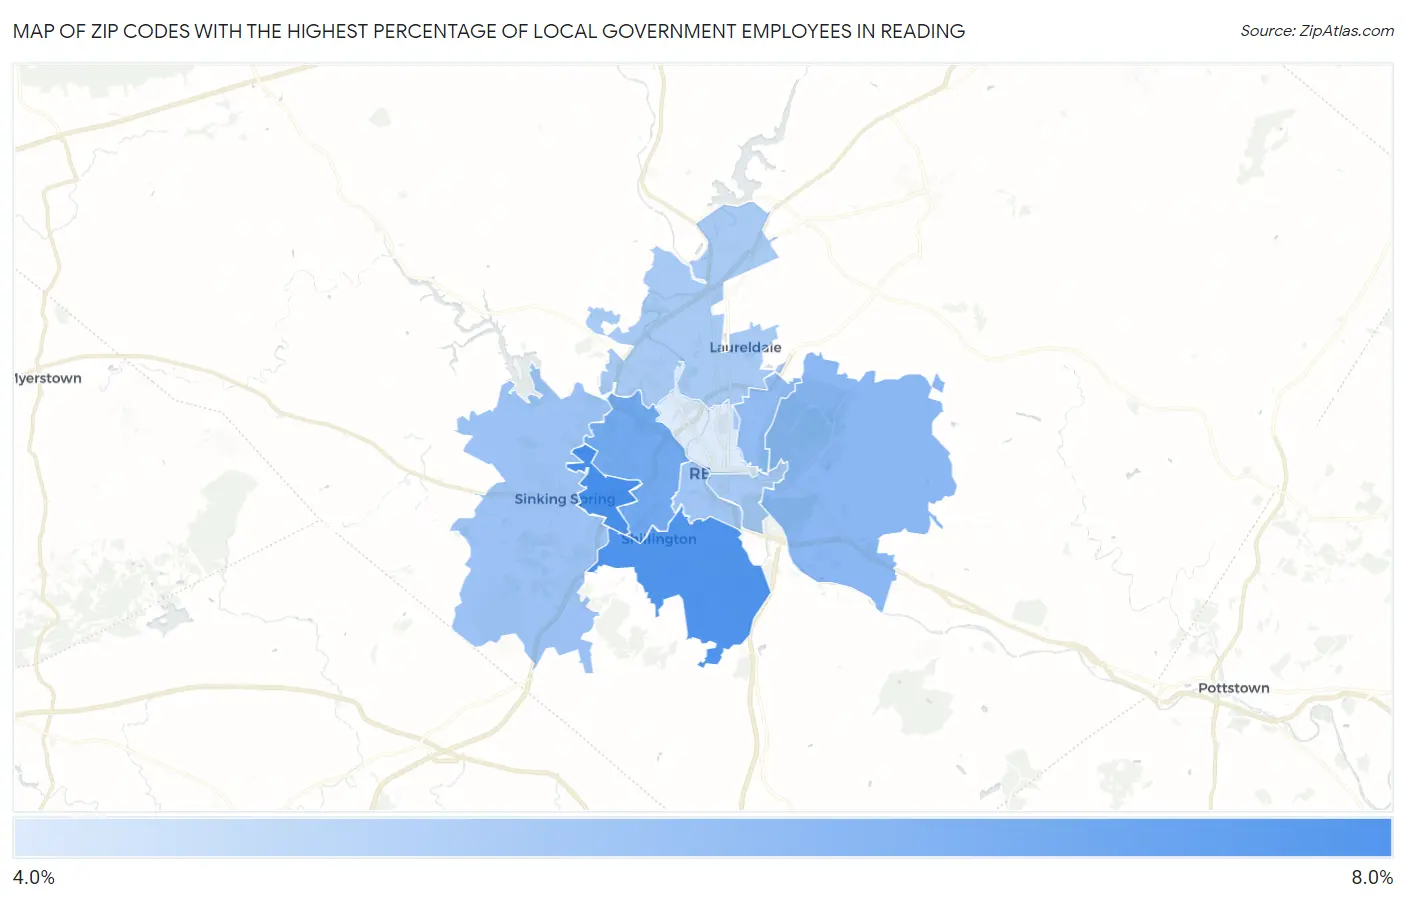
Map of Zip Codes with the Highest Percentage of Local Government Employees in Reading
4.1%
6.9%
Zip Codes with the Highest Percentage of Local Government Employees in Reading, PA
| Zip Code | % Local Government Employees | vs State | vs National | |
| 1. | 19609 | 6.9% | 6.0%(+0.911)#544 | 7.2%(-0.329)#16,700 |
| 2. | 19607 | 6.7% | 6.0%(+0.748)#577 | 7.2%(-0.491)#17,273 |
| 3. | 19610 | 6.1% | 6.0%(+0.074)#711 | 7.2%(-1.17)#19,577 |
| 4. | 19606 | 5.6% | 6.0%(-0.362)#803 | 7.2%(-1.60)#21,040 |
| 5. | 19604 | 5.5% | 6.0%(-0.475)#833 | 7.2%(-1.71)#21,448 |
| 6. | 19608 | 5.3% | 6.0%(-0.659)#871 | 7.2%(-1.90)#22,043 |
| 7. | 19611 | 5.2% | 6.0%(-0.784)#893 | 7.2%(-2.02)#22,414 |
| 8. | 19602 | 5.1% | 6.0%(-0.896)#924 | 7.2%(-2.14)#22,756 |
| 9. | 19605 | 5.1% | 6.0%(-0.922)#934 | 7.2%(-2.16)#22,834 |
| 10. | 19601 | 4.1% | 6.0%(-1.93)#1,162 | 7.2%(-3.17)#25,556 |
1
Common Questions
What are the Top 5 Zip Codes with the Highest Percentage of Local Government Employees in Reading, PA?
Top 5 Zip Codes with the Highest Percentage of Local Government Employees in Reading, PA are:
What zip code has the Highest Percentage of Local Government Employees in Reading, PA?
19609 has the Highest Percentage of Local Government Employees in Reading, PA with 6.9%.
What is the Percentage of Local Government Employees in Reading, PA?
Percentage of Local Government Employees in Reading is 4.6%.
What is the Percentage of Local Government Employees in Pennsylvania?
Percentage of Local Government Employees in Pennsylvania is 6.0%.
What is the Percentage of Local Government Employees in the United States?
Percentage of Local Government Employees in the United States is 7.2%.