Zip Codes with the Highest Percentage of Population with a Degree in Computers and Mathematics in Philadelphia, PA
RELATED REPORTS & OPTIONS
Computers and Mathematics
Philadelphia
Compare Zip Codes
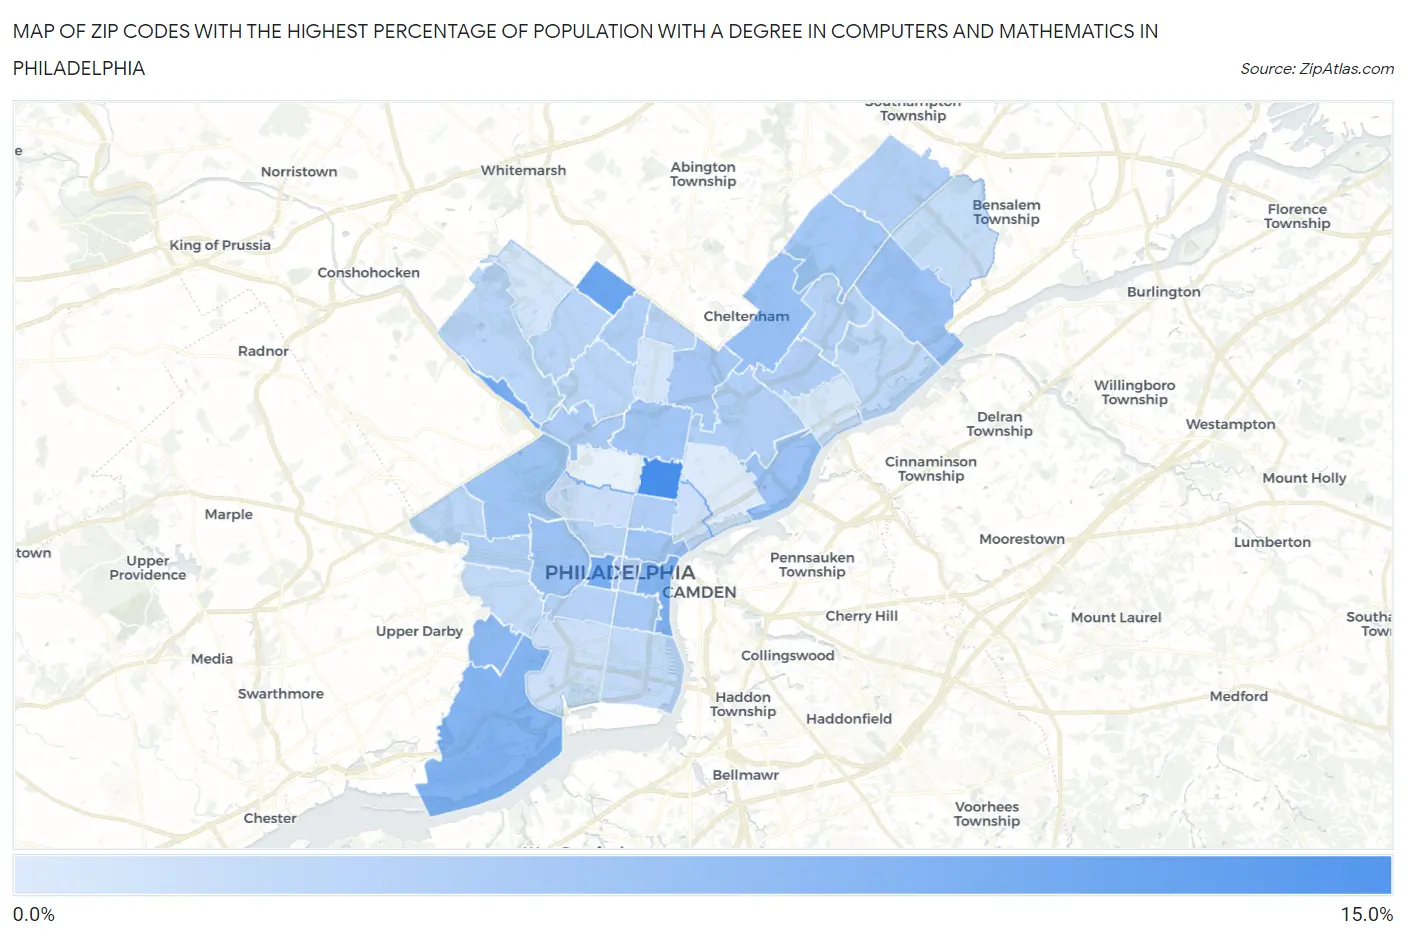
Map of Zip Codes with the Highest Percentage of Population with a Degree in Computers and Mathematics in Philadelphia
1.1%
10.3%
Zip Codes with the Highest Percentage of Population with a Degree in Computers and Mathematics in Philadelphia, PA
| Zip Code | % Graduates | vs State | vs National | |
| 1. | 19133 | 10.3% | 4.6%(+5.78)#99 | 4.9%(+5.44)#1,641 |
| 2. | 19150 | 8.0% | 4.6%(+3.45)#172 | 4.9%(+3.11)#2,889 |
| 3. | 19127 | 7.5% | 4.6%(+2.90)#194 | 4.9%(+2.56)#3,382 |
| 4. | 19103 | 7.2% | 4.6%(+2.62)#207 | 4.9%(+2.28)#3,658 |
| 5. | 19153 | 6.6% | 4.6%(+2.02)#247 | 4.9%(+1.67)#4,366 |
| 6. | 19106 | 6.5% | 4.6%(+1.91)#254 | 4.9%(+1.57)#4,513 |
| 7. | 19142 | 5.9% | 4.6%(+1.38)#303 | 4.9%(+1.04)#5,409 |
| 8. | 19111 | 5.3% | 4.6%(+0.778)#374 | 4.9%(+0.436)#6,685 |
| 9. | 19114 | 5.1% | 4.6%(+0.587)#390 | 4.9%(+0.246)#7,118 |
| 10. | 19137 | 5.1% | 4.6%(+0.540)#394 | 4.9%(+0.198)#7,231 |
| 11. | 19104 | 5.0% | 4.6%(+0.453)#408 | 4.9%(+0.112)#7,437 |
| 12. | 19131 | 4.9% | 4.6%(+0.314)#428 | 4.9%(-0.028)#7,796 |
| 13. | 19140 | 4.7% | 4.6%(+0.164)#455 | 4.9%(-0.177)#8,217 |
| 14. | 19123 | 4.7% | 4.6%(+0.149)#458 | 4.9%(-0.193)#8,266 |
| 15. | 19115 | 4.5% | 4.6%(-0.007)#486 | 4.9%(-0.349)#8,712 |
| 16. | 19120 | 4.5% | 4.6%(-0.073)#492 | 4.9%(-0.415)#8,940 |
| 17. | 19147 | 4.3% | 4.6%(-0.254)#532 | 4.9%(-0.596)#9,546 |
| 18. | 19129 | 4.2% | 4.6%(-0.339)#549 | 4.9%(-0.680)#9,791 |
| 19. | 19102 | 4.0% | 4.6%(-0.521)#575 | 4.9%(-0.862)#10,367 |
| 20. | 19122 | 3.9% | 4.6%(-0.620)#594 | 4.9%(-0.961)#10,676 |
| 21. | 19149 | 3.9% | 4.6%(-0.677)#610 | 4.9%(-1.02)#10,885 |
| 22. | 19116 | 3.8% | 4.6%(-0.794)#629 | 4.9%(-1.14)#11,338 |
| 23. | 19138 | 3.7% | 4.6%(-0.814)#631 | 4.9%(-1.16)#11,400 |
| 24. | 19124 | 3.7% | 4.6%(-0.818)#632 | 4.9%(-1.16)#11,421 |
| 25. | 19139 | 3.7% | 4.6%(-0.822)#633 | 4.9%(-1.16)#11,435 |
| 26. | 19107 | 3.7% | 4.6%(-0.830)#635 | 4.9%(-1.17)#11,460 |
| 27. | 19130 | 3.5% | 4.6%(-1.03)#690 | 4.9%(-1.37)#12,198 |
| 28. | 19146 | 3.5% | 4.6%(-1.03)#691 | 4.9%(-1.37)#12,217 |
| 29. | 19152 | 3.5% | 4.6%(-1.08)#702 | 4.9%(-1.42)#12,373 |
| 30. | 19126 | 3.3% | 4.6%(-1.27)#736 | 4.9%(-1.61)#13,058 |
| 31. | 19128 | 3.2% | 4.6%(-1.33)#750 | 4.9%(-1.67)#13,300 |
| 32. | 19144 | 3.2% | 4.6%(-1.37)#761 | 4.9%(-1.71)#13,430 |
| 33. | 19119 | 3.2% | 4.6%(-1.37)#763 | 4.9%(-1.71)#13,439 |
| 34. | 19151 | 3.1% | 4.6%(-1.41)#769 | 4.9%(-1.75)#13,566 |
| 35. | 19136 | 2.9% | 4.6%(-1.63)#808 | 4.9%(-1.97)#14,339 |
| 36. | 19148 | 2.8% | 4.6%(-1.76)#833 | 4.9%(-2.10)#14,811 |
| 37. | 19143 | 2.8% | 4.6%(-1.79)#842 | 4.9%(-2.13)#14,934 |
| 38. | 19154 | 2.6% | 4.6%(-1.99)#888 | 4.9%(-2.33)#15,687 |
| 39. | 19121 | 2.2% | 4.6%(-2.32)#958 | 4.9%(-2.66)#16,851 |
| 40. | 19125 | 2.1% | 4.6%(-2.41)#978 | 4.9%(-2.76)#17,183 |
| 41. | 19145 | 2.0% | 4.6%(-2.51)#993 | 4.9%(-2.85)#17,490 |
| 42. | 19141 | 1.6% | 4.6%(-2.92)#1,062 | 4.9%(-3.26)#18,762 |
| 43. | 19118 | 1.6% | 4.6%(-2.93)#1,063 | 4.9%(-3.27)#18,785 |
| 44. | 19135 | 1.6% | 4.6%(-2.95)#1,068 | 4.9%(-3.29)#18,852 |
| 45. | 19134 | 1.1% | 4.6%(-3.42)#1,124 | 4.9%(-3.76)#20,172 |
1
Common Questions
What are the Top 10 Zip Codes with the Highest Percentage of Population with a Degree in Computers and Mathematics in Philadelphia, PA?
Top 10 Zip Codes with the Highest Percentage of Population with a Degree in Computers and Mathematics in Philadelphia, PA are:
What zip code has the Highest Percentage of Population with a Degree in Computers and Mathematics in Philadelphia, PA?
19133 has the Highest Percentage of Population with a Degree in Computers and Mathematics in Philadelphia, PA with 10.3%.
What is the Percentage of Population with a Degree in Computers and Mathematics in Philadelphia, PA?
Percentage of Population with a Degree in Computers and Mathematics in Philadelphia is 3.9%.
What is the Percentage of Population with a Degree in Computers and Mathematics in Pennsylvania?
Percentage of Population with a Degree in Computers and Mathematics in Pennsylvania is 4.6%.
What is the Percentage of Population with a Degree in Computers and Mathematics in the United States?
Percentage of Population with a Degree in Computers and Mathematics in the United States is 4.9%.