Zip Codes with the Highest Percentage of Population Employed in Food Preparation & Serving in Bethlehem, PA
RELATED REPORTS & OPTIONS
Food Preparation & Serving
Bethlehem
Compare Zip Codes
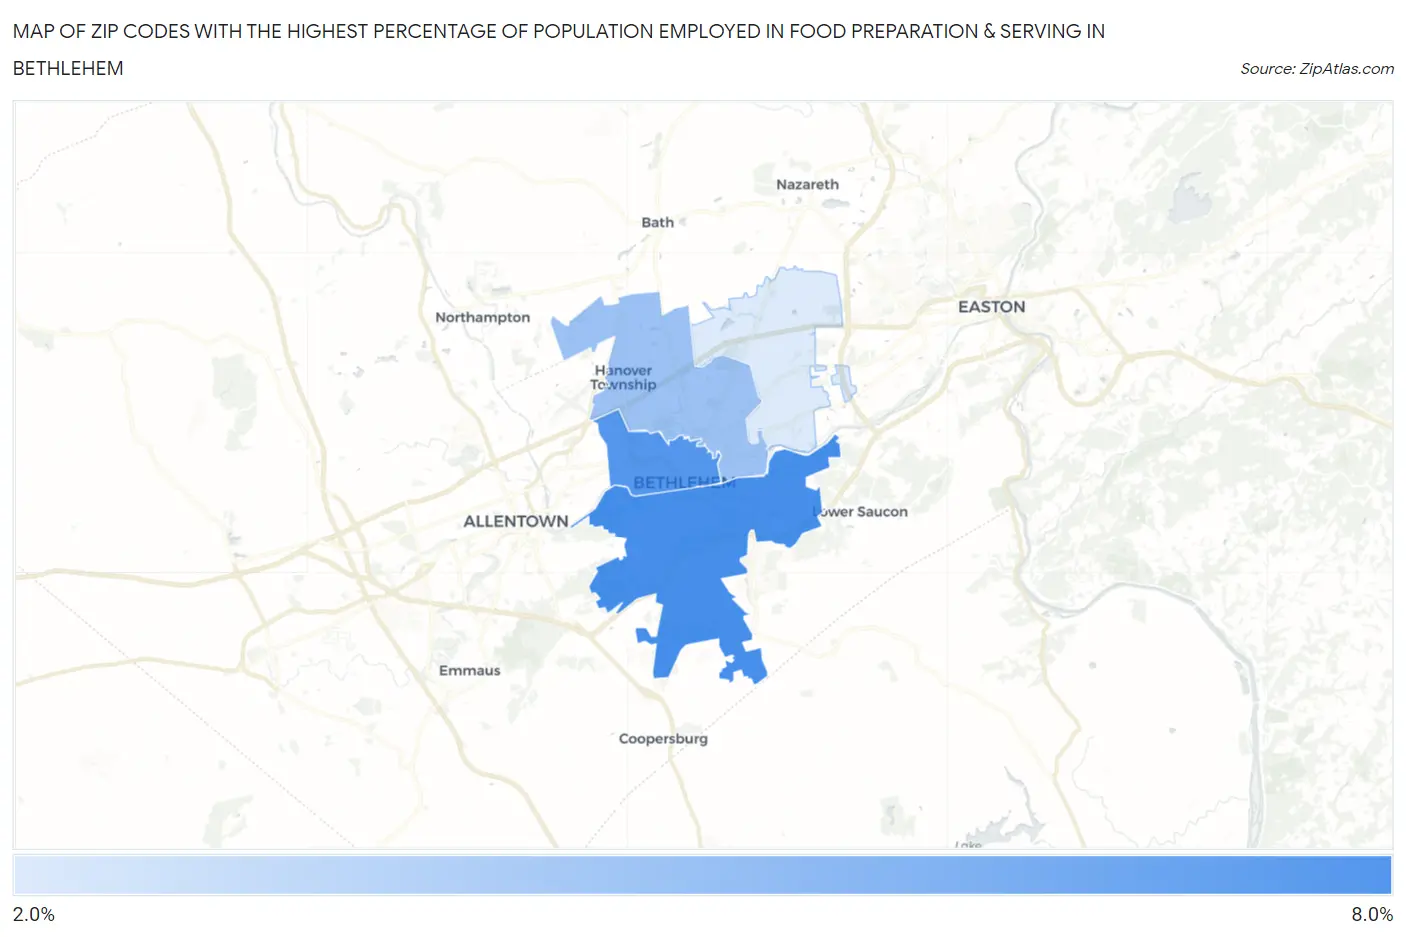
Map of Zip Codes with the Highest Percentage of Population Employed in Food Preparation & Serving in Bethlehem
2.2%
7.5%
Zip Codes with the Highest Percentage of Population Employed in Food Preparation & Serving in Bethlehem, PA
| Zip Code | % Employed | vs State | vs National | |
| 1. | 18015 | 7.5% | 5.0%(+2.41)#300 | 5.3%(+2.17)#5,644 |
| 2. | 18018 | 6.9% | 5.0%(+1.89)#346 | 5.3%(+1.65)#6,726 |
| 3. | 18017 | 4.4% | 5.0%(-0.610)#895 | 5.3%(-0.853)#15,279 |
| 4. | 18020 | 2.2% | 5.0%(-2.89)#1,378 | 5.3%(-3.13)#24,249 |
1
Common Questions
What are the Top 3 Zip Codes with the Highest Percentage of Population Employed in Food Preparation & Serving in Bethlehem, PA?
Top 3 Zip Codes with the Highest Percentage of Population Employed in Food Preparation & Serving in Bethlehem, PA are:
What zip code has the Highest Percentage of Population Employed in Food Preparation & Serving in Bethlehem, PA?
18015 has the Highest Percentage of Population Employed in Food Preparation & Serving in Bethlehem, PA with 7.5%.
What is the Percentage of Population Employed in Food Preparation & Serving in Bethlehem, PA?
Percentage of Population Employed in Food Preparation & Serving in Bethlehem is 6.9%.
What is the Percentage of Population Employed in Food Preparation & Serving in Pennsylvania?
Percentage of Population Employed in Food Preparation & Serving in Pennsylvania is 5.0%.
What is the Percentage of Population Employed in Food Preparation & Serving in the United States?
Percentage of Population Employed in Food Preparation & Serving in the United States is 5.3%.