Zip Codes with the Highest Percentage of Population Employed in Food Preparation & Serving in Levittown, PA
RELATED REPORTS & OPTIONS
Food Preparation & Serving
Levittown
Compare Zip Codes
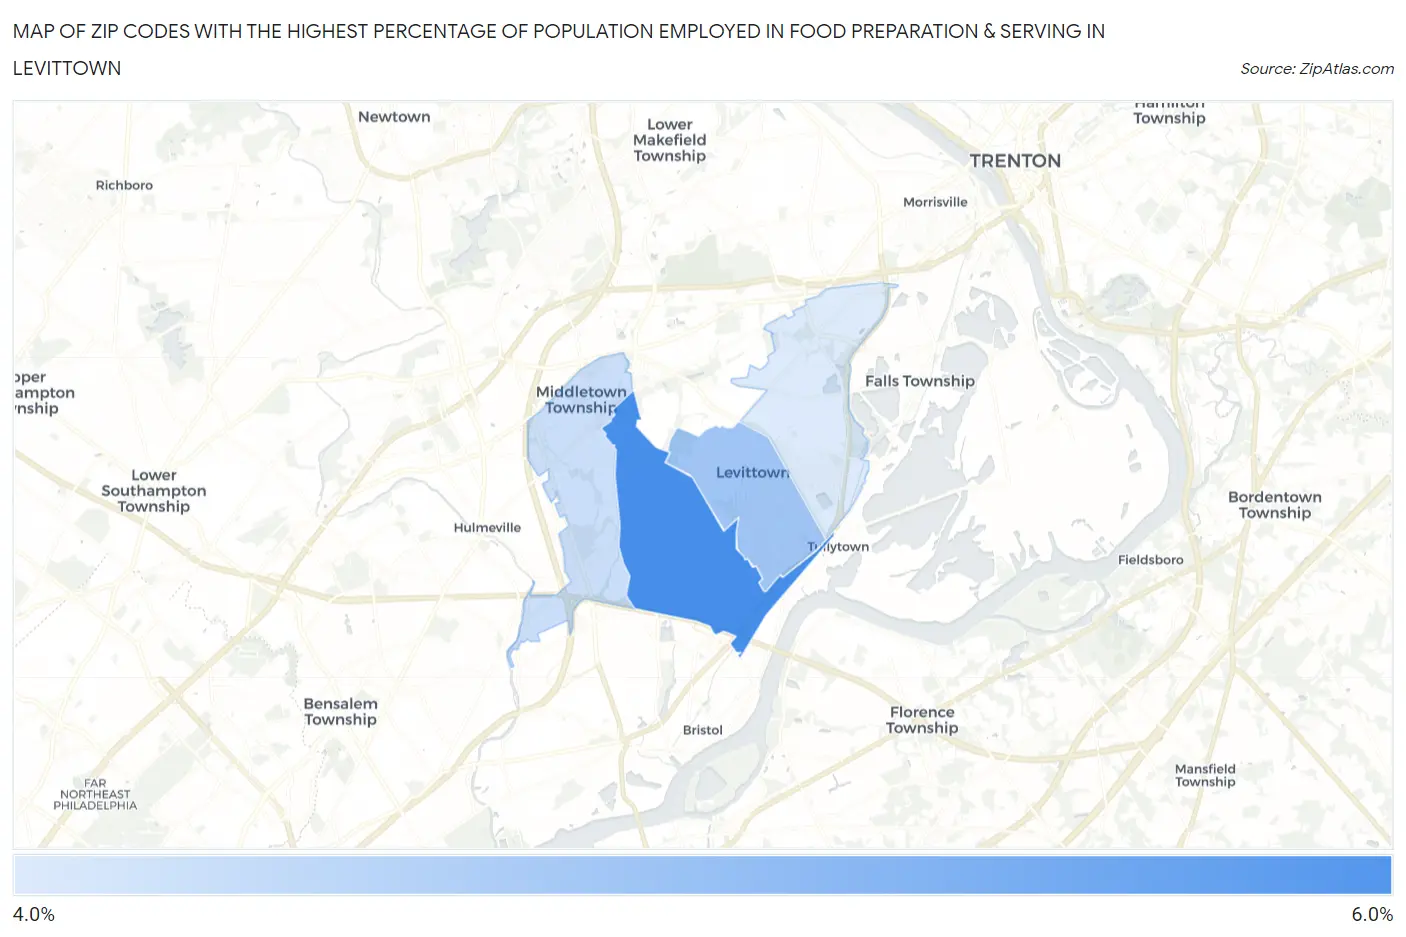
Map of Zip Codes with the Highest Percentage of Population Employed in Food Preparation & Serving in Levittown
4.0%
6.0%
Zip Codes with the Highest Percentage of Population Employed in Food Preparation & Serving in Levittown, PA
| Zip Code | % Employed | vs State | vs National | |
| 1. | 19057 | 6.0% | 5.0%(+0.937)#512 | 5.3%(+0.694)#9,412 |
| 2. | 19055 | 4.8% | 5.0%(-0.259)#793 | 5.3%(-0.502)#13,810 |
| 3. | 19056 | 4.3% | 5.0%(-0.784)#947 | 5.3%(-1.03)#16,059 |
| 4. | 19054 | 4.0% | 5.0%(-1.03)#995 | 5.3%(-1.27)#17,079 |
1
Common Questions
What are the Top 3 Zip Codes with the Highest Percentage of Population Employed in Food Preparation & Serving in Levittown, PA?
Top 3 Zip Codes with the Highest Percentage of Population Employed in Food Preparation & Serving in Levittown, PA are:
What zip code has the Highest Percentage of Population Employed in Food Preparation & Serving in Levittown, PA?
19057 has the Highest Percentage of Population Employed in Food Preparation & Serving in Levittown, PA with 6.0%.
What is the Percentage of Population Employed in Food Preparation & Serving in Levittown, PA?
Percentage of Population Employed in Food Preparation & Serving in Levittown is 5.7%.
What is the Percentage of Population Employed in Food Preparation & Serving in Pennsylvania?
Percentage of Population Employed in Food Preparation & Serving in Pennsylvania is 5.0%.
What is the Percentage of Population Employed in Food Preparation & Serving in the United States?
Percentage of Population Employed in Food Preparation & Serving in the United States is 5.3%.