Zip Codes with the Highest Percentage of Population Employed in Food Preparation & Serving in York, PA
RELATED REPORTS & OPTIONS
Food Preparation & Serving
York
Compare Zip Codes
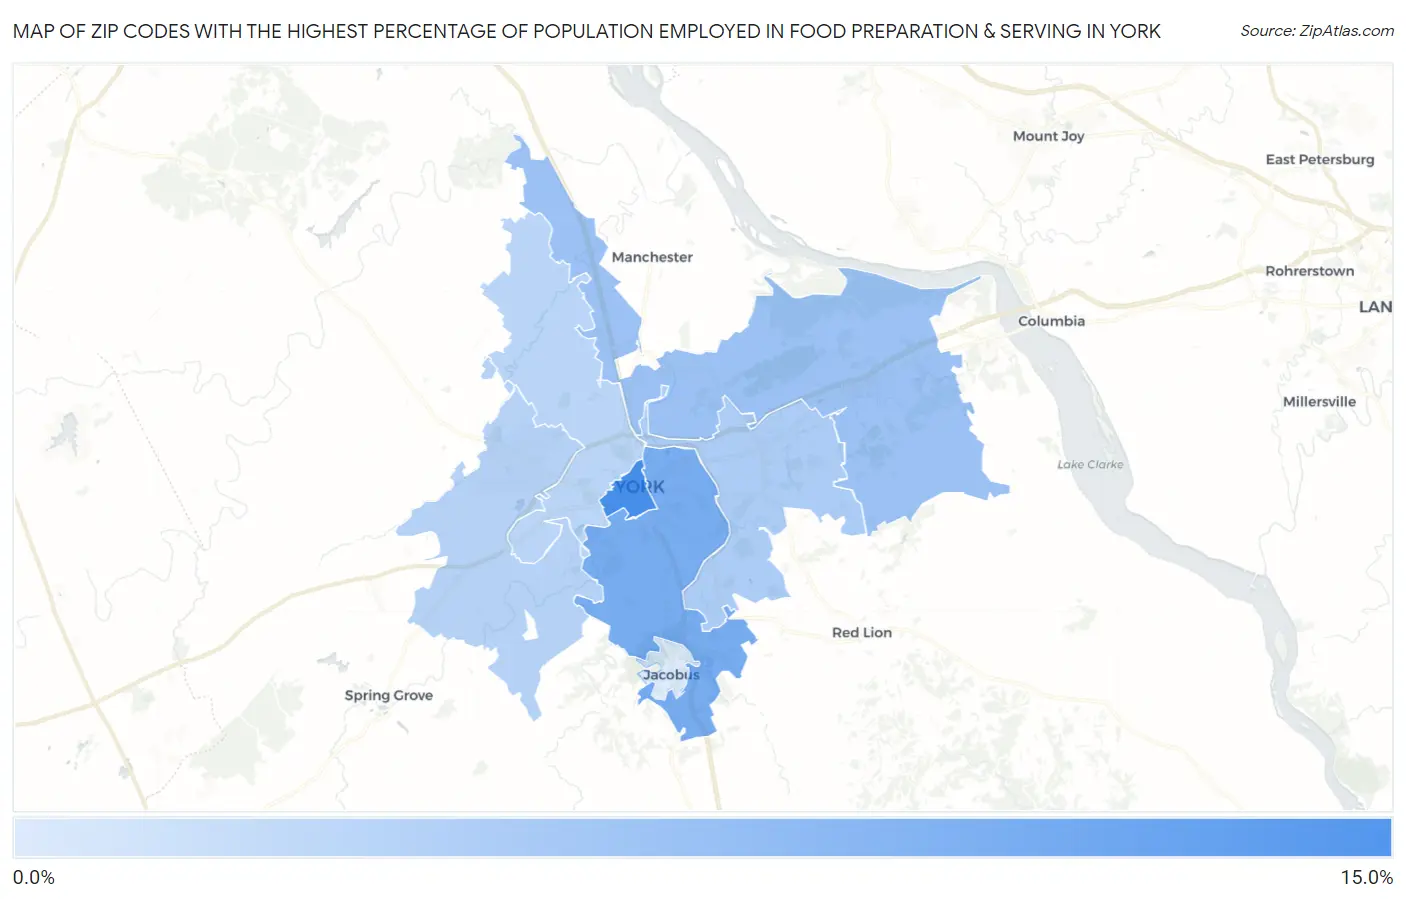
Map of Zip Codes with the Highest Percentage of Population Employed in Food Preparation & Serving in York
2.9%
10.7%
Zip Codes with the Highest Percentage of Population Employed in Food Preparation & Serving in York, PA
| Zip Code | % Employed | vs State | vs National | |
| 1. | 17401 | 10.7% | 5.0%(+5.66)#129 | 5.3%(+5.42)#2,207 |
| 2. | 17403 | 8.2% | 5.0%(+3.11)#232 | 5.3%(+2.87)#4,503 |
| 3. | 17406 | 6.2% | 5.0%(+1.12)#471 | 5.3%(+0.877)#8,846 |
| 4. | 17402 | 5.3% | 5.0%(+0.288)#653 | 5.3%(+0.045)#11,649 |
| 5. | 17408 | 4.9% | 5.0%(-0.163)#765 | 5.3%(-0.406)#13,442 |
| 6. | 17404 | 4.6% | 5.0%(-0.463)#856 | 5.3%(-0.705)#14,694 |
| 7. | 17407 | 2.9% | 5.0%(-2.16)#1,239 | 5.3%(-2.40)#21,728 |
1
Common Questions
What are the Top 5 Zip Codes with the Highest Percentage of Population Employed in Food Preparation & Serving in York, PA?
Top 5 Zip Codes with the Highest Percentage of Population Employed in Food Preparation & Serving in York, PA are:
What zip code has the Highest Percentage of Population Employed in Food Preparation & Serving in York, PA?
17401 has the Highest Percentage of Population Employed in Food Preparation & Serving in York, PA with 10.7%.
What is the Percentage of Population Employed in Food Preparation & Serving in York, PA?
Percentage of Population Employed in Food Preparation & Serving in York is 8.8%.
What is the Percentage of Population Employed in Food Preparation & Serving in Pennsylvania?
Percentage of Population Employed in Food Preparation & Serving in Pennsylvania is 5.0%.
What is the Percentage of Population Employed in Food Preparation & Serving in the United States?
Percentage of Population Employed in Food Preparation & Serving in the United States is 5.3%.