Zip Codes with the Highest Percentage of Population Employed in Food Preparation & Serving in Altoona, PA
RELATED REPORTS & OPTIONS
Food Preparation & Serving
Altoona
Compare Zip Codes
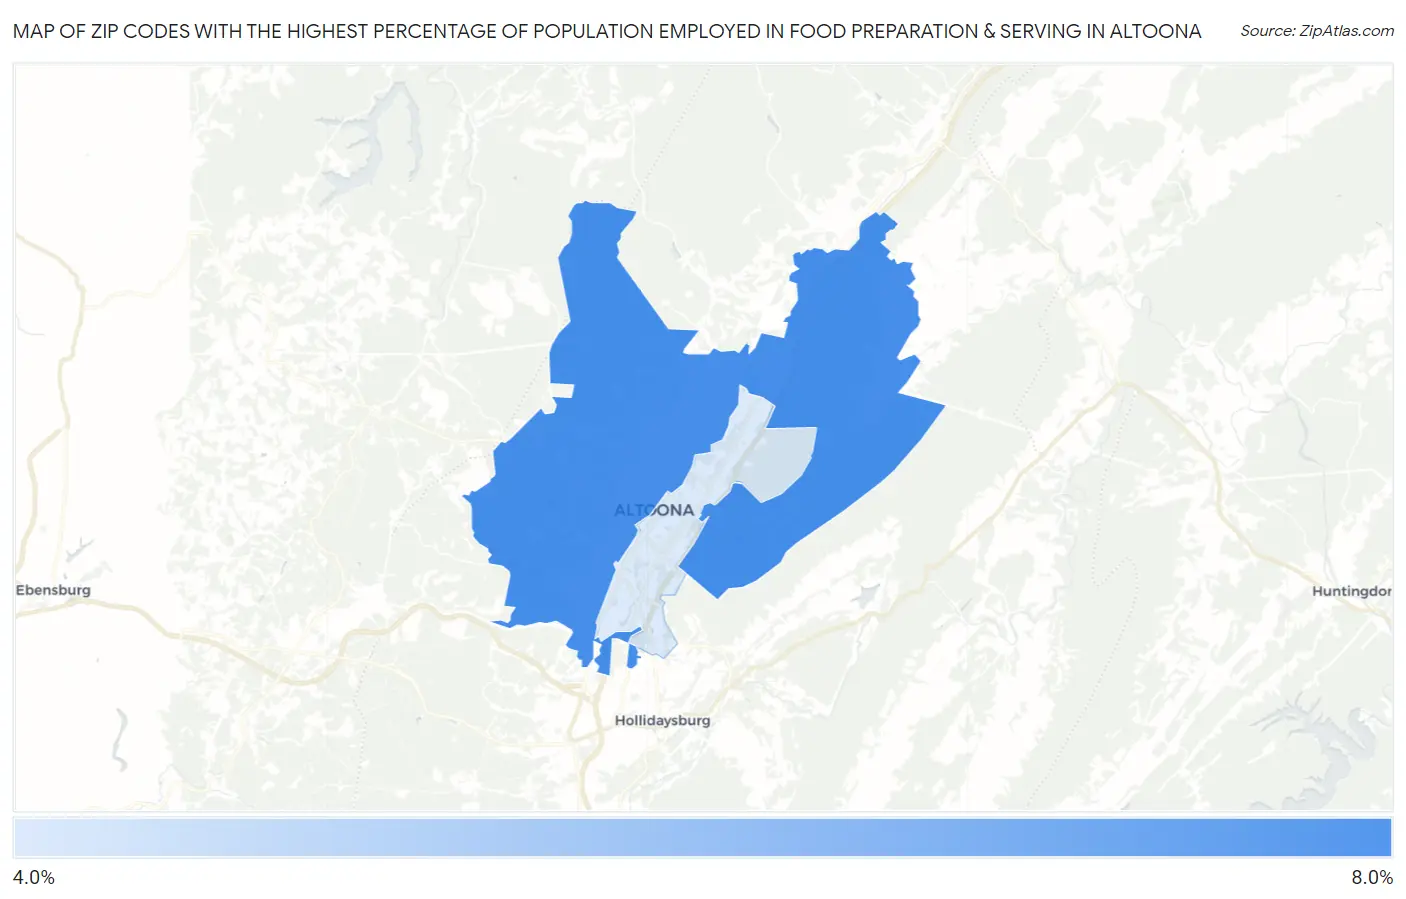
Map of Zip Codes with the Highest Percentage of Population Employed in Food Preparation & Serving in Altoona
5.0%
7.6%
Zip Codes with the Highest Percentage of Population Employed in Food Preparation & Serving in Altoona, PA
| Zip Code | % Employed | vs State | vs National | |
| 1. | 16601 | 7.6% | 5.0%(+2.55)#284 | 5.3%(+2.30)#5,395 |
| 2. | 16602 | 5.0% | 5.0%(-0.069)#742 | 5.3%(-0.312)#13,046 |
1
Common Questions
What are the Top Zip Codes with the Highest Percentage of Population Employed in Food Preparation & Serving in Altoona, PA?
Top Zip Codes with the Highest Percentage of Population Employed in Food Preparation & Serving in Altoona, PA are:
What zip code has the Highest Percentage of Population Employed in Food Preparation & Serving in Altoona, PA?
16601 has the Highest Percentage of Population Employed in Food Preparation & Serving in Altoona, PA with 7.6%.
What is the Percentage of Population Employed in Food Preparation & Serving in Altoona, PA?
Percentage of Population Employed in Food Preparation & Serving in Altoona is 7.2%.
What is the Percentage of Population Employed in Food Preparation & Serving in Pennsylvania?
Percentage of Population Employed in Food Preparation & Serving in Pennsylvania is 5.0%.
What is the Percentage of Population Employed in Food Preparation & Serving in the United States?
Percentage of Population Employed in Food Preparation & Serving in the United States is 5.3%.