Zip Codes with the Highest Percentage of Population Employed in Computer & Mathematics in Arizona
RELATED REPORTS & OPTIONS
Computer & Mathematics
Arizona
Compare Zip Codes
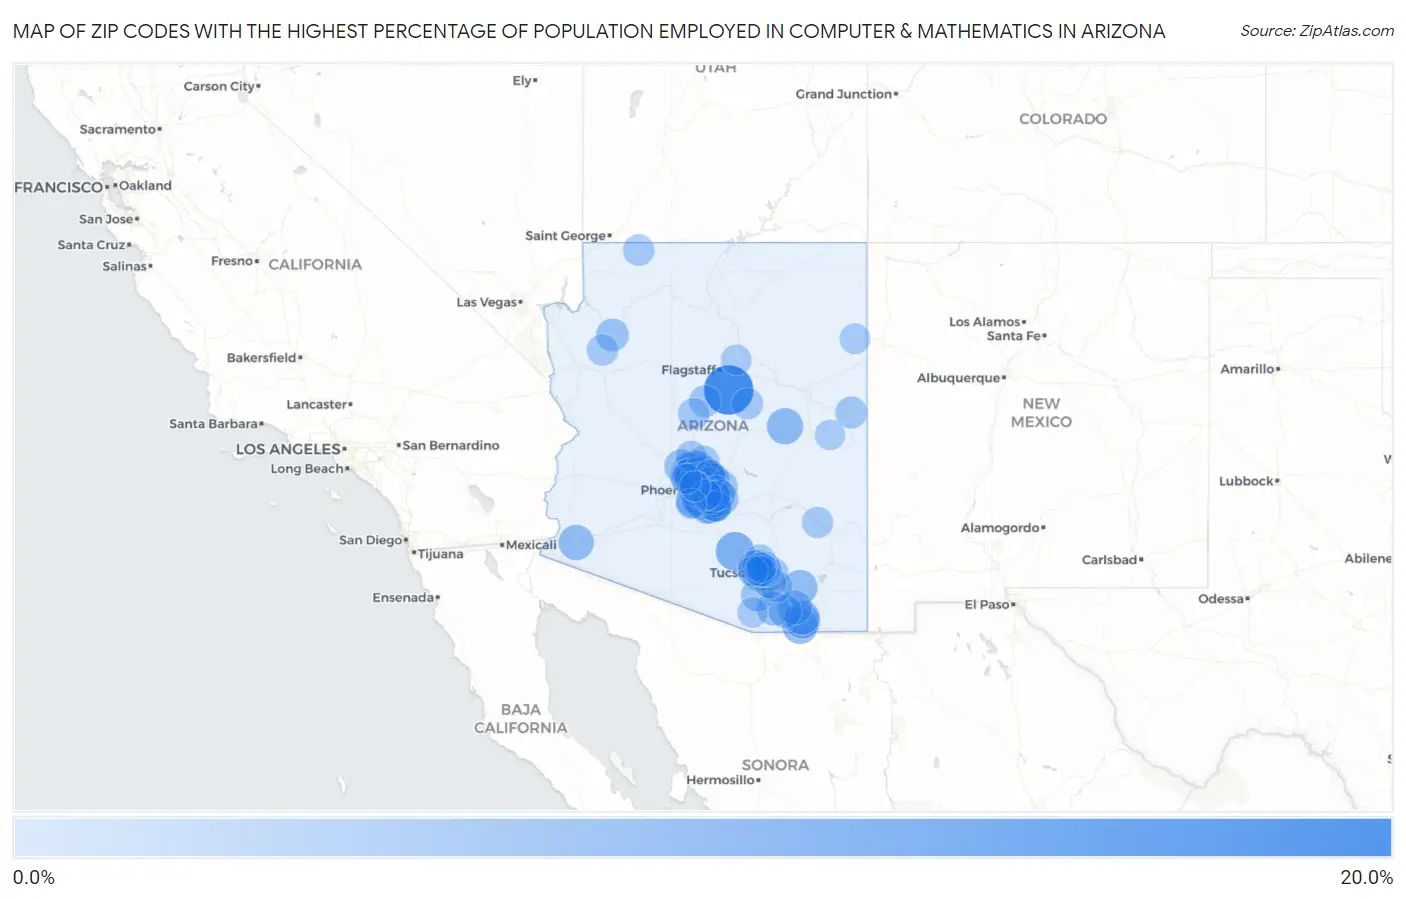
Map of Zip Codes with the Highest Percentage of Population Employed in Computer & Mathematics in Arizona
0.0%
20.0%
Zip Codes with the Highest Percentage of Population Employed in Computer & Mathematics in Arizona
| Zip Code | % Employed | vs State | vs National | |
| 1. | 86038 | 18.8% | 3.6%(+15.2)#1 | 3.5%(+15.2)#155 |
| 2. | 85054 | 9.9% | 3.6%(+6.37)#2 | 3.5%(+6.41)#718 |
| 3. | 85145 | 9.8% | 3.6%(+6.27)#3 | 3.5%(+6.30)#738 |
| 4. | 85085 | 9.6% | 3.6%(+6.09)#4 | 3.5%(+6.12)#764 |
| 5. | 85260 | 9.2% | 3.6%(+5.63)#5 | 3.5%(+5.67)#856 |
| 6. | 85295 | 8.8% | 3.6%(+5.22)#6 | 3.5%(+5.25)#963 |
| 7. | 85027 | 8.7% | 3.6%(+5.18)#7 | 3.5%(+5.21)#974 |
| 8. | 85249 | 8.1% | 3.6%(+4.55)#8 | 3.5%(+4.58)#1,175 |
| 9. | 85933 | 8.1% | 3.6%(+4.50)#9 | 3.5%(+4.54)#1,192 |
| 10. | 85284 | 7.6% | 3.6%(+4.06)#10 | 3.5%(+4.09)#1,347 |
| 11. | 85045 | 7.6% | 3.6%(+4.02)#11 | 3.5%(+4.05)#1,356 |
| 12. | 85083 | 7.3% | 3.6%(+3.76)#12 | 3.5%(+3.79)#1,457 |
| 13. | 85615 | 7.3% | 3.6%(+3.73)#13 | 3.5%(+3.76)#1,469 |
| 14. | 85248 | 7.3% | 3.6%(+3.71)#14 | 3.5%(+3.75)#1,481 |
| 15. | 85356 | 7.3% | 3.6%(+3.71)#15 | 3.5%(+3.74)#1,485 |
| 16. | 85627 | 7.1% | 3.6%(+3.59)#16 | 3.5%(+3.62)#1,544 |
| 17. | 85050 | 7.1% | 3.6%(+3.53)#17 | 3.5%(+3.56)#1,581 |
| 18. | 85650 | 7.0% | 3.6%(+3.41)#18 | 3.5%(+3.44)#1,646 |
| 19. | 85254 | 7.0% | 3.6%(+3.40)#19 | 3.5%(+3.43)#1,651 |
| 20. | 85226 | 7.0% | 3.6%(+3.40)#20 | 3.5%(+3.43)#1,652 |
| 21. | 85635 | 6.7% | 3.6%(+3.19)#21 | 3.5%(+3.22)#1,762 |
| 22. | 85251 | 6.7% | 3.6%(+3.12)#22 | 3.5%(+3.15)#1,814 |
| 23. | 85044 | 6.6% | 3.6%(+3.05)#23 | 3.5%(+3.08)#1,851 |
| 24. | 85701 | 6.6% | 3.6%(+3.02)#24 | 3.5%(+3.05)#1,873 |
| 25. | 85616 | 6.5% | 3.6%(+2.97)#25 | 3.5%(+3.00)#1,907 |
| 26. | 85286 | 6.5% | 3.6%(+2.92)#26 | 3.5%(+2.95)#1,947 |
| 27. | 85212 | 6.5% | 3.6%(+2.91)#27 | 3.5%(+2.94)#1,955 |
| 28. | 85250 | 6.4% | 3.6%(+2.82)#28 | 3.5%(+2.85)#2,021 |
| 29. | 85296 | 6.3% | 3.6%(+2.77)#29 | 3.5%(+2.80)#2,058 |
| 30. | 85224 | 6.2% | 3.6%(+2.68)#30 | 3.5%(+2.71)#2,121 |
| 31. | 85383 | 6.2% | 3.6%(+2.59)#31 | 3.5%(+2.63)#2,182 |
| 32. | 85282 | 6.1% | 3.6%(+2.56)#32 | 3.5%(+2.60)#2,209 |
| 33. | 85048 | 6.0% | 3.6%(+2.49)#33 | 3.5%(+2.53)#2,271 |
| 34. | 85637 | 6.0% | 3.6%(+2.49)#34 | 3.5%(+2.52)#2,275 |
| 35. | 85281 | 6.0% | 3.6%(+2.43)#35 | 3.5%(+2.46)#2,320 |
| 36. | 85298 | 5.9% | 3.6%(+2.39)#36 | 3.5%(+2.42)#2,363 |
| 37. | 85259 | 5.9% | 3.6%(+2.33)#37 | 3.5%(+2.36)#2,419 |
| 38. | 85253 | 5.8% | 3.6%(+2.28)#38 | 3.5%(+2.32)#2,461 |
| 39. | 85611 | 5.8% | 3.6%(+2.28)#39 | 3.5%(+2.31)#2,467 |
| 40. | 85016 | 5.7% | 3.6%(+2.11)#40 | 3.5%(+2.14)#2,619 |
| 41. | 85382 | 5.5% | 3.6%(+1.98)#41 | 3.5%(+2.01)#2,742 |
| 42. | 85283 | 5.5% | 3.6%(+1.94)#42 | 3.5%(+1.97)#2,792 |
| 43. | 86434 | 5.5% | 3.6%(+1.91)#43 | 3.5%(+1.94)#2,817 |
| 44. | 85215 | 5.5% | 3.6%(+1.90)#44 | 3.5%(+1.93)#2,833 |
| 45. | 85003 | 5.4% | 3.6%(+1.87)#45 | 3.5%(+1.90)#2,862 |
| 46. | 85629 | 5.4% | 3.6%(+1.83)#46 | 3.5%(+1.86)#2,908 |
| 47. | 85014 | 5.2% | 3.6%(+1.63)#47 | 3.5%(+1.66)#3,143 |
| 48. | 85257 | 5.2% | 3.6%(+1.62)#48 | 3.5%(+1.66)#3,150 |
| 49. | 85268 | 5.2% | 3.6%(+1.62)#49 | 3.5%(+1.65)#3,156 |
| 50. | 85748 | 5.0% | 3.6%(+1.48)#50 | 3.5%(+1.51)#3,322 |
| 51. | 85233 | 5.0% | 3.6%(+1.46)#51 | 3.5%(+1.50)#3,333 |
| 52. | 85641 | 4.9% | 3.6%(+1.37)#52 | 3.5%(+1.40)#3,462 |
| 53. | 85310 | 4.9% | 3.6%(+1.37)#53 | 3.5%(+1.40)#3,469 |
| 54. | 85297 | 4.9% | 3.6%(+1.30)#54 | 3.5%(+1.34)#3,555 |
| 55. | 85213 | 4.8% | 3.6%(+1.27)#55 | 3.5%(+1.31)#3,600 |
| 56. | 85023 | 4.8% | 3.6%(+1.22)#56 | 3.5%(+1.25)#3,680 |
| 57. | 85308 | 4.7% | 3.6%(+1.15)#57 | 3.5%(+1.18)#3,795 |
| 58. | 85936 | 4.7% | 3.6%(+1.13)#58 | 3.5%(+1.16)#3,813 |
| 59. | 85747 | 4.7% | 3.6%(+1.12)#59 | 3.5%(+1.15)#3,833 |
| 60. | 86325 | 4.6% | 3.6%(+1.09)#60 | 3.5%(+1.12)#3,873 |
| 61. | 85750 | 4.6% | 3.6%(+1.07)#61 | 3.5%(+1.11)#3,894 |
| 62. | 85024 | 4.6% | 3.6%(+1.07)#62 | 3.5%(+1.10)#3,903 |
| 63. | 86327 | 4.5% | 3.6%(+0.920)#63 | 3.5%(+0.952)#4,121 |
| 64. | 85715 | 4.5% | 3.6%(+0.911)#64 | 3.5%(+0.943)#4,135 |
| 65. | 85021 | 4.4% | 3.6%(+0.883)#65 | 3.5%(+0.915)#4,201 |
| 66. | 85741 | 4.4% | 3.6%(+0.871)#66 | 3.5%(+0.903)#4,224 |
| 67. | 85032 | 4.4% | 3.6%(+0.827)#67 | 3.5%(+0.859)#4,290 |
| 68. | 86411 | 4.3% | 3.6%(+0.791)#68 | 3.5%(+0.823)#4,348 |
| 69. | 85028 | 4.3% | 3.6%(+0.740)#69 | 3.5%(+0.772)#4,438 |
| 70. | 85712 | 4.3% | 3.6%(+0.714)#70 | 3.5%(+0.746)#4,479 |
| 71. | 86024 | 4.3% | 3.6%(+0.712)#71 | 3.5%(+0.744)#4,481 |
| 72. | 85258 | 4.3% | 3.6%(+0.711)#72 | 3.5%(+0.743)#4,482 |
| 73. | 86021 | 4.2% | 3.6%(+0.680)#73 | 3.5%(+0.712)#4,542 |
| 74. | 85225 | 4.2% | 3.6%(+0.672)#74 | 3.5%(+0.704)#4,560 |
| 75. | 85022 | 4.1% | 3.6%(+0.581)#75 | 3.5%(+0.613)#4,735 |
| 76. | 85716 | 4.1% | 3.6%(+0.552)#76 | 3.5%(+0.584)#4,797 |
| 77. | 85210 | 4.1% | 3.6%(+0.523)#77 | 3.5%(+0.555)#4,858 |
| 78. | 85331 | 4.1% | 3.6%(+0.510)#78 | 3.5%(+0.542)#4,891 |
| 79. | 85737 | 4.0% | 3.6%(+0.474)#79 | 3.5%(+0.505)#4,972 |
| 80. | 85543 | 4.0% | 3.6%(+0.469)#80 | 3.5%(+0.501)#4,983 |
| 81. | 85306 | 4.0% | 3.6%(+0.461)#81 | 3.5%(+0.493)#5,002 |
| 82. | 85087 | 4.0% | 3.6%(+0.459)#82 | 3.5%(+0.491)#5,004 |
| 83. | 85205 | 3.8% | 3.6%(+0.271)#83 | 3.5%(+0.303)#5,409 |
| 84. | 85209 | 3.8% | 3.6%(+0.263)#84 | 3.5%(+0.294)#5,431 |
| 85. | 85142 | 3.8% | 3.6%(+0.250)#85 | 3.5%(+0.282)#5,466 |
| 86. | 85255 | 3.8% | 3.6%(+0.224)#86 | 3.5%(+0.256)#5,532 |
| 87. | 85012 | 3.8% | 3.6%(+0.221)#87 | 3.5%(+0.253)#5,538 |
| 88. | 86511 | 3.7% | 3.6%(+0.184)#88 | 3.5%(+0.216)#5,617 |
| 89. | 85234 | 3.7% | 3.6%(+0.162)#89 | 3.5%(+0.194)#5,673 |
| 90. | 85704 | 3.7% | 3.6%(+0.150)#90 | 3.5%(+0.182)#5,707 |
| 91. | 86004 | 3.7% | 3.6%(+0.141)#91 | 3.5%(+0.173)#5,733 |
| 92. | 85202 | 3.7% | 3.6%(+0.136)#92 | 3.5%(+0.168)#5,745 |
| 93. | 85013 | 3.6% | 3.6%(+0.089)#93 | 3.5%(+0.121)#5,853 |
| 94. | 85339 | 3.6% | 3.6%(+0.048)#94 | 3.5%(+0.080)#5,949 |
| 95. | 85646 | 3.5% | 3.6%(-0.019)#95 | 3.5%(+0.013)#6,104 |
| 96. | 85940 | 3.5% | 3.6%(-0.027)#96 | 3.5%(+0.005)#6,135 |
| 97. | 85381 | 3.5% | 3.6%(-0.035)#97 | 3.5%(-0.003)#6,152 |
| 98. | 85719 | 3.5% | 3.6%(-0.075)#98 | 3.5%(-0.043)#6,250 |
| 99. | 85745 | 3.5% | 3.6%(-0.089)#99 | 3.5%(-0.057)#6,288 |
| 100. | 85718 | 3.5% | 3.6%(-0.089)#100 | 3.5%(-0.057)#6,289 |
Common Questions
What are the Top 10 Zip Codes with the Highest Percentage of Population Employed in Computer & Mathematics in Arizona?
Top 10 Zip Codes with the Highest Percentage of Population Employed in Computer & Mathematics in Arizona are:
What zip code has the Highest Percentage of Population Employed in Computer & Mathematics in Arizona?
86038 has the Highest Percentage of Population Employed in Computer & Mathematics in Arizona with 18.8%.
What is the Percentage of Population Employed in Computer & Mathematics in the State of Arizona?
Percentage of Population Employed in Computer & Mathematics in Arizona is 3.6%.
What is the Percentage of Population Employed in Computer & Mathematics in the United States?
Percentage of Population Employed in Computer & Mathematics in the United States is 3.5%.