Zip Codes with the Highest Percentage of Population Employed in Computer & Mathematics in Iowa
RELATED REPORTS & OPTIONS
Computer & Mathematics
Iowa
Compare Zip Codes
Map of Zip Codes with the Highest Percentage of Population Employed in Computer & Mathematics in Iowa
0.0%
20.0%
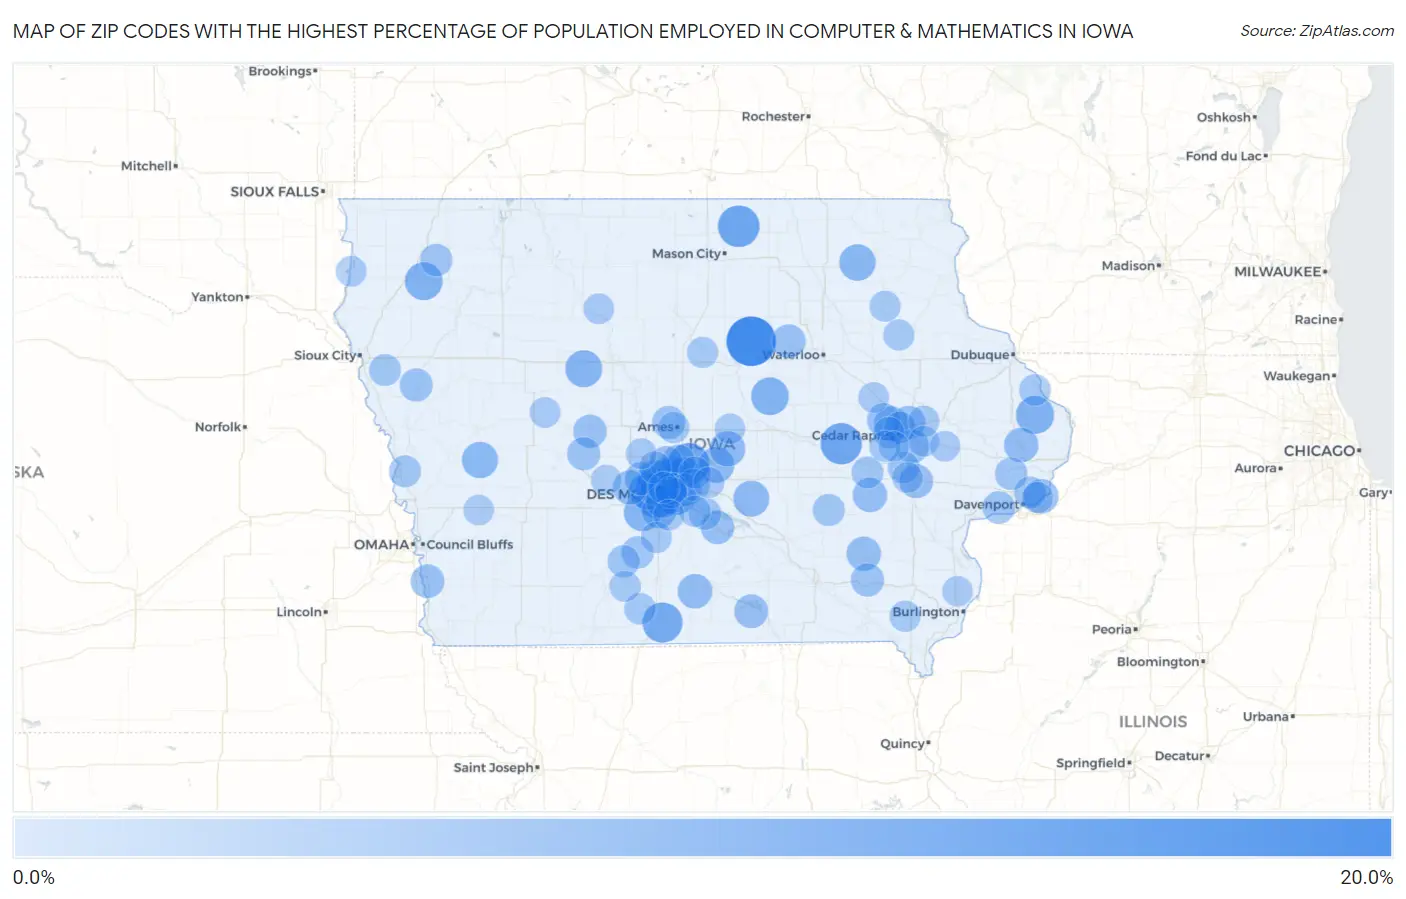
Zip Codes with the Highest Percentage of Population Employed in Computer & Mathematics in Iowa
| Zip Code | % Employed | vs State | vs National | |
| 1. | 50608 | 19.0% | 2.7%(+16.3)#1 | 3.5%(+15.5)#150 |
| 2. | 50440 | 12.5% | 2.7%(+9.79)#2 | 3.5%(+8.98)#398 |
| 3. | 50073 | 12.4% | 2.7%(+9.65)#3 | 3.5%(+8.84)#409 |
| 4. | 52257 | 12.2% | 2.7%(+9.52)#4 | 3.5%(+8.71)#420 |
| 5. | 50144 | 11.3% | 2.7%(+8.55)#5 | 3.5%(+7.74)#527 |
| 6. | 50309 | 10.7% | 2.7%(+7.96)#6 | 3.5%(+7.15)#609 |
| 7. | 50266 | 10.0% | 2.7%(+7.26)#7 | 3.5%(+6.44)#715 |
| 8. | 52074 | 9.5% | 2.7%(+6.79)#8 | 3.5%(+5.97)#796 |
| 9. | 51022 | 9.4% | 2.7%(+6.68)#9 | 3.5%(+5.86)#816 |
| 10. | 50609 | 9.2% | 2.7%(+6.52)#10 | 3.5%(+5.70)#848 |
| 11. | 50261 | 8.8% | 2.7%(+6.12)#11 | 3.5%(+5.30)#945 |
| 12. | 50263 | 8.7% | 2.7%(+5.96)#12 | 3.5%(+5.15)#1,001 |
| 13. | 50586 | 8.7% | 2.7%(+5.95)#13 | 3.5%(+5.13)#1,008 |
| 14. | 50111 | 8.5% | 2.7%(+5.83)#14 | 3.5%(+5.01)#1,040 |
| 15. | 52171 | 8.2% | 2.7%(+5.52)#15 | 3.5%(+4.70)#1,141 |
| 16. | 50323 | 8.1% | 2.7%(+5.37)#16 | 3.5%(+4.56)#1,185 |
| 17. | 51527 | 8.1% | 2.7%(+5.36)#17 | 3.5%(+4.55)#1,187 |
| 18. | 50168 | 7.9% | 2.7%(+5.16)#18 | 3.5%(+4.34)#1,249 |
| 19. | 50131 | 7.8% | 2.7%(+5.11)#19 | 3.5%(+4.29)#1,271 |
| 20. | 50232 | 7.8% | 2.7%(+5.10)#20 | 3.5%(+4.29)#1,275 |
| 21. | 50234 | 7.5% | 2.7%(+4.76)#21 | 3.5%(+3.94)#1,398 |
| 22. | 50325 | 7.0% | 2.7%(+4.30)#22 | 3.5%(+3.48)#1,622 |
| 23. | 50324 | 7.0% | 2.7%(+4.29)#23 | 3.5%(+3.47)#1,626 |
| 24. | 50312 | 6.9% | 2.7%(+4.20)#24 | 3.5%(+3.39)#1,673 |
| 25. | 52411 | 6.8% | 2.7%(+4.11)#25 | 3.5%(+3.30)#1,727 |
| 26. | 50068 | 6.7% | 2.7%(+4.00)#26 | 3.5%(+3.19)#1,788 |
| 27. | 52774 | 6.7% | 2.7%(+3.96)#27 | 3.5%(+3.14)#1,823 |
| 28. | 52767 | 6.6% | 2.7%(+3.85)#28 | 3.5%(+3.03)#1,884 |
| 29. | 52325 | 6.6% | 2.7%(+3.84)#29 | 3.5%(+3.03)#1,892 |
| 30. | 50003 | 6.5% | 2.7%(+3.81)#30 | 3.5%(+3.00)#1,910 |
| 31. | 52585 | 6.5% | 2.7%(+3.81)#31 | 3.5%(+3.00)#1,912 |
| 32. | 50061 | 6.5% | 2.7%(+3.78)#32 | 3.5%(+2.97)#1,936 |
| 33. | 52245 | 6.1% | 2.7%(+3.39)#33 | 3.5%(+2.57)#2,232 |
| 34. | 52574 | 6.0% | 2.7%(+3.34)#34 | 3.5%(+2.52)#2,273 |
| 35. | 50660 | 6.0% | 2.7%(+3.30)#35 | 3.5%(+2.48)#2,305 |
| 36. | 51561 | 6.0% | 2.7%(+3.25)#36 | 3.5%(+2.44)#2,344 |
| 37. | 50021 | 6.0% | 2.7%(+3.24)#37 | 3.5%(+2.43)#2,356 |
| 38. | 52302 | 5.8% | 2.7%(+3.08)#38 | 3.5%(+2.26)#2,505 |
| 39. | 52324 | 5.8% | 2.7%(+3.06)#39 | 3.5%(+2.25)#2,519 |
| 40. | 52227 | 5.8% | 2.7%(+3.04)#40 | 3.5%(+2.23)#2,537 |
| 41. | 50129 | 5.7% | 2.7%(+3.02)#41 | 3.5%(+2.20)#2,561 |
| 42. | 50023 | 5.7% | 2.7%(+3.01)#42 | 3.5%(+2.20)#2,564 |
| 43. | 50063 | 5.7% | 2.7%(+3.01)#43 | 3.5%(+2.19)#2,565 |
| 44. | 50225 | 5.7% | 2.7%(+3.00)#44 | 3.5%(+2.18)#2,581 |
| 45. | 50265 | 5.7% | 2.7%(+3.00)#45 | 3.5%(+2.18)#2,584 |
| 46. | 50014 | 5.7% | 2.7%(+2.99)#46 | 3.5%(+2.17)#2,592 |
| 47. | 52556 | 5.7% | 2.7%(+2.98)#47 | 3.5%(+2.16)#2,602 |
| 48. | 50007 | 5.7% | 2.7%(+2.97)#48 | 3.5%(+2.15)#2,613 |
| 49. | 50026 | 5.6% | 2.7%(+2.92)#49 | 3.5%(+2.10)#2,658 |
| 50. | 51044 | 5.6% | 2.7%(+2.85)#50 | 3.5%(+2.03)#2,725 |
| 51. | 50317 | 5.4% | 2.7%(+2.66)#51 | 3.5%(+1.85)#2,933 |
| 52. | 50226 | 5.4% | 2.7%(+2.65)#52 | 3.5%(+1.83)#2,946 |
| 53. | 52726 | 5.1% | 2.7%(+2.39)#53 | 3.5%(+1.57)#3,231 |
| 54. | 52746 | 5.0% | 2.7%(+2.33)#54 | 3.5%(+1.51)#3,323 |
| 55. | 51231 | 5.0% | 2.7%(+2.25)#55 | 3.5%(+1.43)#3,409 |
| 56. | 50222 | 5.0% | 2.7%(+2.24)#56 | 3.5%(+1.43)#3,423 |
| 57. | 50009 | 4.9% | 2.7%(+2.22)#57 | 3.5%(+1.40)#3,463 |
| 58. | 50310 | 4.9% | 2.7%(+2.18)#58 | 3.5%(+1.36)#3,522 |
| 59. | 50149 | 4.8% | 2.7%(+2.07)#59 | 3.5%(+1.25)#3,681 |
| 60. | 50109 | 4.8% | 2.7%(+2.05)#60 | 3.5%(+1.23)#3,704 |
| 61. | 50118 | 4.8% | 2.7%(+2.04)#61 | 3.5%(+1.23)#3,711 |
| 62. | 50136 | 4.7% | 2.7%(+2.03)#62 | 3.5%(+1.21)#3,734 |
| 63. | 50035 | 4.7% | 2.7%(+1.96)#63 | 3.5%(+1.14)#3,841 |
| 64. | 52807 | 4.6% | 2.7%(+1.90)#64 | 3.5%(+1.08)#3,936 |
| 65. | 52317 | 4.6% | 2.7%(+1.89)#65 | 3.5%(+1.08)#3,939 |
| 66. | 50311 | 4.6% | 2.7%(+1.87)#66 | 3.5%(+1.05)#3,977 |
| 67. | 51007 | 4.6% | 2.7%(+1.86)#67 | 3.5%(+1.05)#3,984 |
| 68. | 51557 | 4.5% | 2.7%(+1.80)#68 | 3.5%(+0.980)#4,069 |
| 69. | 52402 | 4.5% | 2.7%(+1.79)#69 | 3.5%(+0.975)#4,073 |
| 70. | 52334 | 4.5% | 2.7%(+1.77)#70 | 3.5%(+0.953)#4,119 |
| 71. | 50322 | 4.4% | 2.7%(+1.64)#71 | 3.5%(+0.826)#4,342 |
| 72. | 50108 | 4.3% | 2.7%(+1.55)#72 | 3.5%(+0.731)#4,504 |
| 73. | 52031 | 4.3% | 2.7%(+1.55)#73 | 3.5%(+0.730)#4,507 |
| 74. | 52405 | 4.1% | 2.7%(+1.42)#74 | 3.5%(+0.608)#4,745 |
| 75. | 52228 | 4.1% | 2.7%(+1.36)#75 | 3.5%(+0.546)#4,880 |
| 76. | 50047 | 4.1% | 2.7%(+1.36)#76 | 3.5%(+0.545)#4,883 |
| 77. | 50012 | 4.0% | 2.7%(+1.32)#77 | 3.5%(+0.499)#4,986 |
| 78. | 50240 | 4.0% | 2.7%(+1.28)#78 | 3.5%(+0.464)#5,071 |
| 79. | 52336 | 4.0% | 2.7%(+1.27)#79 | 3.5%(+0.457)#5,087 |
| 80. | 52722 | 4.0% | 2.7%(+1.26)#80 | 3.5%(+0.449)#5,103 |
| 81. | 50650 | 3.9% | 2.7%(+1.19)#81 | 3.5%(+0.372)#5,259 |
| 82. | 50254 | 3.8% | 2.7%(+1.14)#82 | 3.5%(+0.322)#5,368 |
| 83. | 52631 | 3.8% | 2.7%(+1.14)#83 | 3.5%(+0.322)#5,370 |
| 84. | 50006 | 3.8% | 2.7%(+1.12)#84 | 3.5%(+0.303)#5,408 |
| 85. | 52142 | 3.8% | 2.7%(+1.11)#85 | 3.5%(+0.296)#5,426 |
| 86. | 50211 | 3.8% | 2.7%(+1.09)#86 | 3.5%(+0.273)#5,486 |
| 87. | 50169 | 3.7% | 2.7%(+1.03)#87 | 3.5%(+0.217)#5,613 |
| 88. | 51023 | 3.6% | 2.7%(+0.910)#88 | 3.5%(+0.094)#5,919 |
| 89. | 50276 | 3.6% | 2.7%(+0.908)#89 | 3.5%(+0.092)#5,922 |
| 90. | 51452 | 3.6% | 2.7%(+0.906)#90 | 3.5%(+0.090)#5,930 |
| 91. | 50582 | 3.6% | 2.7%(+0.863)#91 | 3.5%(+0.047)#6,008 |
| 92. | 52314 | 3.5% | 2.7%(+0.835)#92 | 3.5%(+0.018)#6,088 |
| 93. | 52241 | 3.5% | 2.7%(+0.825)#93 | 3.5%(+0.009)#6,118 |
| 94. | 52345 | 3.5% | 2.7%(+0.822)#94 | 3.5%(+0.006)#6,130 |
| 95. | 52306 | 3.5% | 2.7%(+0.805)#95 | 3.5%(-0.011)#6,175 |
| 96. | 51521 | 3.5% | 2.7%(+0.794)#96 | 3.5%(-0.022)#6,201 |
| 97. | 50146 | 3.5% | 2.7%(+0.792)#97 | 3.5%(-0.025)#6,208 |
| 98. | 52650 | 3.5% | 2.7%(+0.761)#98 | 3.5%(-0.055)#6,281 |
| 99. | 50247 | 3.4% | 2.7%(+0.645)#99 | 3.5%(-0.171)#6,609 |
| 100. | 52404 | 3.3% | 2.7%(+0.640)#100 | 3.5%(-0.176)#6,629 |
Common Questions
What are the Top 10 Zip Codes with the Highest Percentage of Population Employed in Computer & Mathematics in Iowa?
Top 10 Zip Codes with the Highest Percentage of Population Employed in Computer & Mathematics in Iowa are:
What zip code has the Highest Percentage of Population Employed in Computer & Mathematics in Iowa?
50608 has the Highest Percentage of Population Employed in Computer & Mathematics in Iowa with 19.0%.
What is the Percentage of Population Employed in Computer & Mathematics in the State of Iowa?
Percentage of Population Employed in Computer & Mathematics in Iowa is 2.7%.
What is the Percentage of Population Employed in Computer & Mathematics in the United States?
Percentage of Population Employed in Computer & Mathematics in the United States is 3.5%.