Zip Codes with the Highest Percentage of Population Employed in Computer & Mathematics in Springfield, OR
RELATED REPORTS & OPTIONS
Computer & Mathematics
Springfield
Compare Zip Codes
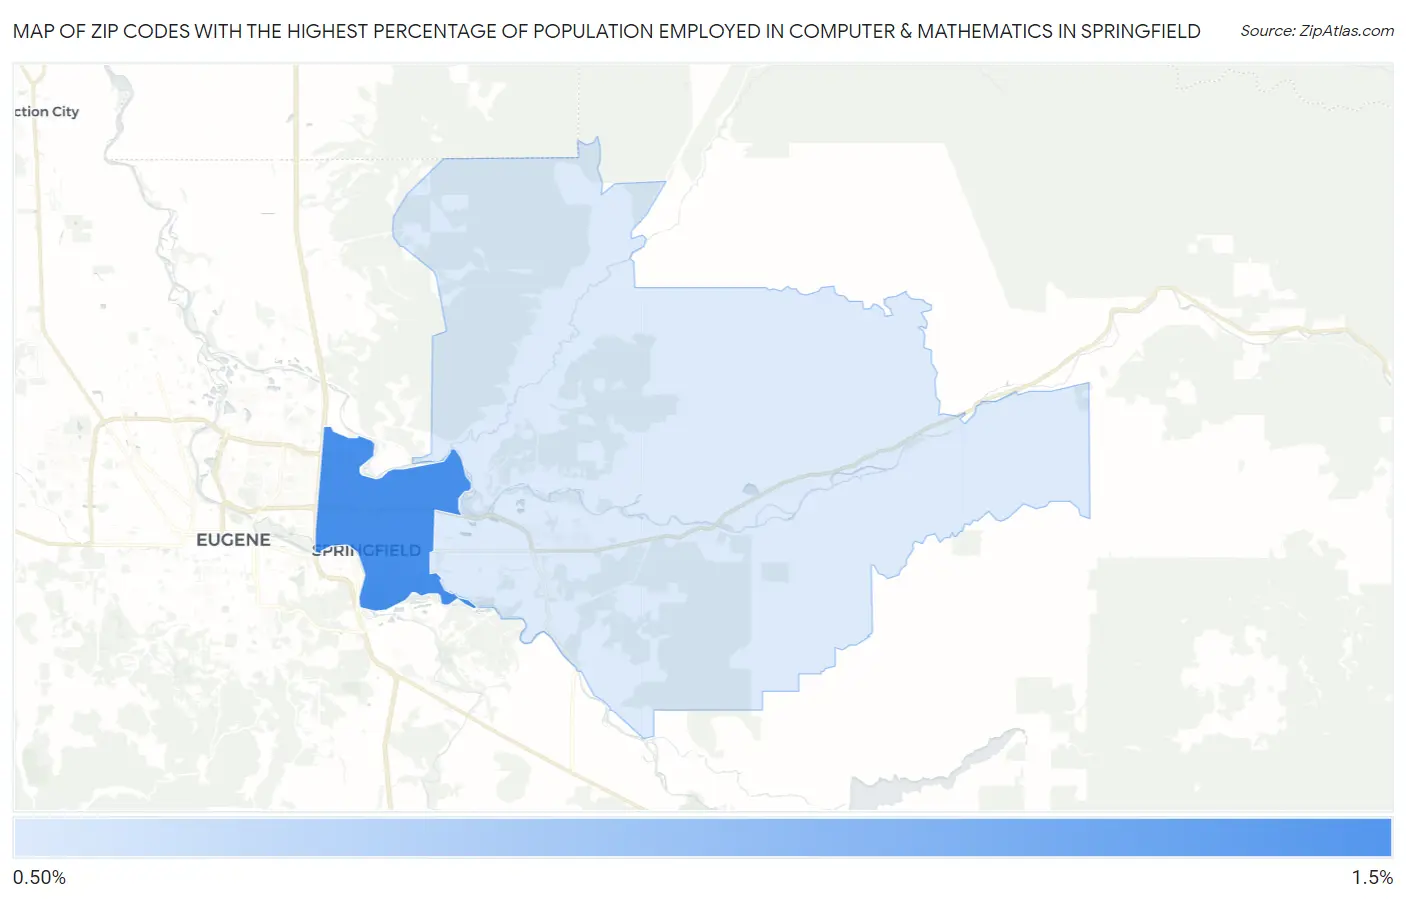
Map of Zip Codes with the Highest Percentage of Population Employed in Computer & Mathematics in Springfield
1.1%
1.2%
Zip Codes with the Highest Percentage of Population Employed in Computer & Mathematics in Springfield, OR
| Zip Code | % Employed | vs State | vs National | |
| 1. | 97477 | 1.2% | 3.5%(-2.24)#201 | 3.5%(-2.31)#16,072 |
| 2. | 97478 | 1.1% | 3.5%(-2.31)#204 | 3.5%(-2.38)#16,477 |
1
Common Questions
What are the Top Zip Codes with the Highest Percentage of Population Employed in Computer & Mathematics in Springfield, OR?
Top Zip Codes with the Highest Percentage of Population Employed in Computer & Mathematics in Springfield, OR are:
What zip code has the Highest Percentage of Population Employed in Computer & Mathematics in Springfield, OR?
97477 has the Highest Percentage of Population Employed in Computer & Mathematics in Springfield, OR with 1.2%.
What is the Percentage of Population Employed in Computer & Mathematics in Springfield, OR?
Percentage of Population Employed in Computer & Mathematics in Springfield is 1.1%.
What is the Percentage of Population Employed in Computer & Mathematics in Oregon?
Percentage of Population Employed in Computer & Mathematics in Oregon is 3.5%.
What is the Percentage of Population Employed in Computer & Mathematics in the United States?
Percentage of Population Employed in Computer & Mathematics in the United States is 3.5%.