Zip Codes with the Highest Percentage of Population Employed in Computer & Mathematics in South Carolina
RELATED REPORTS & OPTIONS
Computer & Mathematics
South Carolina
Compare Zip Codes
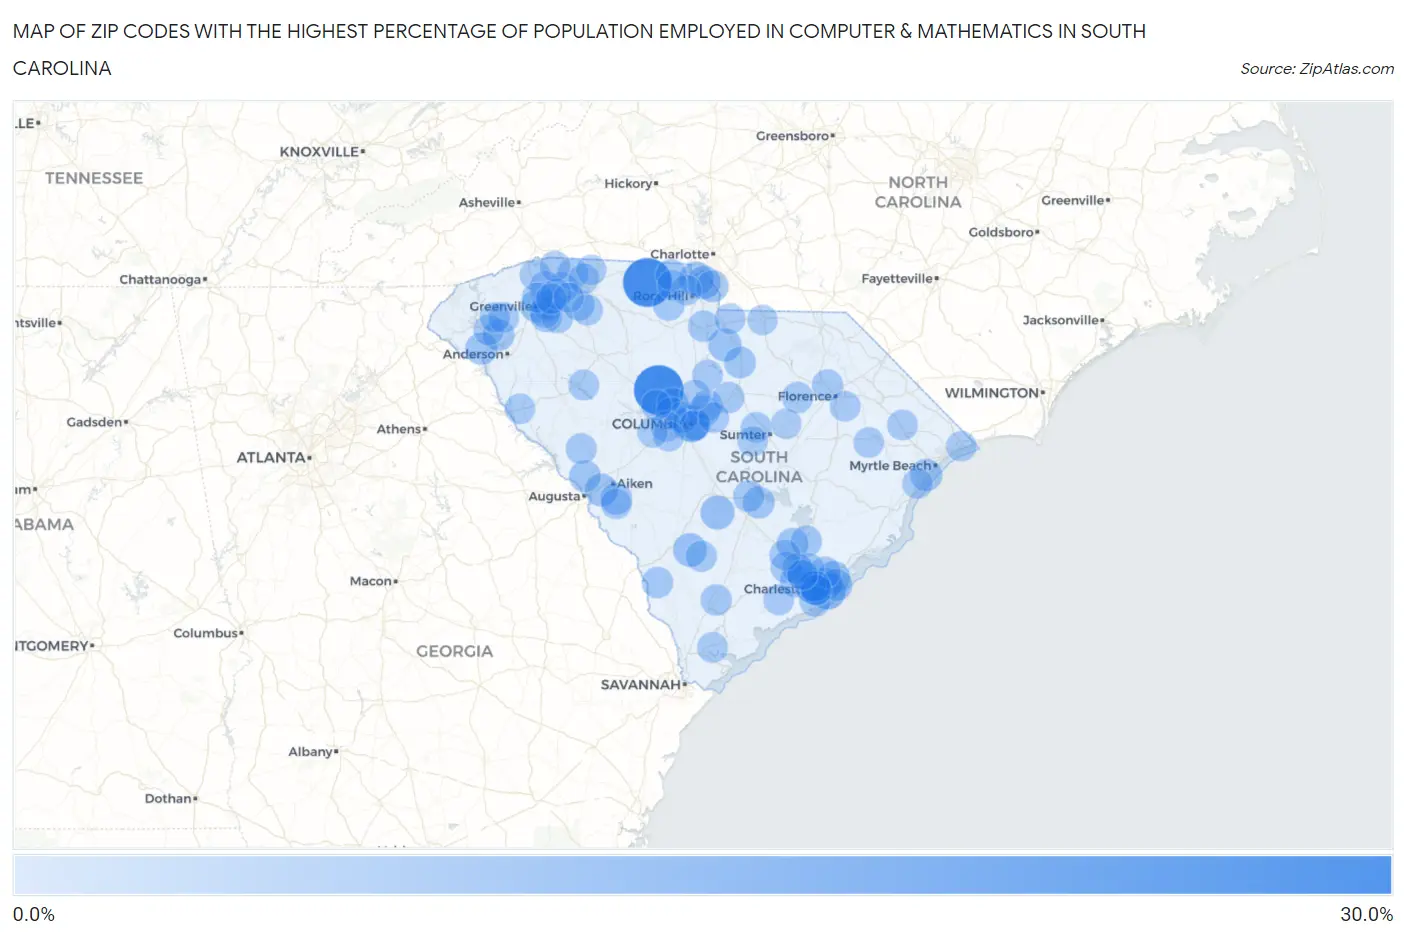
Map of Zip Codes with the Highest Percentage of Population Employed in Computer & Mathematics in South Carolina
0.0%
30.0%
Zip Codes with the Highest Percentage of Population Employed in Computer & Mathematics in South Carolina
| Zip Code | % Employed | vs State | vs National | |
| 1. | 29122 | 29.4% | 2.4%(+27.0)#1 | 3.5%(+25.9)#53 |
| 2. | 29743 | 28.5% | 2.4%(+26.1)#2 | 3.5%(+25.0)#60 |
| 3. | 29225 | 11.3% | 2.4%(+8.85)#3 | 3.5%(+7.74)#526 |
| 4. | 29482 | 10.7% | 2.4%(+8.30)#4 | 3.5%(+7.20)#601 |
| 5. | 29133 | 7.5% | 2.4%(+5.06)#5 | 3.5%(+3.96)#1,394 |
| 6. | 29708 | 7.5% | 2.4%(+5.03)#6 | 3.5%(+3.93)#1,405 |
| 7. | 29409 | 7.4% | 2.4%(+5.02)#7 | 3.5%(+3.91)#1,410 |
| 8. | 29081 | 6.9% | 2.4%(+4.52)#8 | 3.5%(+3.41)#1,660 |
| 9. | 29715 | 6.7% | 2.4%(+4.25)#9 | 3.5%(+3.14)#1,818 |
| 10. | 29058 | 6.3% | 2.4%(+3.87)#10 | 3.5%(+2.77)#2,090 |
| 11. | 29424 | 6.2% | 2.4%(+3.73)#11 | 3.5%(+2.63)#2,177 |
| 12. | 29466 | 5.9% | 2.4%(+3.47)#12 | 3.5%(+2.36)#2,416 |
| 13. | 29414 | 5.4% | 2.4%(+2.96)#13 | 3.5%(+1.85)#2,918 |
| 14. | 29851 | 5.4% | 2.4%(+2.95)#14 | 3.5%(+1.85)#2,928 |
| 15. | 29464 | 5.3% | 2.4%(+2.83)#15 | 3.5%(+1.73)#3,072 |
| 16. | 29451 | 5.2% | 2.4%(+2.81)#16 | 3.5%(+1.70)#3,095 |
| 17. | 29575 | 5.2% | 2.4%(+2.75)#17 | 3.5%(+1.65)#3,161 |
| 18. | 29601 | 4.9% | 2.4%(+2.52)#18 | 3.5%(+1.41)#3,437 |
| 19. | 29689 | 4.9% | 2.4%(+2.49)#19 | 3.5%(+1.38)#3,495 |
| 20. | 29707 | 4.8% | 2.4%(+2.40)#20 | 3.5%(+1.29)#3,624 |
| 21. | 29163 | 4.6% | 2.4%(+2.21)#21 | 3.5%(+1.10)#3,906 |
| 22. | 29803 | 4.6% | 2.4%(+2.17)#22 | 3.5%(+1.06)#3,961 |
| 23. | 29063 | 4.5% | 2.4%(+2.08)#23 | 3.5%(+0.974)#4,076 |
| 24. | 29662 | 4.5% | 2.4%(+2.08)#24 | 3.5%(+0.973)#4,079 |
| 25. | 29404 | 4.4% | 2.4%(+2.02)#25 | 3.5%(+0.913)#4,204 |
| 26. | 29175 | 4.4% | 2.4%(+1.96)#26 | 3.5%(+0.850)#4,306 |
| 27. | 29860 | 4.4% | 2.4%(+1.95)#27 | 3.5%(+0.849)#4,310 |
| 28. | 29670 | 4.3% | 2.4%(+1.92)#28 | 3.5%(+0.815)#4,364 |
| 29. | 29486 | 4.3% | 2.4%(+1.87)#29 | 3.5%(+0.767)#4,450 |
| 30. | 29223 | 4.2% | 2.4%(+1.78)#30 | 3.5%(+0.679)#4,604 |
| 31. | 29492 | 4.2% | 2.4%(+1.78)#31 | 3.5%(+0.672)#4,613 |
| 32. | 29714 | 4.1% | 2.4%(+1.72)#32 | 3.5%(+0.610)#4,740 |
| 33. | 29726 | 4.0% | 2.4%(+1.60)#33 | 3.5%(+0.495)#4,997 |
| 34. | 29369 | 4.0% | 2.4%(+1.53)#34 | 3.5%(+0.428)#5,146 |
| 35. | 29945 | 3.9% | 2.4%(+1.44)#35 | 3.5%(+0.339)#5,328 |
| 36. | 29142 | 3.8% | 2.4%(+1.39)#36 | 3.5%(+0.285)#5,456 |
| 37. | 29407 | 3.8% | 2.4%(+1.38)#37 | 3.5%(+0.278)#5,473 |
| 38. | 29710 | 3.8% | 2.4%(+1.38)#38 | 3.5%(+0.270)#5,495 |
| 39. | 29932 | 3.8% | 2.4%(+1.35)#39 | 3.5%(+0.249)#5,549 |
| 40. | 29461 | 3.8% | 2.4%(+1.35)#40 | 3.5%(+0.242)#5,560 |
| 41. | 29410 | 3.7% | 2.4%(+1.30)#41 | 3.5%(+0.199)#5,662 |
| 42. | 29615 | 3.7% | 2.4%(+1.30)#42 | 3.5%(+0.191)#5,684 |
| 43. | 29078 | 3.7% | 2.4%(+1.29)#43 | 3.5%(+0.187)#5,692 |
| 44. | 29681 | 3.7% | 2.4%(+1.29)#44 | 3.5%(+0.182)#5,709 |
| 45. | 29485 | 3.7% | 2.4%(+1.27)#45 | 3.5%(+0.162)#5,763 |
| 46. | 29069 | 3.7% | 2.4%(+1.25)#46 | 3.5%(+0.147)#5,802 |
| 47. | 29532 | 3.6% | 2.4%(+1.19)#47 | 3.5%(+0.082)#5,946 |
| 48. | 29082 | 3.5% | 2.4%(+1.13)#48 | 3.5%(+0.022)#6,081 |
| 49. | 29201 | 3.5% | 2.4%(+1.08)#49 | 3.5%(-0.021)#6,199 |
| 50. | 29210 | 3.5% | 2.4%(+1.08)#50 | 3.5%(-0.026)#6,210 |
| 51. | 29412 | 3.4% | 2.4%(+0.968)#51 | 3.5%(-0.137)#6,520 |
| 52. | 29349 | 3.4% | 2.4%(+0.948)#52 | 3.5%(-0.157)#6,574 |
| 53. | 29229 | 3.4% | 2.4%(+0.945)#53 | 3.5%(-0.160)#6,586 |
| 54. | 29212 | 3.4% | 2.4%(+0.932)#54 | 3.5%(-0.173)#6,618 |
| 55. | 29403 | 3.3% | 2.4%(+0.921)#55 | 3.5%(-0.184)#6,648 |
| 56. | 29376 | 3.3% | 2.4%(+0.889)#56 | 3.5%(-0.216)#6,749 |
| 57. | 29607 | 3.3% | 2.4%(+0.879)#57 | 3.5%(-0.226)#6,787 |
| 58. | 29420 | 3.3% | 2.4%(+0.857)#58 | 3.5%(-0.248)#6,850 |
| 59. | 29483 | 3.3% | 2.4%(+0.840)#59 | 3.5%(-0.265)#6,913 |
| 60. | 29365 | 3.2% | 2.4%(+0.828)#60 | 3.5%(-0.277)#6,947 |
| 61. | 29824 | 3.2% | 2.4%(+0.826)#61 | 3.5%(-0.279)#6,962 |
| 62. | 29152 | 3.2% | 2.4%(+0.776)#62 | 3.5%(-0.329)#7,108 |
| 63. | 29690 | 3.2% | 2.4%(+0.737)#63 | 3.5%(-0.368)#7,234 |
| 64. | 29401 | 3.2% | 2.4%(+0.736)#64 | 3.5%(-0.369)#7,239 |
| 65. | 29072 | 3.1% | 2.4%(+0.698)#65 | 3.5%(-0.407)#7,363 |
| 66. | 29687 | 3.1% | 2.4%(+0.681)#66 | 3.5%(-0.424)#7,405 |
| 67. | 29205 | 3.0% | 2.4%(+0.620)#67 | 3.5%(-0.485)#7,604 |
| 68. | 29720 | 3.0% | 2.4%(+0.612)#68 | 3.5%(-0.493)#7,627 |
| 69. | 29544 | 3.0% | 2.4%(+0.593)#69 | 3.5%(-0.512)#7,694 |
| 70. | 29909 | 3.0% | 2.4%(+0.590)#70 | 3.5%(-0.515)#7,710 |
| 71. | 29651 | 3.0% | 2.4%(+0.583)#71 | 3.5%(-0.522)#7,734 |
| 72. | 29332 | 3.0% | 2.4%(+0.563)#72 | 3.5%(-0.542)#7,809 |
| 73. | 29631 | 3.0% | 2.4%(+0.540)#73 | 3.5%(-0.565)#7,888 |
| 74. | 29356 | 2.9% | 2.4%(+0.491)#74 | 3.5%(-0.614)#8,066 |
| 75. | 29207 | 2.9% | 2.4%(+0.484)#75 | 3.5%(-0.621)#8,087 |
| 76. | 29809 | 2.9% | 2.4%(+0.481)#76 | 3.5%(-0.624)#8,097 |
| 77. | 29609 | 2.9% | 2.4%(+0.468)#77 | 3.5%(-0.637)#8,148 |
| 78. | 29505 | 2.9% | 2.4%(+0.453)#78 | 3.5%(-0.652)#8,200 |
| 79. | 29657 | 2.9% | 2.4%(+0.446)#79 | 3.5%(-0.659)#8,231 |
| 80. | 29130 | 2.8% | 2.4%(+0.395)#80 | 3.5%(-0.710)#8,394 |
| 81. | 29036 | 2.8% | 2.4%(+0.353)#81 | 3.5%(-0.752)#8,553 |
| 82. | 29073 | 2.8% | 2.4%(+0.333)#82 | 3.5%(-0.772)#8,619 |
| 83. | 29555 | 2.7% | 2.4%(+0.329)#83 | 3.5%(-0.776)#8,629 |
| 84. | 29650 | 2.7% | 2.4%(+0.326)#84 | 3.5%(-0.779)#8,646 |
| 85. | 29449 | 2.7% | 2.4%(+0.323)#85 | 3.5%(-0.782)#8,659 |
| 86. | 29016 | 2.7% | 2.4%(+0.320)#86 | 3.5%(-0.785)#8,670 |
| 87. | 29732 | 2.7% | 2.4%(+0.316)#87 | 3.5%(-0.789)#8,691 |
| 88. | 29418 | 2.7% | 2.4%(+0.295)#88 | 3.5%(-0.810)#8,770 |
| 89. | 29054 | 2.7% | 2.4%(+0.238)#89 | 3.5%(-0.867)#8,998 |
| 90. | 29316 | 2.6% | 2.4%(+0.214)#90 | 3.5%(-0.891)#9,090 |
| 91. | 29667 | 2.6% | 2.4%(+0.178)#91 | 3.5%(-0.927)#9,222 |
| 92. | 29582 | 2.6% | 2.4%(+0.139)#92 | 3.5%(-0.966)#9,386 |
| 93. | 29628 | 2.5% | 2.4%(+0.113)#93 | 3.5%(-0.992)#9,494 |
| 94. | 29104 | 2.5% | 2.4%(+0.106)#94 | 3.5%(-0.999)#9,537 |
| 95. | 29334 | 2.5% | 2.4%(+0.100)#95 | 3.5%(-1.00)#9,559 |
| 96. | 29576 | 2.5% | 2.4%(+0.080)#96 | 3.5%(-1.02)#9,652 |
| 97. | 29154 | 2.5% | 2.4%(+0.066)#97 | 3.5%(-1.04)#9,706 |
| 98. | 29745 | 2.5% | 2.4%(+0.033)#98 | 3.5%(-1.07)#9,829 |
| 99. | 29323 | 2.4% | 2.4%(+0.013)#99 | 3.5%(-1.09)#9,909 |
| 100. | 29728 | 2.4% | 2.4%(-0.038)#100 | 3.5%(-1.14)#10,110 |
Common Questions
What are the Top 10 Zip Codes with the Highest Percentage of Population Employed in Computer & Mathematics in South Carolina?
Top 10 Zip Codes with the Highest Percentage of Population Employed in Computer & Mathematics in South Carolina are:
What zip code has the Highest Percentage of Population Employed in Computer & Mathematics in South Carolina?
29122 has the Highest Percentage of Population Employed in Computer & Mathematics in South Carolina with 29.4%.
What is the Percentage of Population Employed in Computer & Mathematics in the State of South Carolina?
Percentage of Population Employed in Computer & Mathematics in South Carolina is 2.4%.
What is the Percentage of Population Employed in Computer & Mathematics in the United States?
Percentage of Population Employed in Computer & Mathematics in the United States is 3.5%.