Zip Codes with the Highest Percentage of Population Employed in Computer & Mathematics in Idaho
RELATED REPORTS & OPTIONS
Computer & Mathematics
Idaho
Compare Zip Codes
Map of Zip Codes with the Highest Percentage of Population Employed in Computer & Mathematics in Idaho
0.0%
25.0%
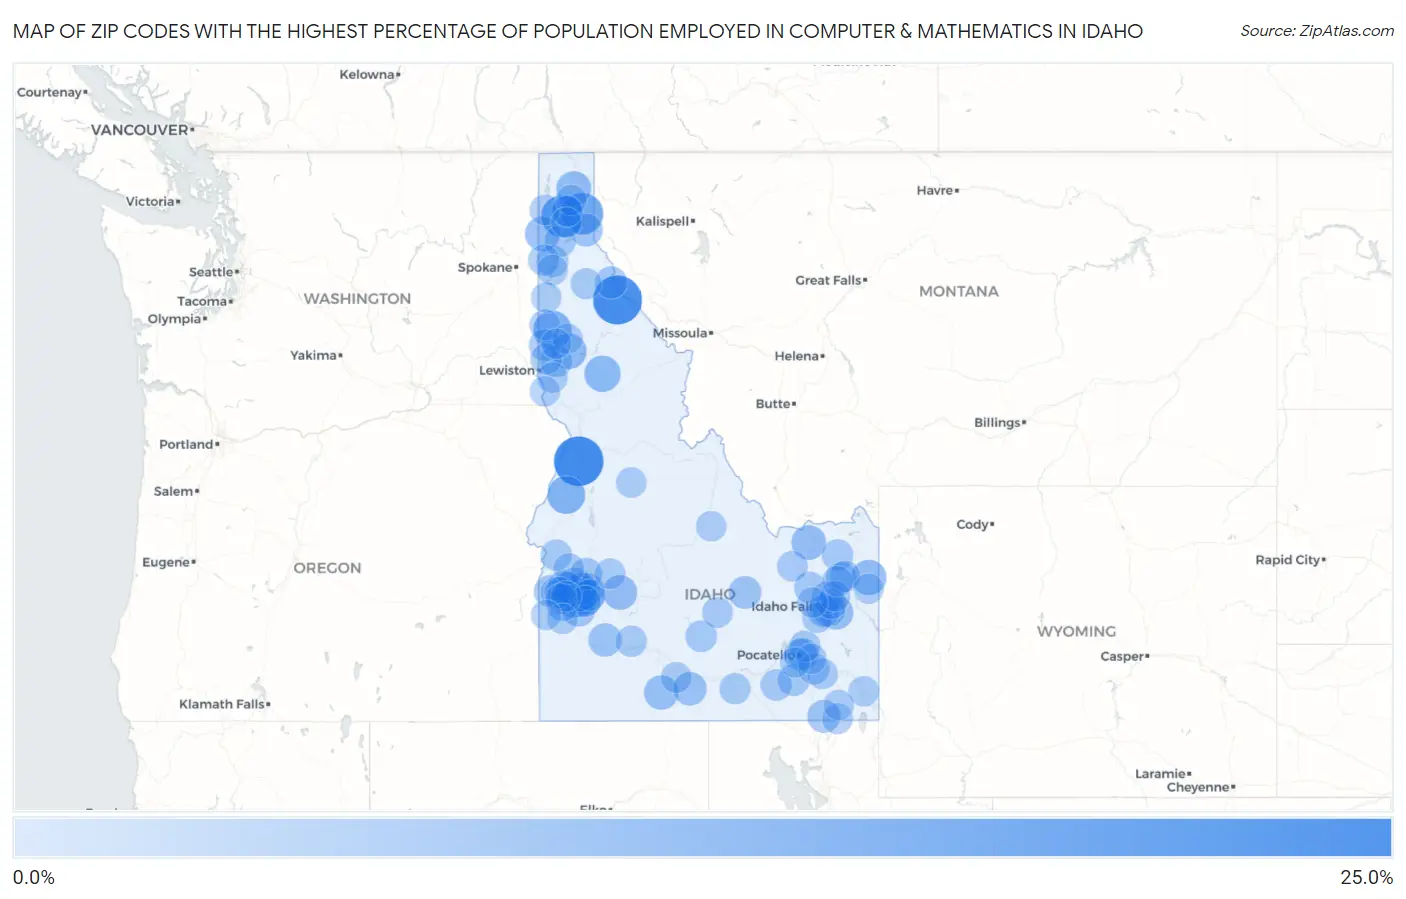
Zip Codes with the Highest Percentage of Population Employed in Computer & Mathematics in Idaho
| Zip Code | % Employed | vs State | vs National | |
| 1. | 83547 | 23.8% | 2.5%(+21.3)#1 | 3.5%(+20.3)#88 |
| 2. | 83802 | 23.0% | 2.5%(+20.5)#2 | 3.5%(+19.4)#96 |
| 3. | 83825 | 15.4% | 2.5%(+12.9)#3 | 3.5%(+11.9)#236 |
| 4. | 83836 | 14.2% | 2.5%(+11.7)#4 | 3.5%(+10.7)#293 |
| 5. | 83857 | 10.5% | 2.5%(+7.95)#5 | 3.5%(+6.95)#638 |
| 6. | 83612 | 9.9% | 2.5%(+7.41)#6 | 3.5%(+6.40)#719 |
| 7. | 83553 | 7.9% | 2.5%(+5.43)#7 | 3.5%(+4.42)#1,222 |
| 8. | 83537 | 7.4% | 2.5%(+4.92)#8 | 3.5%(+3.92)#1,409 |
| 9. | 83452 | 6.9% | 2.5%(+4.40)#9 | 3.5%(+3.39)#1,671 |
| 10. | 83642 | 6.7% | 2.5%(+4.17)#10 | 3.5%(+3.16)#1,803 |
| 11. | 83847 | 6.5% | 2.5%(+4.00)#11 | 3.5%(+3.00)#1,911 |
| 12. | 83804 | 6.4% | 2.5%(+3.86)#12 | 3.5%(+2.86)#2,011 |
| 13. | 83423 | 6.1% | 2.5%(+3.58)#13 | 3.5%(+2.58)#2,225 |
| 14. | 83706 | 6.0% | 2.5%(+3.53)#14 | 3.5%(+2.52)#2,272 |
| 15. | 83716 | 6.0% | 2.5%(+3.48)#15 | 3.5%(+2.47)#2,314 |
| 16. | 83321 | 5.9% | 2.5%(+3.33)#16 | 3.5%(+2.33)#2,450 |
| 17. | 83427 | 5.6% | 2.5%(+3.11)#17 | 3.5%(+2.11)#2,650 |
| 18. | 83713 | 5.5% | 2.5%(+2.95)#18 | 3.5%(+1.94)#2,825 |
| 19. | 83702 | 5.1% | 2.5%(+2.63)#19 | 3.5%(+1.62)#3,177 |
| 20. | 83341 | 4.9% | 2.5%(+2.39)#20 | 3.5%(+1.39)#3,485 |
| 21. | 83703 | 4.8% | 2.5%(+2.32)#21 | 3.5%(+1.31)#3,590 |
| 22. | 83646 | 4.8% | 2.5%(+2.32)#22 | 3.5%(+1.31)#3,591 |
| 23. | 83406 | 4.7% | 2.5%(+2.19)#23 | 3.5%(+1.19)#3,786 |
| 24. | 83648 | 4.6% | 2.5%(+2.04)#24 | 3.5%(+1.03)#4,000 |
| 25. | 83634 | 4.3% | 2.5%(+1.80)#25 | 3.5%(+0.794)#4,396 |
| 26. | 83811 | 4.2% | 2.5%(+1.70)#26 | 3.5%(+0.696)#4,572 |
| 27. | 83286 | 4.1% | 2.5%(+1.59)#27 | 3.5%(+0.585)#4,794 |
| 28. | 83213 | 4.0% | 2.5%(+1.44)#28 | 3.5%(+0.438)#5,130 |
| 29. | 83709 | 3.6% | 2.5%(+1.07)#29 | 3.5%(+0.064)#5,974 |
| 30. | 83616 | 3.6% | 2.5%(+1.05)#30 | 3.5%(+0.048)#6,001 |
| 31. | 83704 | 3.6% | 2.5%(+1.04)#31 | 3.5%(+0.039)#6,030 |
| 32. | 83846 | 3.3% | 2.5%(+0.826)#32 | 3.5%(-0.179)#6,638 |
| 33. | 83626 | 3.3% | 2.5%(+0.775)#33 | 3.5%(-0.230)#6,799 |
| 34. | 83209 | 3.3% | 2.5%(+0.771)#34 | 3.5%(-0.234)#6,813 |
| 35. | 83404 | 3.2% | 2.5%(+0.699)#35 | 3.5%(-0.307)#7,040 |
| 36. | 83714 | 3.2% | 2.5%(+0.689)#36 | 3.5%(-0.316)#7,070 |
| 37. | 83686 | 3.2% | 2.5%(+0.686)#37 | 3.5%(-0.319)#7,077 |
| 38. | 83212 | 3.1% | 2.5%(+0.573)#38 | 3.5%(-0.432)#7,428 |
| 39. | 83535 | 3.0% | 2.5%(+0.491)#39 | 3.5%(-0.514)#7,702 |
| 40. | 83454 | 3.0% | 2.5%(+0.488)#40 | 3.5%(-0.517)#7,716 |
| 41. | 83644 | 2.9% | 2.5%(+0.418)#41 | 3.5%(-0.587)#7,972 |
| 42. | 83843 | 2.9% | 2.5%(+0.410)#42 | 3.5%(-0.595)#8,004 |
| 43. | 83629 | 2.9% | 2.5%(+0.345)#43 | 3.5%(-0.661)#8,234 |
| 44. | 83815 | 2.8% | 2.5%(+0.265)#44 | 3.5%(-0.740)#8,510 |
| 45. | 83801 | 2.8% | 2.5%(+0.257)#45 | 3.5%(-0.748)#8,539 |
| 46. | 83271 | 2.7% | 2.5%(+0.208)#46 | 3.5%(-0.797)#8,722 |
| 47. | 83669 | 2.7% | 2.5%(+0.199)#47 | 3.5%(-0.806)#8,755 |
| 48. | 83349 | 2.6% | 2.5%(+0.120)#48 | 3.5%(-0.885)#9,066 |
| 49. | 83444 | 2.6% | 2.5%(+0.049)#49 | 3.5%(-0.956)#9,335 |
| 50. | 83607 | 2.5% | 2.5%(+0.001)#50 | 3.5%(-1.00)#9,554 |
| 51. | 83201 | 2.5% | 2.5%(-0.000)#51 | 3.5%(-1.01)#9,561 |
| 52. | 83445 | 2.5% | 2.5%(-0.032)#52 | 3.5%(-1.04)#9,698 |
| 53. | 83852 | 2.5% | 2.5%(-0.068)#53 | 3.5%(-1.07)#9,833 |
| 54. | 83712 | 2.4% | 2.5%(-0.115)#54 | 3.5%(-1.12)#10,015 |
| 55. | 83832 | 2.4% | 2.5%(-0.136)#55 | 3.5%(-1.14)#10,105 |
| 56. | 83705 | 2.3% | 2.5%(-0.219)#56 | 3.5%(-1.22)#10,447 |
| 57. | 83250 | 2.3% | 2.5%(-0.235)#57 | 3.5%(-1.24)#10,535 |
| 58. | 83605 | 2.3% | 2.5%(-0.260)#58 | 3.5%(-1.27)#10,648 |
| 59. | 83623 | 2.2% | 2.5%(-0.282)#59 | 3.5%(-1.29)#10,727 |
| 60. | 83202 | 2.2% | 2.5%(-0.293)#60 | 3.5%(-1.30)#10,771 |
| 61. | 83854 | 2.2% | 2.5%(-0.328)#61 | 3.5%(-1.33)#10,920 |
| 62. | 83651 | 2.2% | 2.5%(-0.344)#62 | 3.5%(-1.35)#11,009 |
| 63. | 83311 | 2.2% | 2.5%(-0.353)#63 | 3.5%(-1.36)#11,048 |
| 64. | 83661 | 2.2% | 2.5%(-0.357)#64 | 3.5%(-1.36)#11,062 |
| 65. | 83448 | 2.1% | 2.5%(-0.447)#65 | 3.5%(-1.45)#11,468 |
| 66. | 83850 | 1.9% | 2.5%(-0.574)#66 | 3.5%(-1.58)#12,059 |
| 67. | 83451 | 1.9% | 2.5%(-0.592)#67 | 3.5%(-1.60)#12,160 |
| 68. | 83855 | 1.9% | 2.5%(-0.651)#68 | 3.5%(-1.66)#12,442 |
| 69. | 83328 | 1.9% | 2.5%(-0.662)#69 | 3.5%(-1.67)#12,498 |
| 70. | 83320 | 1.8% | 2.5%(-0.722)#70 | 3.5%(-1.73)#12,760 |
| 71. | 83274 | 1.8% | 2.5%(-0.755)#71 | 3.5%(-1.76)#12,906 |
| 72. | 83237 | 1.7% | 2.5%(-0.773)#72 | 3.5%(-1.78)#12,987 |
| 73. | 83617 | 1.7% | 2.5%(-0.781)#73 | 3.5%(-1.79)#13,041 |
| 74. | 83401 | 1.7% | 2.5%(-0.809)#74 | 3.5%(-1.81)#13,193 |
| 75. | 83631 | 1.7% | 2.5%(-0.843)#75 | 3.5%(-1.85)#13,388 |
| 76. | 83840 | 1.6% | 2.5%(-0.876)#76 | 3.5%(-1.88)#13,555 |
| 77. | 83246 | 1.6% | 2.5%(-0.938)#77 | 3.5%(-1.94)#13,907 |
| 78. | 83435 | 1.6% | 2.5%(-0.938)#78 | 3.5%(-1.94)#13,912 |
| 79. | 83442 | 1.6% | 2.5%(-0.948)#79 | 3.5%(-1.95)#13,968 |
| 80. | 83856 | 1.6% | 2.5%(-0.959)#80 | 3.5%(-1.96)#14,026 |
| 81. | 83814 | 1.6% | 2.5%(-0.968)#81 | 3.5%(-1.97)#14,075 |
| 82. | 83440 | 1.5% | 2.5%(-0.971)#82 | 3.5%(-1.98)#14,092 |
| 83. | 83687 | 1.5% | 2.5%(-0.973)#83 | 3.5%(-1.98)#14,111 |
| 84. | 83402 | 1.5% | 2.5%(-1.02)#84 | 3.5%(-2.02)#14,349 |
| 85. | 83864 | 1.5% | 2.5%(-1.02)#85 | 3.5%(-2.03)#14,392 |
| 86. | 83254 | 1.5% | 2.5%(-1.04)#86 | 3.5%(-2.04)#14,487 |
| 87. | 83860 | 1.4% | 2.5%(-1.07)#87 | 3.5%(-2.08)#14,685 |
| 88. | 83641 | 1.4% | 2.5%(-1.09)#88 | 3.5%(-2.10)#14,777 |
| 89. | 83611 | 1.4% | 2.5%(-1.11)#89 | 3.5%(-2.11)#14,880 |
| 90. | 83823 | 1.4% | 2.5%(-1.16)#90 | 3.5%(-2.17)#15,177 |
| 91. | 83263 | 1.3% | 2.5%(-1.17)#91 | 3.5%(-2.18)#15,250 |
| 92. | 83540 | 1.3% | 2.5%(-1.21)#92 | 3.5%(-2.22)#15,500 |
| 93. | 83639 | 1.3% | 2.5%(-1.22)#93 | 3.5%(-2.22)#15,509 |
| 94. | 83245 | 1.3% | 2.5%(-1.23)#94 | 3.5%(-2.23)#15,577 |
| 95. | 83204 | 1.3% | 2.5%(-1.24)#95 | 3.5%(-2.25)#15,659 |
| 96. | 83501 | 1.3% | 2.5%(-1.24)#96 | 3.5%(-2.25)#15,665 |
| 97. | 83871 | 1.3% | 2.5%(-1.24)#97 | 3.5%(-2.25)#15,669 |
| 98. | 83226 | 1.3% | 2.5%(-1.24)#98 | 3.5%(-2.25)#15,673 |
| 99. | 83851 | 1.3% | 2.5%(-1.26)#99 | 3.5%(-2.26)#15,768 |
| 100. | 83422 | 1.2% | 2.5%(-1.28)#100 | 3.5%(-2.28)#15,895 |
Common Questions
What are the Top 10 Zip Codes with the Highest Percentage of Population Employed in Computer & Mathematics in Idaho?
Top 10 Zip Codes with the Highest Percentage of Population Employed in Computer & Mathematics in Idaho are:
What zip code has the Highest Percentage of Population Employed in Computer & Mathematics in Idaho?
83547 has the Highest Percentage of Population Employed in Computer & Mathematics in Idaho with 23.8%.
What is the Percentage of Population Employed in Computer & Mathematics in the State of Idaho?
Percentage of Population Employed in Computer & Mathematics in Idaho is 2.5%.
What is the Percentage of Population Employed in Computer & Mathematics in the United States?
Percentage of Population Employed in Computer & Mathematics in the United States is 3.5%.