Zip Codes with the Highest Percentage of Population Employed in Computer & Mathematics in New Mexico
RELATED REPORTS & OPTIONS
Computer & Mathematics
New Mexico
Compare Zip Codes
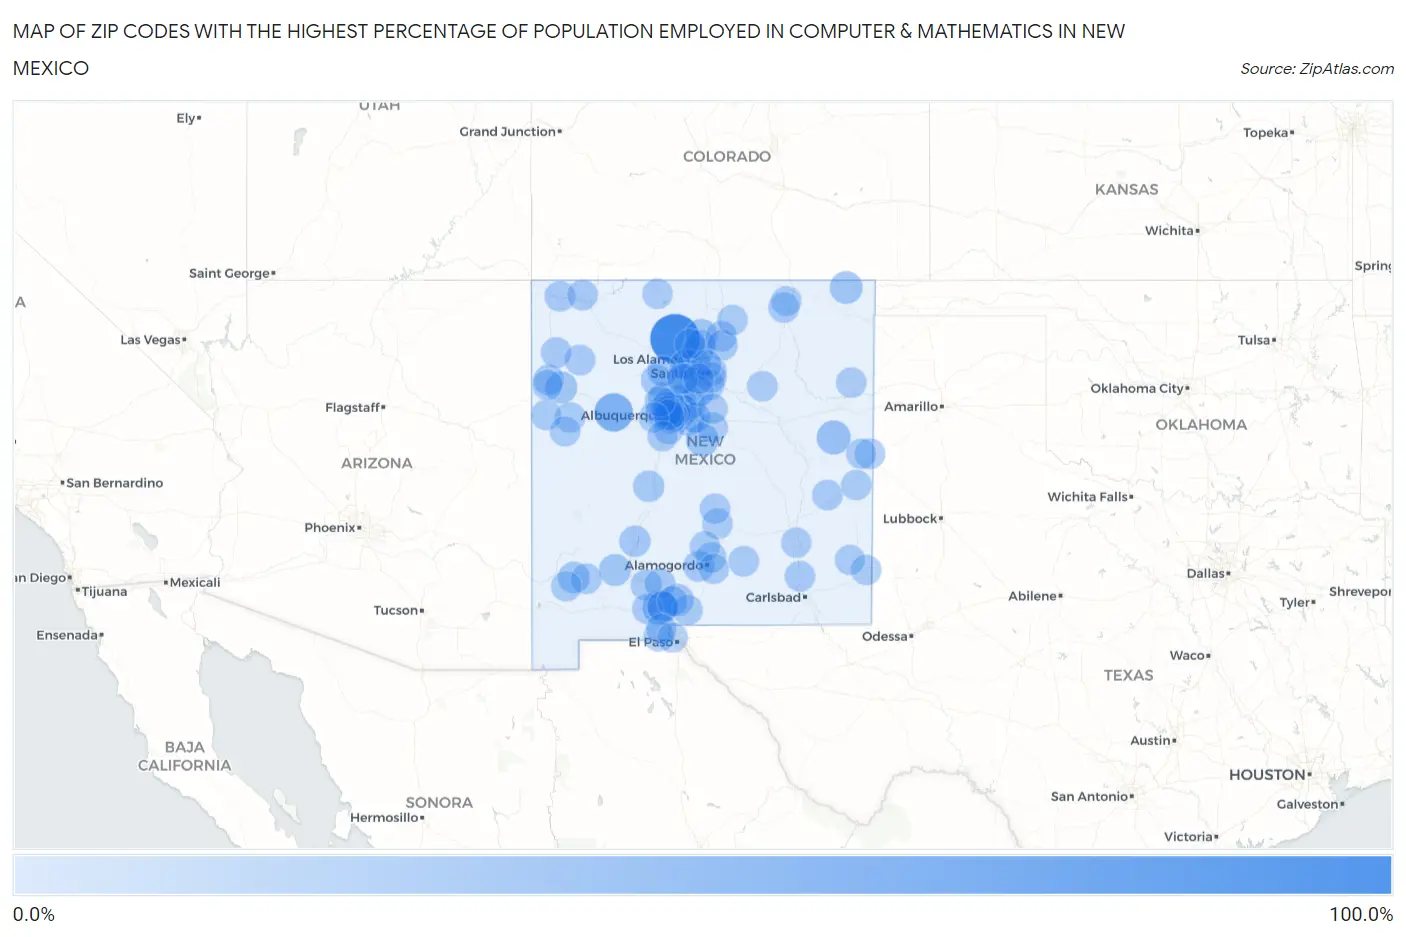
Map of Zip Codes with the Highest Percentage of Population Employed in Computer & Mathematics in New Mexico
0.0%
100.0%
Zip Codes with the Highest Percentage of Population Employed in Computer & Mathematics in New Mexico
| Zip Code | % Employed | vs State | vs National | |
| 1. | 87064 | 90.9% | 2.4%(+88.5)#1 | 3.5%(+87.4)#4 |
| 2. | 87049 | 38.2% | 2.4%(+35.7)#2 | 3.5%(+34.6)#23 |
| 3. | 88046 | 20.2% | 2.4%(+17.7)#3 | 3.5%(+16.6)#127 |
| 4. | 88427 | 17.9% | 2.4%(+15.5)#4 | 3.5%(+14.4)#177 |
| 5. | 87016 | 12.0% | 2.4%(+9.57)#5 | 3.5%(+8.49)#439 |
| 6. | 88419 | 12.0% | 2.4%(+9.56)#6 | 3.5%(+8.48)#442 |
| 7. | 87547 | 10.6% | 2.4%(+8.13)#7 | 3.5%(+7.04)#622 |
| 8. | 88002 | 10.5% | 2.4%(+8.10)#8 | 3.5%(+7.02)#623 |
| 9. | 87549 | 8.7% | 2.4%(+6.22)#9 | 3.5%(+5.14)#1,004 |
| 10. | 87316 | 8.6% | 2.4%(+6.19)#10 | 3.5%(+5.11)#1,012 |
| 11. | 88042 | 8.2% | 2.4%(+5.72)#11 | 3.5%(+4.64)#1,159 |
| 12. | 87083 | 7.9% | 2.4%(+5.48)#12 | 3.5%(+4.40)#1,228 |
| 13. | 87544 | 7.9% | 2.4%(+5.45)#13 | 3.5%(+4.37)#1,236 |
| 14. | 87113 | 7.8% | 2.4%(+5.37)#14 | 3.5%(+4.29)#1,278 |
| 15. | 87122 | 7.5% | 2.4%(+5.06)#15 | 3.5%(+3.98)#1,386 |
| 16. | 88065 | 6.6% | 2.4%(+4.17)#16 | 3.5%(+3.09)#1,847 |
| 17. | 87059 | 6.4% | 2.4%(+3.97)#17 | 3.5%(+2.89)#2,001 |
| 18. | 87043 | 5.8% | 2.4%(+3.33)#18 | 3.5%(+2.25)#2,516 |
| 19. | 87935 | 5.7% | 2.4%(+3.29)#19 | 3.5%(+2.21)#2,552 |
| 20. | 87801 | 5.4% | 2.4%(+2.97)#20 | 3.5%(+1.88)#2,887 |
| 21. | 87111 | 5.3% | 2.4%(+2.87)#21 | 3.5%(+1.79)#2,987 |
| 22. | 87047 | 5.1% | 2.4%(+2.70)#22 | 3.5%(+1.61)#3,190 |
| 23. | 87940 | 5.0% | 2.4%(+2.56)#23 | 3.5%(+1.48)#3,350 |
| 24. | 87109 | 5.0% | 2.4%(+2.55)#24 | 3.5%(+1.46)#3,371 |
| 25. | 87123 | 4.8% | 2.4%(+2.35)#25 | 3.5%(+1.27)#3,652 |
| 26. | 87008 | 4.4% | 2.4%(+2.00)#26 | 3.5%(+0.920)#4,190 |
| 27. | 87053 | 4.3% | 2.4%(+1.86)#27 | 3.5%(+0.779)#4,426 |
| 28. | 88330 | 4.3% | 2.4%(+1.85)#28 | 3.5%(+0.771)#4,439 |
| 29. | 88003 | 4.1% | 2.4%(+1.63)#29 | 3.5%(+0.548)#4,872 |
| 30. | 87317 | 3.9% | 2.4%(+1.42)#30 | 3.5%(+0.340)#5,325 |
| 31. | 87015 | 3.8% | 2.4%(+1.38)#31 | 3.5%(+0.299)#5,417 |
| 32. | 87144 | 3.7% | 2.4%(+1.29)#32 | 3.5%(+0.211)#5,629 |
| 33. | 87728 | 3.7% | 2.4%(+1.28)#33 | 3.5%(+0.199)#5,663 |
| 34. | 87532 | 3.7% | 2.4%(+1.25)#34 | 3.5%(+0.166)#5,749 |
| 35. | 87120 | 3.7% | 2.4%(+1.25)#35 | 3.5%(+0.163)#5,758 |
| 36. | 87114 | 3.7% | 2.4%(+1.23)#36 | 3.5%(+0.147)#5,801 |
| 37. | 87112 | 3.5% | 2.4%(+1.10)#37 | 3.5%(+0.016)#6,096 |
| 38. | 87566 | 3.5% | 2.4%(+1.07)#38 | 3.5%(-0.010)#6,171 |
| 39. | 87104 | 3.5% | 2.4%(+1.05)#39 | 3.5%(-0.034)#6,231 |
| 40. | 88012 | 3.5% | 2.4%(+1.04)#40 | 3.5%(-0.040)#6,244 |
| 41. | 87553 | 3.5% | 2.4%(+1.01)#41 | 3.5%(-0.070)#6,325 |
| 42. | 87068 | 3.5% | 2.4%(+1.01)#42 | 3.5%(-0.073)#6,340 |
| 43. | 87421 | 3.4% | 2.4%(+0.961)#43 | 3.5%(-0.121)#6,475 |
| 44. | 88023 | 3.2% | 2.4%(+0.795)#44 | 3.5%(-0.287)#6,986 |
| 45. | 87508 | 3.2% | 2.4%(+0.766)#45 | 3.5%(-0.316)#7,069 |
| 46. | 87041 | 3.2% | 2.4%(+0.754)#46 | 3.5%(-0.328)#7,104 |
| 47. | 87108 | 3.1% | 2.4%(+0.693)#47 | 3.5%(-0.389)#7,306 |
| 48. | 87313 | 3.1% | 2.4%(+0.634)#48 | 3.5%(-0.449)#7,475 |
| 49. | 87501 | 3.0% | 2.4%(+0.598)#49 | 3.5%(-0.484)#7,602 |
| 50. | 87106 | 3.0% | 2.4%(+0.557)#50 | 3.5%(-0.525)#7,745 |
| 51. | 87048 | 3.0% | 2.4%(+0.520)#51 | 3.5%(-0.563)#7,880 |
| 52. | 87402 | 2.9% | 2.4%(+0.452)#52 | 3.5%(-0.630)#8,125 |
| 53. | 88005 | 2.9% | 2.4%(+0.433)#53 | 3.5%(-0.649)#8,192 |
| 54. | 87325 | 2.9% | 2.4%(+0.420)#54 | 3.5%(-0.663)#8,240 |
| 55. | 87505 | 2.9% | 2.4%(+0.413)#55 | 3.5%(-0.670)#8,269 |
| 56. | 87110 | 2.8% | 2.4%(+0.380)#56 | 3.5%(-0.703)#8,370 |
| 57. | 87107 | 2.8% | 2.4%(+0.364)#57 | 3.5%(-0.718)#8,424 |
| 58. | 87102 | 2.8% | 2.4%(+0.336)#58 | 3.5%(-0.747)#8,531 |
| 59. | 87124 | 2.8% | 2.4%(+0.327)#59 | 3.5%(-0.756)#8,568 |
| 60. | 88339 | 2.6% | 2.4%(+0.176)#60 | 3.5%(-0.907)#9,148 |
| 61. | 87521 | 2.6% | 2.4%(+0.130)#61 | 3.5%(-0.952)#9,314 |
| 62. | 88001 | 2.5% | 2.4%(+0.061)#62 | 3.5%(-1.02)#9,631 |
| 63. | 87506 | 2.5% | 2.4%(+0.042)#63 | 3.5%(-1.04)#9,711 |
| 64. | 87024 | 2.5% | 2.4%(+0.023)#64 | 3.5%(-1.06)#9,783 |
| 65. | 87010 | 2.3% | 2.4%(-0.111)#65 | 3.5%(-1.19)#10,311 |
| 66. | 88341 | 2.3% | 2.4%(-0.161)#66 | 3.5%(-1.24)#10,543 |
| 67. | 88337 | 2.3% | 2.4%(-0.167)#67 | 3.5%(-1.25)#10,578 |
| 68. | 88116 | 2.2% | 2.4%(-0.256)#68 | 3.5%(-1.34)#10,954 |
| 69. | 88210 | 2.2% | 2.4%(-0.262)#69 | 3.5%(-1.34)#10,988 |
| 70. | 88135 | 2.2% | 2.4%(-0.268)#70 | 3.5%(-1.35)#11,015 |
| 71. | 87072 | 2.1% | 2.4%(-0.322)#71 | 3.5%(-1.40)#11,256 |
| 72. | 88301 | 2.1% | 2.4%(-0.323)#72 | 3.5%(-1.41)#11,262 |
| 73. | 87507 | 2.1% | 2.4%(-0.351)#73 | 3.5%(-1.43)#11,385 |
| 74. | 88008 | 2.0% | 2.4%(-0.462)#74 | 3.5%(-1.54)#11,894 |
| 75. | 88352 | 2.0% | 2.4%(-0.465)#75 | 3.5%(-1.55)#11,916 |
| 76. | 87035 | 2.0% | 2.4%(-0.489)#76 | 3.5%(-1.57)#12,024 |
| 77. | 88081 | 1.9% | 2.4%(-0.519)#77 | 3.5%(-1.60)#12,177 |
| 78. | 88130 | 1.9% | 2.4%(-0.550)#78 | 3.5%(-1.63)#12,333 |
| 79. | 88325 | 1.8% | 2.4%(-0.670)#79 | 3.5%(-1.75)#12,879 |
| 80. | 88061 | 1.7% | 2.4%(-0.696)#80 | 3.5%(-1.78)#12,991 |
| 81. | 87321 | 1.7% | 2.4%(-0.738)#81 | 3.5%(-1.82)#13,220 |
| 82. | 87701 | 1.7% | 2.4%(-0.757)#82 | 3.5%(-1.84)#13,327 |
| 83. | 87327 | 1.7% | 2.4%(-0.765)#83 | 3.5%(-1.85)#13,373 |
| 84. | 87571 | 1.6% | 2.4%(-0.871)#84 | 3.5%(-1.95)#13,973 |
| 85. | 87121 | 1.5% | 2.4%(-0.892)#85 | 3.5%(-1.97)#14,085 |
| 86. | 88426 | 1.5% | 2.4%(-0.942)#86 | 3.5%(-2.02)#14,378 |
| 87. | 87357 | 1.5% | 2.4%(-0.982)#87 | 3.5%(-2.06)#14,615 |
| 88. | 87031 | 1.4% | 2.4%(-1.01)#88 | 3.5%(-2.10)#14,774 |
| 89. | 87056 | 1.4% | 2.4%(-1.02)#89 | 3.5%(-2.11)#14,839 |
| 90. | 87301 | 1.4% | 2.4%(-1.03)#90 | 3.5%(-2.12)#14,883 |
| 91. | 87528 | 1.4% | 2.4%(-1.06)#91 | 3.5%(-2.15)#15,071 |
| 92. | 87740 | 1.3% | 2.4%(-1.10)#92 | 3.5%(-2.18)#15,287 |
| 93. | 88230 | 1.3% | 2.4%(-1.12)#93 | 3.5%(-2.20)#15,381 |
| 94. | 88011 | 1.3% | 2.4%(-1.16)#94 | 3.5%(-2.24)#15,626 |
| 95. | 88021 | 1.3% | 2.4%(-1.16)#95 | 3.5%(-2.25)#15,667 |
| 96. | 87537 | 1.2% | 2.4%(-1.20)#96 | 3.5%(-2.29)#15,905 |
| 97. | 88242 | 1.2% | 2.4%(-1.22)#97 | 3.5%(-2.31)#16,027 |
| 98. | 88260 | 1.2% | 2.4%(-1.25)#98 | 3.5%(-2.33)#16,149 |
| 99. | 88063 | 1.2% | 2.4%(-1.25)#99 | 3.5%(-2.33)#16,152 |
| 100. | 88101 | 1.1% | 2.4%(-1.33)#100 | 3.5%(-2.41)#16,656 |
Common Questions
What are the Top 10 Zip Codes with the Highest Percentage of Population Employed in Computer & Mathematics in New Mexico?
Top 10 Zip Codes with the Highest Percentage of Population Employed in Computer & Mathematics in New Mexico are:
What zip code has the Highest Percentage of Population Employed in Computer & Mathematics in New Mexico?
87064 has the Highest Percentage of Population Employed in Computer & Mathematics in New Mexico with 90.9%.
What is the Percentage of Population Employed in Computer & Mathematics in the State of New Mexico?
Percentage of Population Employed in Computer & Mathematics in New Mexico is 2.4%.
What is the Percentage of Population Employed in Computer & Mathematics in the United States?
Percentage of Population Employed in Computer & Mathematics in the United States is 3.5%.