Sea Isle City, NJ Map & Demographics
Sea Isle City Map
Sea Isle City Overview
$71,268
PER CAPITA INCOME
$115,481
AVG FAMILY INCOME
$90,703
AVG HOUSEHOLD INCOME
21.9%
WAGE / INCOME GAP [ % ]
78.1¢/ $1
WAGE / INCOME GAP [ $ ]
0.45
INEQUALITY / GINI INDEX
2,047
TOTAL POPULATION
1,015
MALE POPULATION
1,032
FEMALE POPULATION
98.35
MALES / 100 FEMALES
101.67
FEMALES / 100 MALES
65.1
MEDIAN AGE
2.2
AVG FAMILY SIZE
1.8
AVG HOUSEHOLD SIZE
729
LABOR FORCE [ PEOPLE ]
36.8%
PERCENT IN LABOR FORCE
5.8%
UNEMPLOYMENT RATE
Sea Isle City Zip Codes
Sea Isle City Area Codes
Income in Sea Isle City
Income Overview in Sea Isle City
Per Capita Income in Sea Isle City is $71,268, while median incomes of families and households are $115,481 and $90,703 respectively.
| Characteristic | Number | Measure |
| Per Capita Income | 2,047 | $71,268 |
| Median Family Income | 723 | $115,481 |
| Mean Family Income | 723 | $155,448 |
| Median Household Income | 1,127 | $90,703 |
| Mean Household Income | 1,127 | $130,021 |
| Income Deficit | 723 | $0 |
| Wage / Income Gap (%) | 2,047 | 21.93% |
| Wage / Income Gap ($) | 2,047 | 78.07¢ per $1 |
| Gini / Inequality Index | 2,047 | 0.45 |
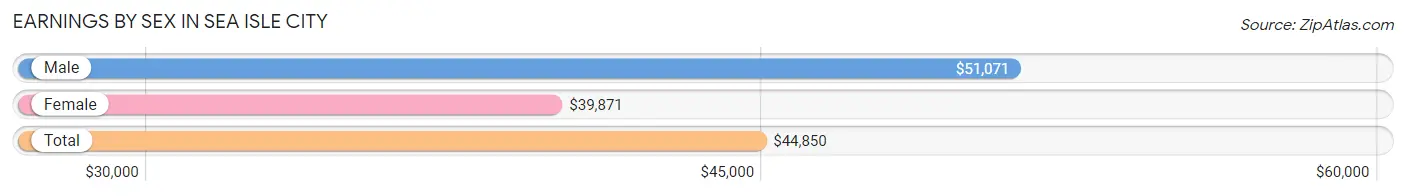
Earnings by Sex in Sea Isle City
Average Earnings in Sea Isle City are $44,850, $51,071 for men and $39,871 for women, a difference of 21.9%.
| Sex | Number | Average Earnings |
| Male | 488 (55.9%) | $51,071 |
| Female | 385 (44.1%) | $39,871 |
| Total | 873 (100.0%) | $44,850 |
Earnings by Sex by Income Bracket in Sea Isle City
The most common earnings brackets in Sea Isle City are $100,000+ for men (144 | 29.5%) and $100,000+ for women (70 | 18.2%).
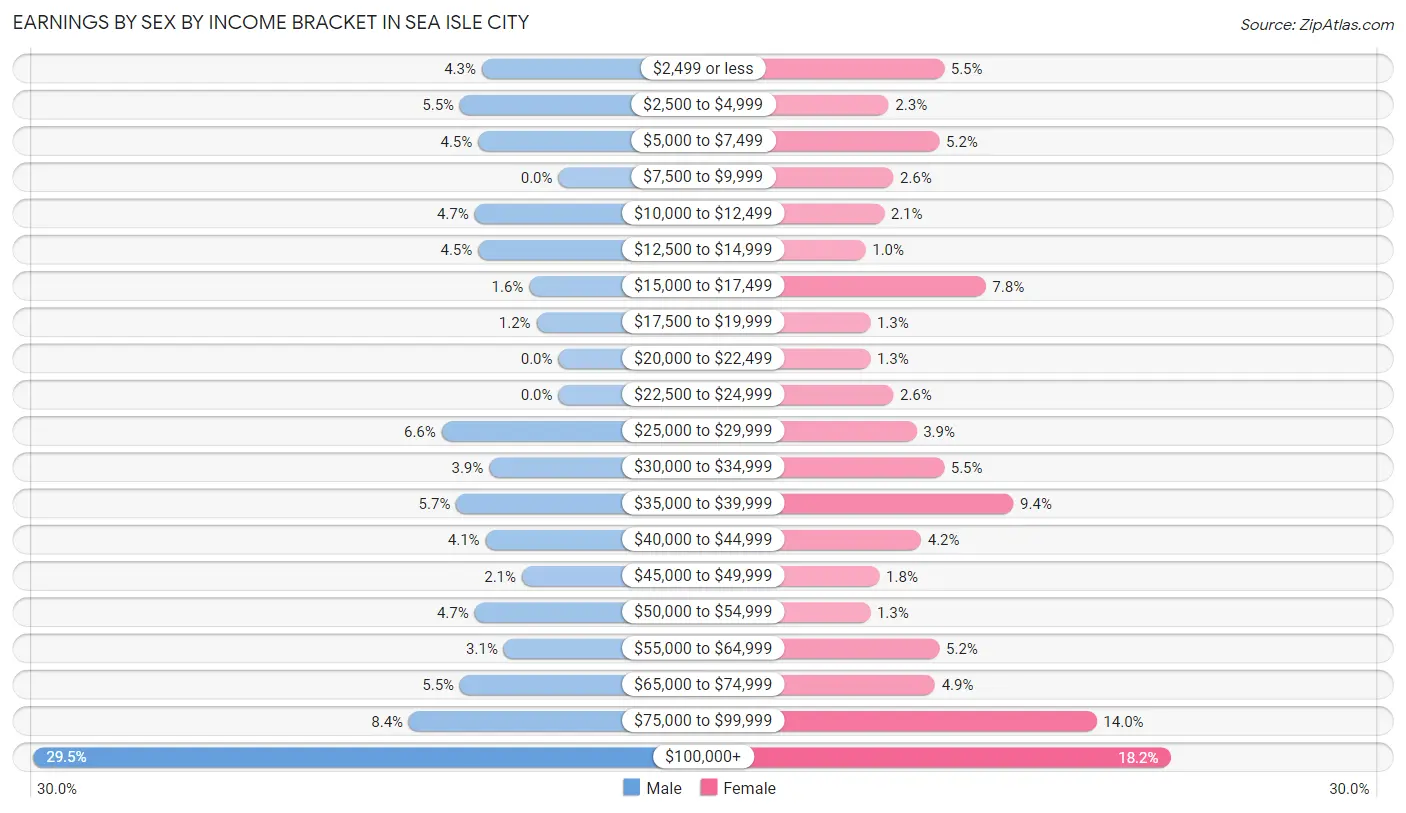
| Income | Male | Female |
| $2,499 or less | 21 (4.3%) | 21 (5.4%) |
| $2,500 to $4,999 | 27 (5.5%) | 9 (2.3%) |
| $5,000 to $7,499 | 22 (4.5%) | 20 (5.2%) |
| $7,500 to $9,999 | 0 (0.0%) | 10 (2.6%) |
| $10,000 to $12,499 | 23 (4.7%) | 8 (2.1%) |
| $12,500 to $14,999 | 22 (4.5%) | 4 (1.0%) |
| $15,000 to $17,499 | 8 (1.6%) | 30 (7.8%) |
| $17,500 to $19,999 | 6 (1.2%) | 5 (1.3%) |
| $20,000 to $22,499 | 0 (0.0%) | 5 (1.3%) |
| $22,500 to $24,999 | 0 (0.0%) | 10 (2.6%) |
| $25,000 to $29,999 | 32 (6.6%) | 15 (3.9%) |
| $30,000 to $34,999 | 19 (3.9%) | 21 (5.4%) |
| $35,000 to $39,999 | 28 (5.7%) | 36 (9.3%) |
| $40,000 to $44,999 | 20 (4.1%) | 16 (4.2%) |
| $45,000 to $49,999 | 10 (2.1%) | 7 (1.8%) |
| $50,000 to $54,999 | 23 (4.7%) | 5 (1.3%) |
| $55,000 to $64,999 | 15 (3.1%) | 20 (5.2%) |
| $65,000 to $74,999 | 27 (5.5%) | 19 (4.9%) |
| $75,000 to $99,999 | 41 (8.4%) | 54 (14.0%) |
| $100,000+ | 144 (29.5%) | 70 (18.2%) |
| Total | 488 (100.0%) | 385 (100.0%) |
Earnings by Sex by Educational Attainment in Sea Isle City
Average earnings in Sea Isle City are $70,521 for men and $41,094 for women, a difference of 41.7%. Men with an educational attainment of bachelor's degree enjoy the highest average annual earnings of $94,167, while those with high school diploma education earn the least with $55,714. Women with an educational attainment of graduate degree earn the most with the average annual earnings of $72,500, while those with less than high school education have the smallest earnings of $16,417.
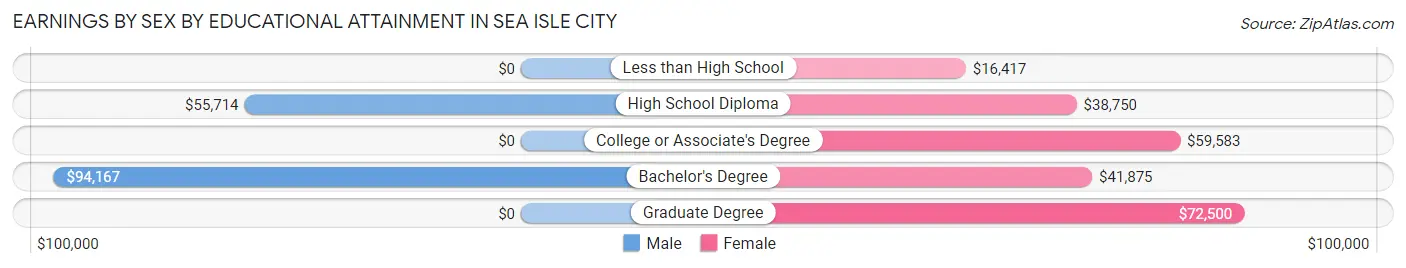
| Educational Attainment | Male Income | Female Income |
| Less than High School | - | - |
| High School Diploma | $55,714 | $38,750 |
| College or Associate's Degree | - | - |
| Bachelor's Degree | $94,167 | $41,875 |
| Graduate Degree | - | - |
| Total | $70,521 | $41,094 |
Family Income in Sea Isle City
Family Income Brackets in Sea Isle City
According to the Sea Isle City family income data, there are 168 families falling into the $200,000+ income range, which is the most common income bracket and makes up 23.2% of all families. Conversely, the $10,000 to $14,999 income bracket is the least frequent group with only 7 families (1.0%) belonging to this category.
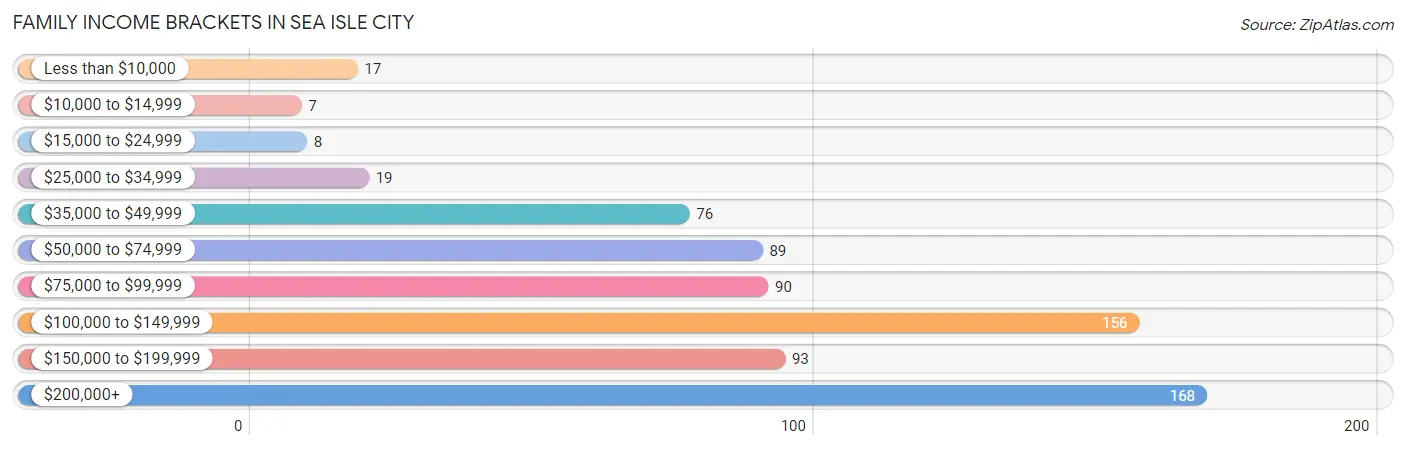
| Income Bracket | # Families | % Families |
| Less than $10,000 | 17 | 2.4% |
| $10,000 to $14,999 | 7 | 1.0% |
| $15,000 to $24,999 | 8 | 1.1% |
| $25,000 to $34,999 | 19 | 2.6% |
| $35,000 to $49,999 | 76 | 10.5% |
| $50,000 to $74,999 | 89 | 12.3% |
| $75,000 to $99,999 | 90 | 12.4% |
| $100,000 to $149,999 | 156 | 21.6% |
| $150,000 to $199,999 | 93 | 12.9% |
| $200,000+ | 168 | 23.2% |
Family Income by Famaliy Size in Sea Isle City
2-person families (628 | 86.9%) account for the highest median family income in Sea Isle City with $116,154 per family, while 2-person families (628 | 86.9%) have the highest median income of $58,077 per family member.
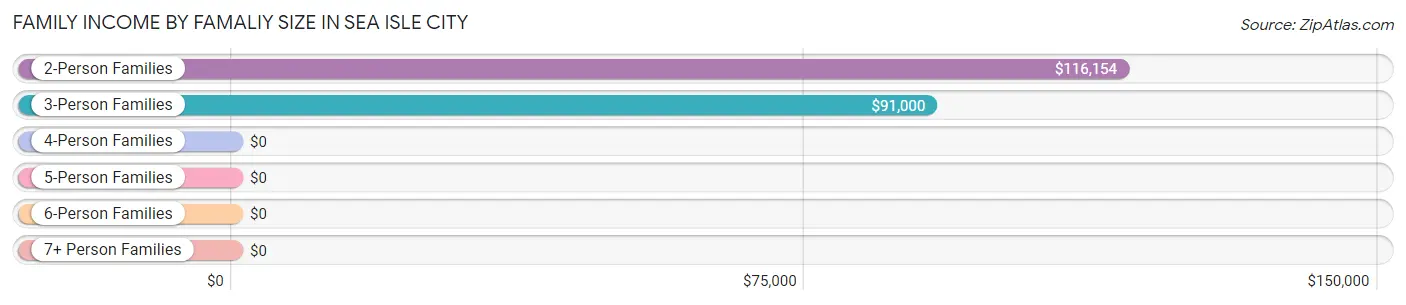
| Income Bracket | # Families | Median Income |
| 2-Person Families | 628 (86.9%) | $116,154 |
| 3-Person Families | 62 (8.6%) | $91,000 |
| 4-Person Families | 33 (4.6%) | $0 |
| 5-Person Families | 0 (0.0%) | $0 |
| 6-Person Families | 0 (0.0%) | $0 |
| 7+ Person Families | 0 (0.0%) | $0 |
| Total | 723 (100.0%) | $115,481 |
Family Income by Number of Earners in Sea Isle City
The median family income in Sea Isle City is $115,481, with families comprising 3+ earners (24) having the highest median family income of $250,001, while families with no earners (315) have the lowest median family income of $82,321, accounting for 3.3% and 43.6% of families, respectively.
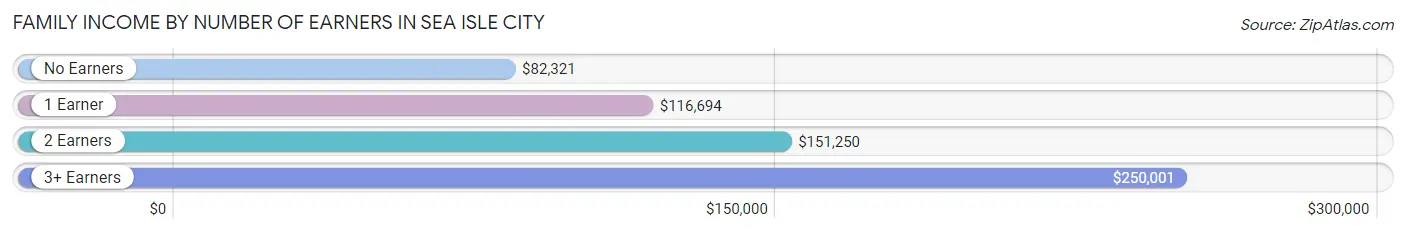
| Number of Earners | # Families | Median Income |
| No Earners | 315 (43.6%) | $82,321 |
| 1 Earner | 228 (31.5%) | $116,694 |
| 2 Earners | 156 (21.6%) | $151,250 |
| 3+ Earners | 24 (3.3%) | $250,001 |
| Total | 723 (100.0%) | $115,481 |
Household Income in Sea Isle City
Household Income Brackets in Sea Isle City
With 207 households falling in the category, the $200,000+ income range is the most frequent in Sea Isle City, accounting for 18.4% of all households. In contrast, only 12 households (1.1%) fall into the $10,000 to $14,999 income bracket, making it the least populous group.
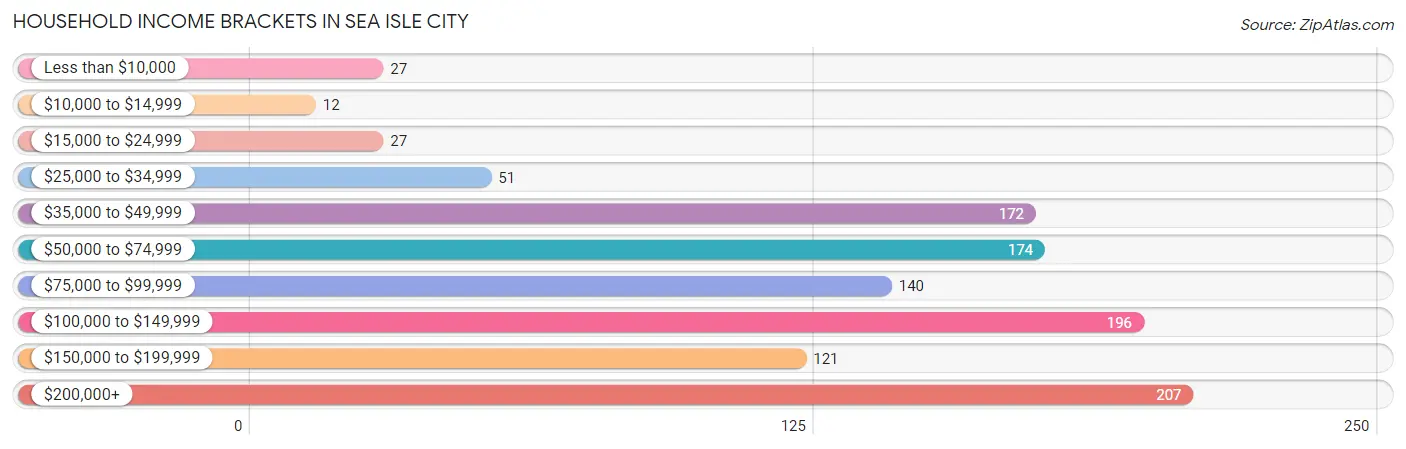
| Income Bracket | # Households | % Households |
| Less than $10,000 | 27 | 2.4% |
| $10,000 to $14,999 | 12 | 1.1% |
| $15,000 to $24,999 | 27 | 2.4% |
| $25,000 to $34,999 | 51 | 4.5% |
| $35,000 to $49,999 | 172 | 15.3% |
| $50,000 to $74,999 | 174 | 15.4% |
| $75,000 to $99,999 | 140 | 12.4% |
| $100,000 to $149,999 | 196 | 17.4% |
| $150,000 to $199,999 | 121 | 10.7% |
| $200,000+ | 207 | 18.4% |
Household Income by Householder Age in Sea Isle City
The median household income in Sea Isle City is $90,703, with the highest median household income of $116,341 found in the 45 to 64 years age bracket for the primary householder. A total of 410 households (36.4%) fall into this category. Meanwhile, the 15 to 24 years age bracket for the primary householder has the lowest median household income of $0, with 16 households (1.4%) in this group.
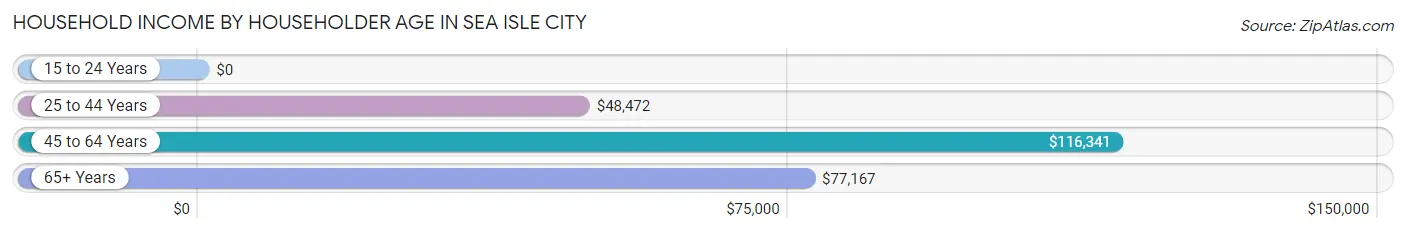
| Income Bracket | # Households | Median Income |
| 15 to 24 Years | 16 (1.4%) | $0 |
| 25 to 44 Years | 63 (5.6%) | $48,472 |
| 45 to 64 Years | 410 (36.4%) | $116,341 |
| 65+ Years | 638 (56.6%) | $77,167 |
| Total | 1,127 (100.0%) | $90,703 |
Poverty in Sea Isle City
Income Below Poverty by Sex and Age in Sea Isle City
With 6.0% poverty level for males and 5.0% for females among the residents of Sea Isle City, 12 to 14 year old males and 35 to 44 year old females are the most vulnerable to poverty, with 4 males (100.0%) and 6 females (13.6%) in their respective age groups living below the poverty level.
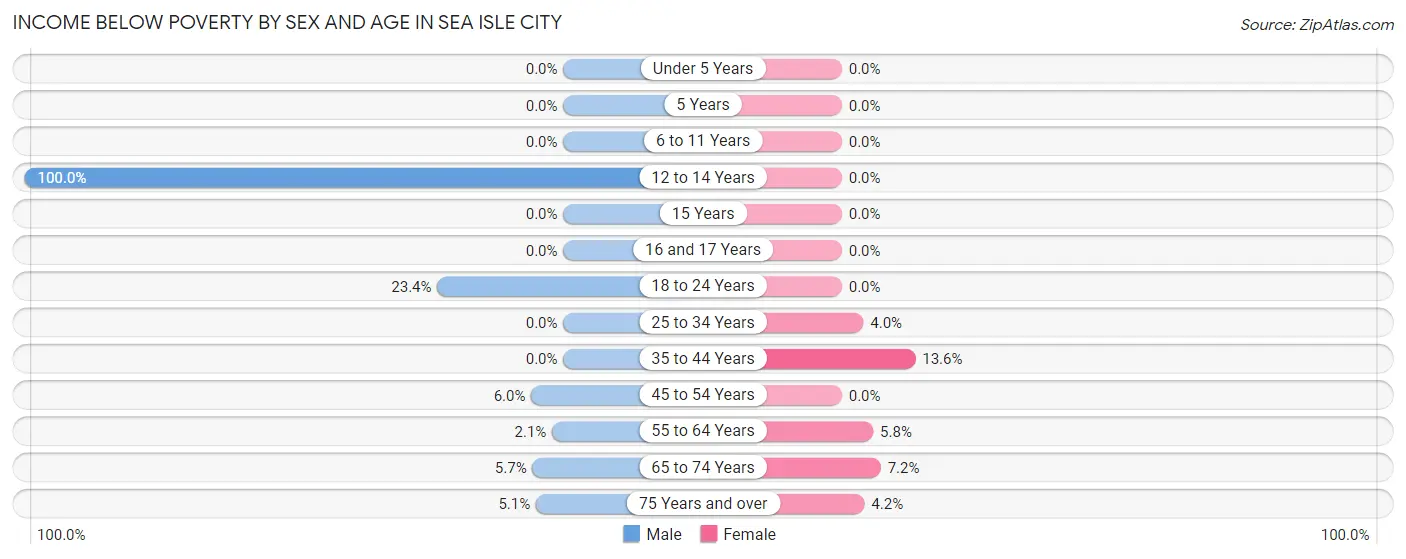
| Age Bracket | Male | Female |
| Under 5 Years | 0 (0.0%) | 0 (0.0%) |
| 5 Years | 0 (0.0%) | 0 (0.0%) |
| 6 to 11 Years | 0 (0.0%) | 0 (0.0%) |
| 12 to 14 Years | 4 (100.0%) | 0 (0.0%) |
| 15 Years | 0 (0.0%) | 0 (0.0%) |
| 16 and 17 Years | 0 (0.0%) | 0 (0.0%) |
| 18 to 24 Years | 18 (23.4%) | 0 (0.0%) |
| 25 to 34 Years | 0 (0.0%) | 1 (4.0%) |
| 35 to 44 Years | 0 (0.0%) | 6 (13.6%) |
| 45 to 54 Years | 5 (5.9%) | 0 (0.0%) |
| 55 to 64 Years | 5 (2.1%) | 17 (5.8%) |
| 65 to 74 Years | 18 (5.7%) | 17 (7.2%) |
| 75 Years and over | 11 (5.1%) | 11 (4.2%) |
| Total | 61 (6.0%) | 52 (5.0%) |
Income Above Poverty by Sex and Age in Sea Isle City
According to the poverty statistics in Sea Isle City, males aged 6 to 11 years and females aged under 5 years are the age groups that are most secure financially, with 100.0% of males and 100.0% of females in these age groups living above the poverty line.
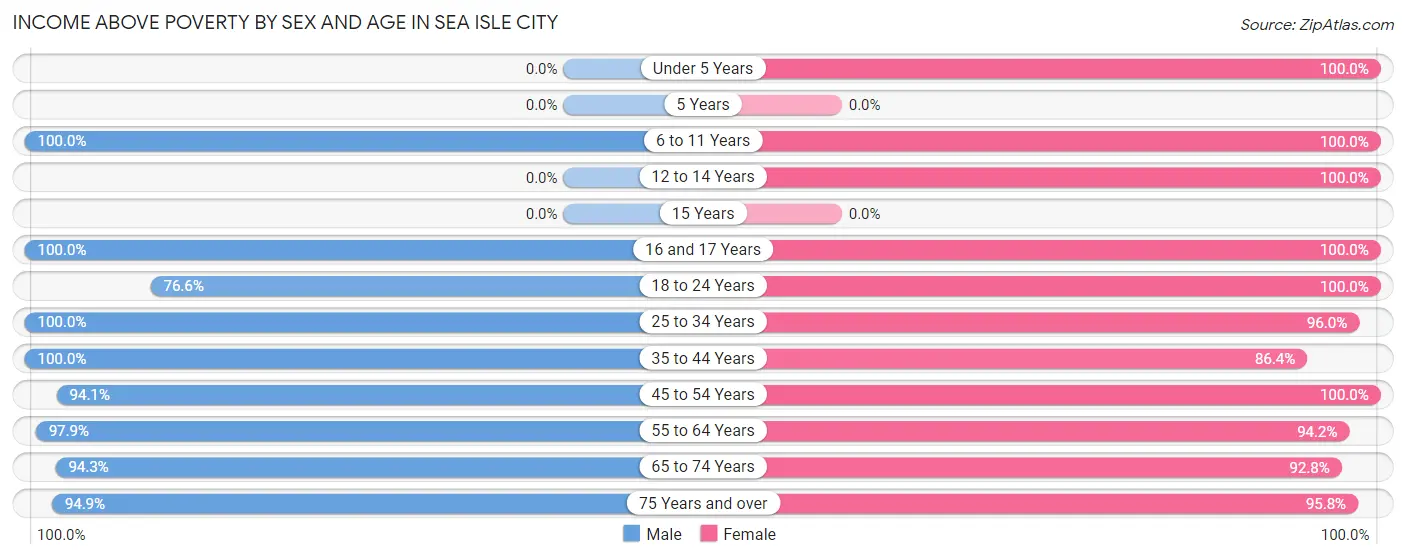
| Age Bracket | Male | Female |
| Under 5 Years | 0 (0.0%) | 6 (100.0%) |
| 5 Years | 0 (0.0%) | 0 (0.0%) |
| 6 to 11 Years | 11 (100.0%) | 12 (100.0%) |
| 12 to 14 Years | 0 (0.0%) | 32 (100.0%) |
| 15 Years | 0 (0.0%) | 0 (0.0%) |
| 16 and 17 Years | 16 (100.0%) | 4 (100.0%) |
| 18 to 24 Years | 59 (76.6%) | 6 (100.0%) |
| 25 to 34 Years | 5 (100.0%) | 24 (96.0%) |
| 35 to 44 Years | 45 (100.0%) | 38 (86.4%) |
| 45 to 54 Years | 79 (94.1%) | 114 (100.0%) |
| 55 to 64 Years | 237 (97.9%) | 275 (94.2%) |
| 65 to 74 Years | 296 (94.3%) | 218 (92.8%) |
| 75 Years and over | 206 (94.9%) | 251 (95.8%) |
| Total | 954 (94.0%) | 980 (95.0%) |
Income Below Poverty Among Married-Couple Families in Sea Isle City
The poverty statistics for married-couple families in Sea Isle City show that 3.8% or 26 of the total 683 families live below the poverty line. Families with no children have the highest poverty rate of 4.1%, comprising of 26 families. On the other hand, families with 1 or 2 children have the lowest poverty rate of 0.0%, which includes 0 families.
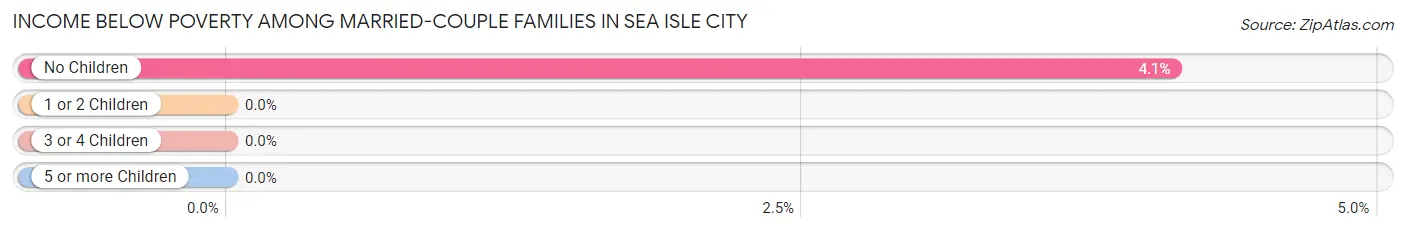
| Children | Above Poverty | Below Poverty |
| No Children | 607 (95.9%) | 26 (4.1%) |
| 1 or 2 Children | 50 (100.0%) | 0 (0.0%) |
| 3 or 4 Children | 0 (0.0%) | 0 (0.0%) |
| 5 or more Children | 0 (0.0%) | 0 (0.0%) |
| Total | 657 (96.2%) | 26 (3.8%) |
Income Below Poverty Among Single-Parent Households in Sea Isle City
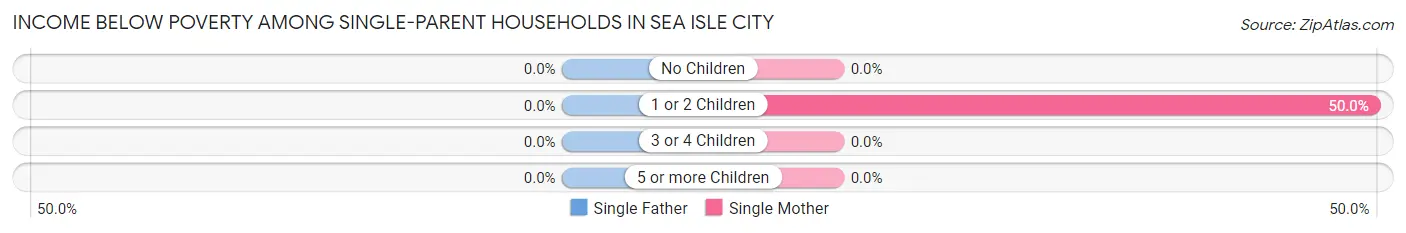
| Children | Single Father | Single Mother |
| No Children | 0 (0.0%) | 0 (0.0%) |
| 1 or 2 Children | 0 (0.0%) | 6 (50.0%) |
| 3 or 4 Children | 0 (0.0%) | 0 (0.0%) |
| 5 or more Children | 0 (0.0%) | 0 (0.0%) |
| Total | 0 (0.0%) | 6 (20.7%) |
Income Below Poverty Among Married-Couple vs Single-Parent Households in Sea Isle City
The poverty data for Sea Isle City shows that 26 of the married-couple family households (3.8%) and 6 of the single-parent households (15.0%) are living below the poverty level. Within the married-couple family households, those with no children have the highest poverty rate, with 26 households (4.1%) falling below the poverty line. Among the single-parent households, those with 1 or 2 children have the highest poverty rate, with 6 household (50.0%) living below poverty.
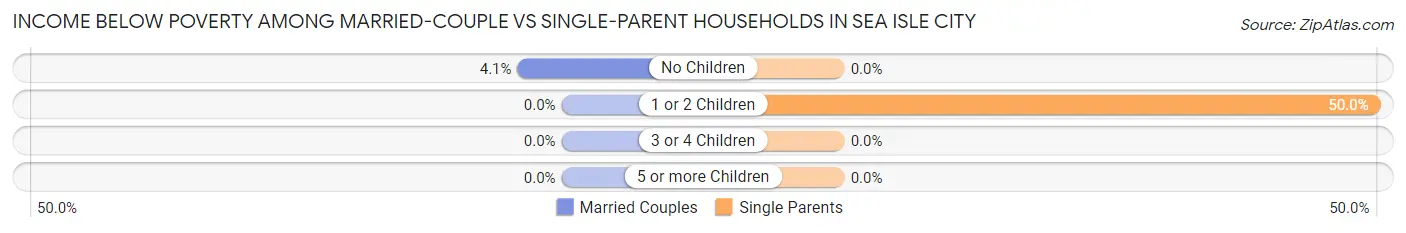
| Children | Married-Couple Families | Single-Parent Households |
| No Children | 26 (4.1%) | 0 (0.0%) |
| 1 or 2 Children | 0 (0.0%) | 6 (50.0%) |
| 3 or 4 Children | 0 (0.0%) | 0 (0.0%) |
| 5 or more Children | 0 (0.0%) | 0 (0.0%) |
| Total | 26 (3.8%) | 6 (15.0%) |
Race in Sea Isle City
The most populous races in Sea Isle City are White / Caucasian (1,981 | 96.8%), Two or more Races (60 | 2.9%), and Hispanic or Latino (50 | 2.4%).
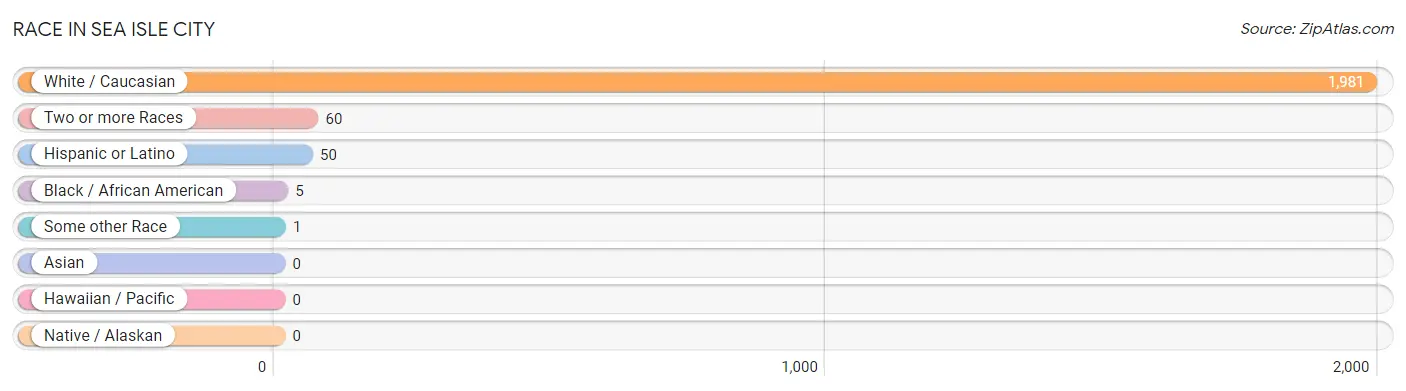
| Race | # Population | % Population |
| Asian | 0 | 0.0% |
| Black / African American | 5 | 0.2% |
| Hawaiian / Pacific | 0 | 0.0% |
| Hispanic or Latino | 50 | 2.4% |
| Native / Alaskan | 0 | 0.0% |
| White / Caucasian | 1,981 | 96.8% |
| Two or more Races | 60 | 2.9% |
| Some other Race | 1 | 0.1% |
| Total | 2,047 | 100.0% |
Ancestry in Sea Isle City
The most populous ancestries reported in Sea Isle City are Irish (965 | 47.1%), Italian (451 | 22.0%), German (402 | 19.6%), Polish (223 | 10.9%), and English (187 | 9.1%), together accounting for 108.8% of all Sea Isle City residents.
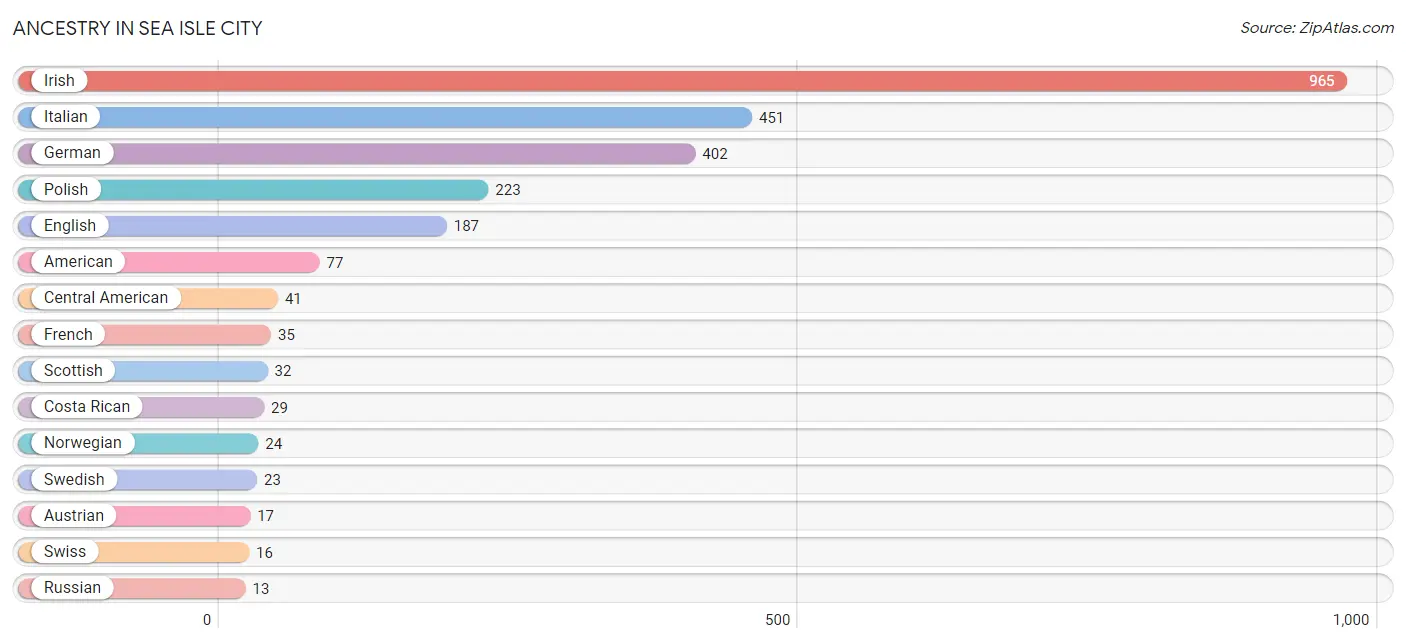
| Ancestry | # Population | % Population |
| Albanian | 6 | 0.3% |
| American | 77 | 3.8% |
| Arab | 1 | 0.1% |
| Austrian | 17 | 0.8% |
| Bhutanese | 9 | 0.4% |
| Brazilian | 10 | 0.5% |
| British | 8 | 0.4% |
| Bulgarian | 5 | 0.2% |
| Canadian | 4 | 0.2% |
| Central American | 41 | 2.0% |
| Costa Rican | 29 | 1.4% |
| Croatian | 6 | 0.3% |
| Czech | 5 | 0.2% |
| Danish | 4 | 0.2% |
| Dutch | 11 | 0.5% |
| Eastern European | 6 | 0.3% |
| English | 187 | 9.1% |
| European | 5 | 0.2% |
| Finnish | 7 | 0.3% |
| French | 35 | 1.7% |
| French Canadian | 6 | 0.3% |
| German | 402 | 19.6% |
| Greek | 9 | 0.4% |
| Honduran | 12 | 0.6% |
| Hungarian | 11 | 0.5% |
| Iranian | 7 | 0.3% |
| Irish | 965 | 47.1% |
| Italian | 451 | 22.0% |
| Mexican | 9 | 0.4% |
| Norwegian | 24 | 1.2% |
| Polish | 223 | 10.9% |
| Portuguese | 5 | 0.2% |
| Russian | 13 | 0.6% |
| Scotch-Irish | 7 | 0.3% |
| Scottish | 32 | 1.6% |
| Slavic | 6 | 0.3% |
| Slovak | 4 | 0.2% |
| Swedish | 23 | 1.1% |
| Swiss | 16 | 0.8% |
| Ukrainian | 3 | 0.2% |
| Welsh | 4 | 0.2% | View All 41 Rows |
Immigrants in Sea Isle City
The most numerous immigrant groups reported in Sea Isle City came from Latin America (36 | 1.8%), Central America (30 | 1.5%), Costa Rica (29 | 1.4%), Europe (18 | 0.9%), and Southern Europe (13 | 0.6%), together accounting for 6.2% of all Sea Isle City residents.
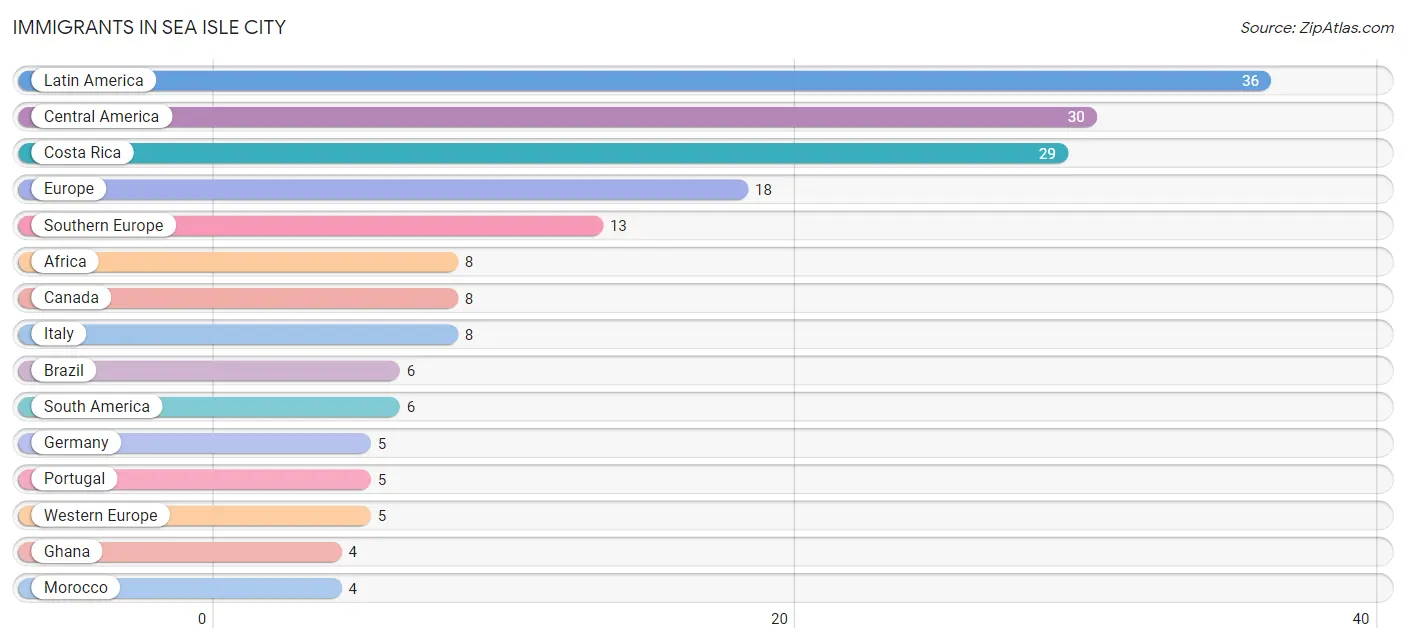
| Immigration Origin | # Population | % Population |
| Africa | 8 | 0.4% |
| Brazil | 6 | 0.3% |
| Canada | 8 | 0.4% |
| Central America | 30 | 1.5% |
| Costa Rica | 29 | 1.4% |
| Europe | 18 | 0.9% |
| Germany | 5 | 0.2% |
| Ghana | 4 | 0.2% |
| Italy | 8 | 0.4% |
| Latin America | 36 | 1.8% |
| Mexico | 1 | 0.1% |
| Morocco | 4 | 0.2% |
| Northern Africa | 4 | 0.2% |
| Portugal | 5 | 0.2% |
| South America | 6 | 0.3% |
| Southern Europe | 13 | 0.6% |
| Western Africa | 4 | 0.2% |
| Western Europe | 5 | 0.2% | View All 18 Rows |
Sex and Age in Sea Isle City
Sex and Age in Sea Isle City
The most populous age groups in Sea Isle City are 65 to 69 Years (161 | 15.9%) for men and 60 to 64 Years (156 | 15.1%) for women.
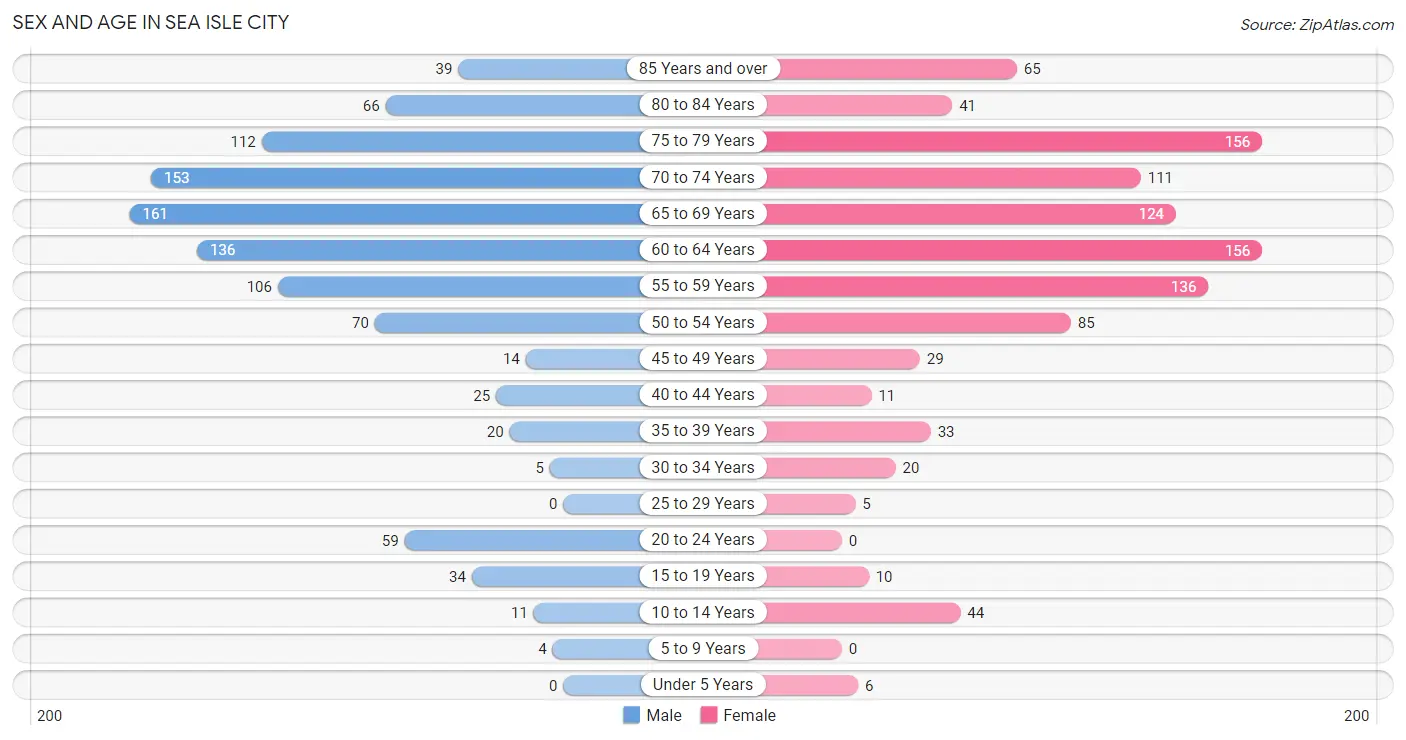
| Age Bracket | Male | Female |
| Under 5 Years | 0 (0.0%) | 6 (0.6%) |
| 5 to 9 Years | 4 (0.4%) | 0 (0.0%) |
| 10 to 14 Years | 11 (1.1%) | 44 (4.3%) |
| 15 to 19 Years | 34 (3.4%) | 10 (1.0%) |
| 20 to 24 Years | 59 (5.8%) | 0 (0.0%) |
| 25 to 29 Years | 0 (0.0%) | 5 (0.5%) |
| 30 to 34 Years | 5 (0.5%) | 20 (1.9%) |
| 35 to 39 Years | 20 (2.0%) | 33 (3.2%) |
| 40 to 44 Years | 25 (2.5%) | 11 (1.1%) |
| 45 to 49 Years | 14 (1.4%) | 29 (2.8%) |
| 50 to 54 Years | 70 (6.9%) | 85 (8.2%) |
| 55 to 59 Years | 106 (10.4%) | 136 (13.2%) |
| 60 to 64 Years | 136 (13.4%) | 156 (15.1%) |
| 65 to 69 Years | 161 (15.9%) | 124 (12.0%) |
| 70 to 74 Years | 153 (15.1%) | 111 (10.8%) |
| 75 to 79 Years | 112 (11.0%) | 156 (15.1%) |
| 80 to 84 Years | 66 (6.5%) | 41 (4.0%) |
| 85 Years and over | 39 (3.8%) | 65 (6.3%) |
| Total | 1,015 (100.0%) | 1,032 (100.0%) |
Families and Households in Sea Isle City
Median Family Size in Sea Isle City
The median family size in Sea Isle City is 2.19 persons per family, with single female/mother families (29 | 4.0%) accounting for the largest median family size of 2.21 persons per family. On the other hand, single male/father families (11 | 1.5%) represent the smallest median family size with 1.64 persons per family.
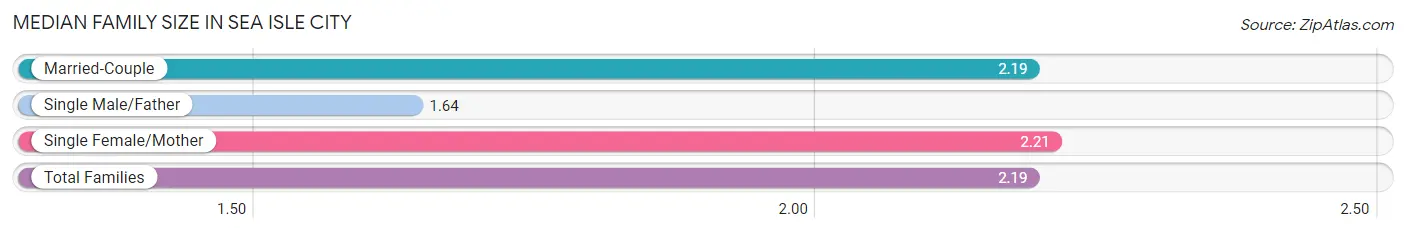
| Family Type | # Families | Family Size |
| Married-Couple | 683 (94.5%) | 2.19 |
| Single Male/Father | 11 (1.5%) | 1.64 |
| Single Female/Mother | 29 (4.0%) | 2.21 |
| Total Families | 723 (100.0%) | 2.19 |
Median Household Size in Sea Isle City
The median household size in Sea Isle City is 1.81 persons per household, with single female/mother households (29 | 2.6%) accounting for the largest median household size of 2.21 persons per household. non-family households (404 | 35.8%) represent the smallest median household size with 1.13 persons per household.
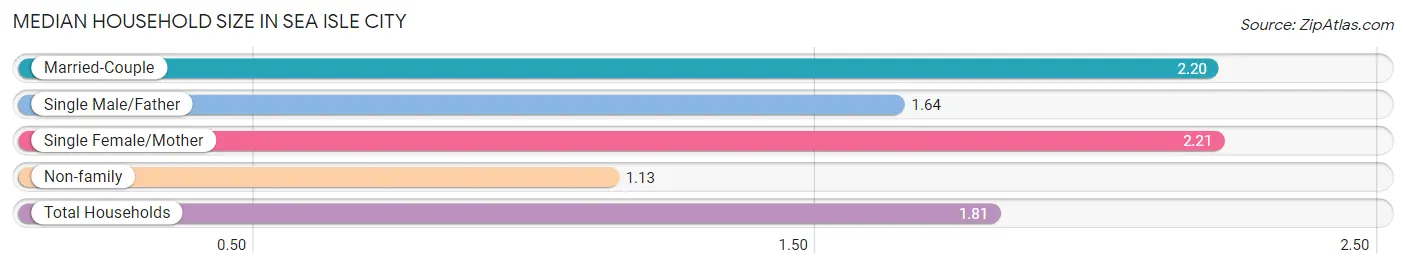
| Household Type | # Households | Household Size |
| Married-Couple | 683 (60.6%) | 2.20 |
| Single Male/Father | 11 (1.0%) | 1.64 |
| Single Female/Mother | 29 (2.6%) | 2.21 |
| Non-family | 404 (35.8%) | 1.13 |
| Total Households | 1,127 (100.0%) | 1.81 |
Household Size by Marriage Status in Sea Isle City
Out of a total of 1,127 households in Sea Isle City, 723 (64.1%) are family households, while 404 (35.8%) are nonfamily households. The most numerous type of family households are 2-person households, comprising 624, and the most common type of nonfamily households are 1-person households, comprising 362.
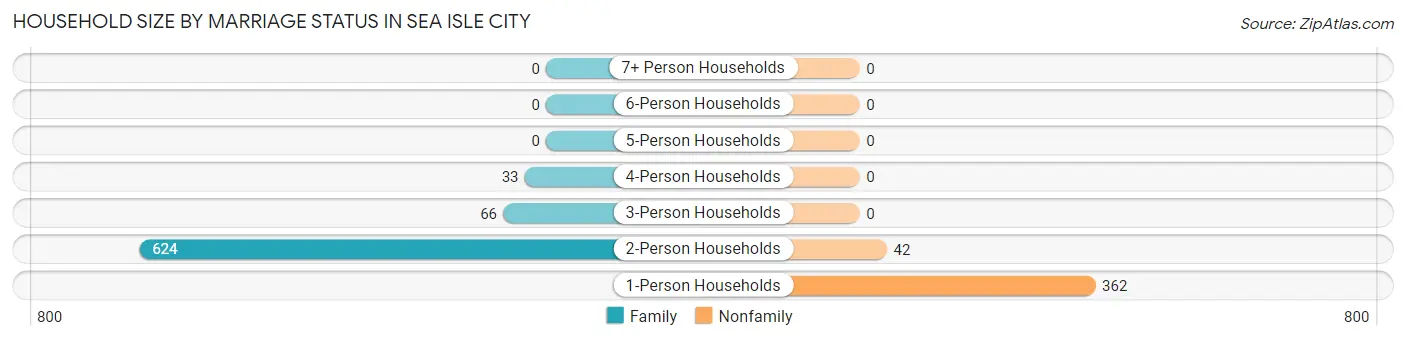
| Household Size | Family Households | Nonfamily Households |
| 1-Person Households | - | 362 (32.1%) |
| 2-Person Households | 624 (55.4%) | 42 (3.7%) |
| 3-Person Households | 66 (5.9%) | 0 (0.0%) |
| 4-Person Households | 33 (2.9%) | 0 (0.0%) |
| 5-Person Households | 0 (0.0%) | 0 (0.0%) |
| 6-Person Households | 0 (0.0%) | 0 (0.0%) |
| 7+ Person Households | 0 (0.0%) | 0 (0.0%) |
| Total | 723 (64.1%) | 404 (35.8%) |
Female Fertility in Sea Isle City
Fertility by Age in Sea Isle City
| Age Bracket | Women with Births | Births / 1,000 Women |
| 15 to 19 years | 0 (0.0%) | 0.0 |
| 20 to 34 years | 0 (0.0%) | 0.0 |
| 35 to 50 years | 0 (0.0%) | 0.0 |
| Total | 0 (0.0%) | 0.0 |
Fertility by Age by Marriage Status in Sea Isle City
| Age Bracket | Married | Unmarried |
| 15 to 19 years | 0 (0.0%) | 0 (0.0%) |
| 20 to 34 years | 0 (0.0%) | 0 (0.0%) |
| 35 to 50 years | 0 (0.0%) | 0 (0.0%) |
| Total | 0 (0.0%) | 0 (0.0%) |
Fertility by Education in Sea Isle City
| Educational Attainment | Women with Births | Births / 1,000 Women |
| Less than High School | 0 (0.0%) | 0.0 |
| High School Diploma | 0 (0.0%) | 0.0 |
| College or Associate's Degree | 0 (0.0%) | 0.0 |
| Bachelor's Degree | 0 (0.0%) | 0.0 |
| Graduate Degree | 0 (0.0%) | 0.0 |
| Total | 0 (0.0%) | 0.0 |
Fertility by Education by Marriage Status in Sea Isle City
| Educational Attainment | Married | Unmarried |
| Less than High School | 0 (0.0%) | 0 (0.0%) |
| High School Diploma | 0 (0.0%) | 0 (0.0%) |
| College or Associate's Degree | 0 (0.0%) | 0 (0.0%) |
| Bachelor's Degree | 0 (0.0%) | 0 (0.0%) |
| Graduate Degree | 0 (0.0%) | 0 (0.0%) |
| Total | 0 (0.0%) | 0 (0.0%) |
Employment Characteristics in Sea Isle City
Employment by Class of Employer in Sea Isle City
Among the 683 employed individuals in Sea Isle City, private company employees (435 | 63.7%), self-employed (not incorporated) (74 | 10.8%), and not-for-profit organizations (69 | 10.1%) make up the most common classes of employment.
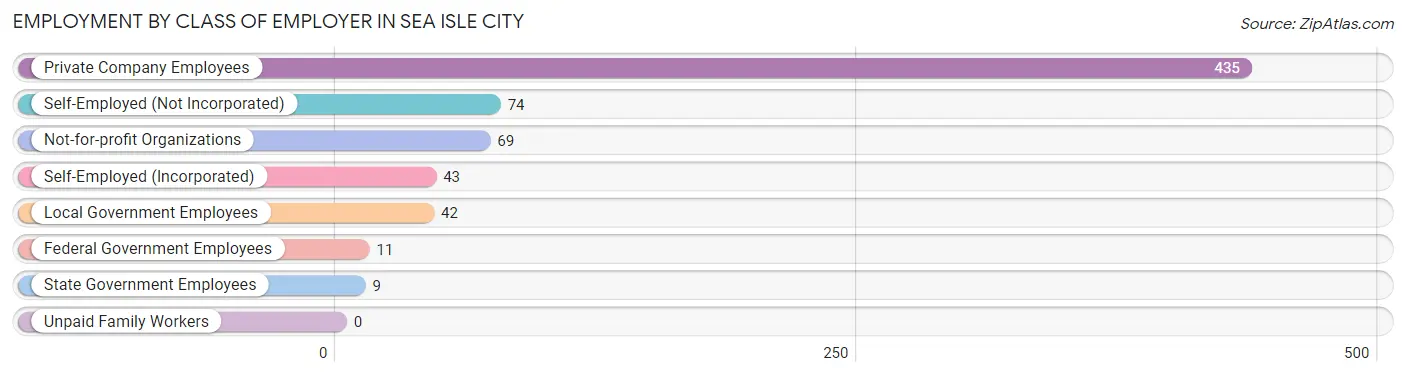
| Employer Class | # Employees | % Employees |
| Private Company Employees | 435 | 63.7% |
| Self-Employed (Incorporated) | 43 | 6.3% |
| Self-Employed (Not Incorporated) | 74 | 10.8% |
| Not-for-profit Organizations | 69 | 10.1% |
| Local Government Employees | 42 | 6.1% |
| State Government Employees | 9 | 1.3% |
| Federal Government Employees | 11 | 1.6% |
| Unpaid Family Workers | 0 | 0.0% |
| Total | 683 | 100.0% |
Employment Status by Age in Sea Isle City
According to the labor force statistics for Sea Isle City, out of the total population over 16 years of age (1,982), 36.8% or 729 individuals are in the labor force, with 5.8% or 42 of them unemployed. The age group with the highest labor force participation rate is 25 to 29 years, with 100.0% or 5 individuals in the labor force. Within the labor force, the 75 years and over age range has the highest percentage of unemployed individuals, with 11.4% or 4 of them being unemployed.
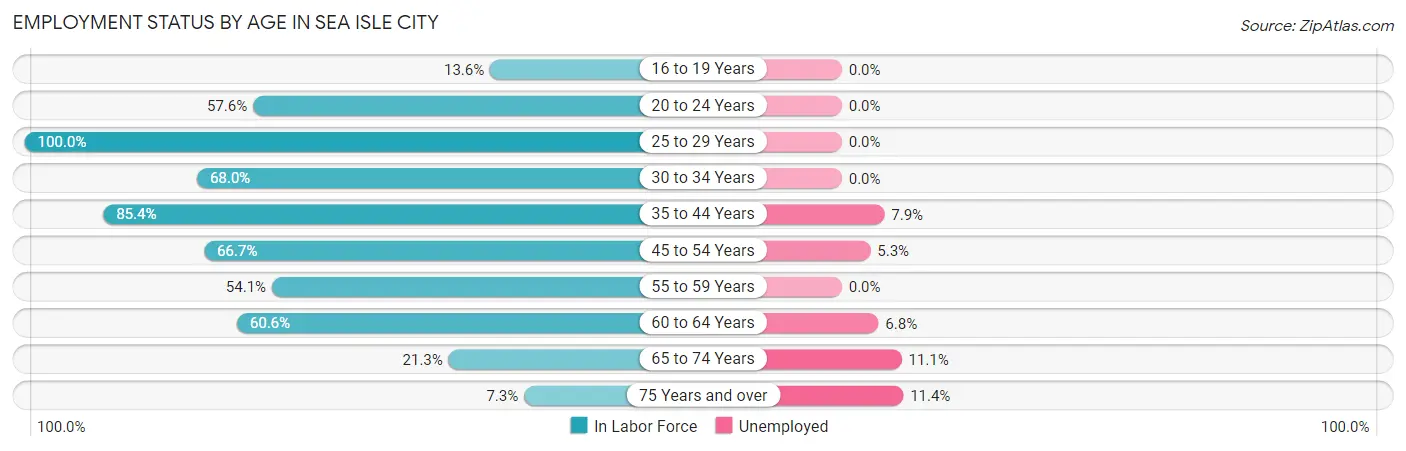
| Age Bracket | In Labor Force | Unemployed |
| 16 to 19 Years | 6 (13.6%) | 0 (0.0%) |
| 20 to 24 Years | 34 (57.6%) | 0 (0.0%) |
| 25 to 29 Years | 5 (100.0%) | 0 (0.0%) |
| 30 to 34 Years | 17 (68.0%) | 0 (0.0%) |
| 35 to 44 Years | 76 (85.4%) | 6 (7.9%) |
| 45 to 54 Years | 132 (66.7%) | 7 (5.3%) |
| 55 to 59 Years | 131 (54.1%) | 0 (0.0%) |
| 60 to 64 Years | 177 (60.6%) | 12 (6.8%) |
| 65 to 74 Years | 117 (21.3%) | 13 (11.1%) |
| 75 Years and over | 35 (7.3%) | 4 (11.4%) |
| Total | 729 (36.8%) | 42 (5.8%) |
Employment Status by Educational Attainment in Sea Isle City
According to labor force statistics for Sea Isle City, 63.2% of individuals (538) out of the total population between 25 and 64 years of age (851) are in the labor force, with 4.6% or 25 of them being unemployed. The group with the highest labor force participation rate are those with the educational attainment of less than high school, with 100.0% or 34 individuals in the labor force. Within the labor force, individuals with high school diploma education have the highest percentage of unemployment, with 11.4% or 8 of them being unemployed.
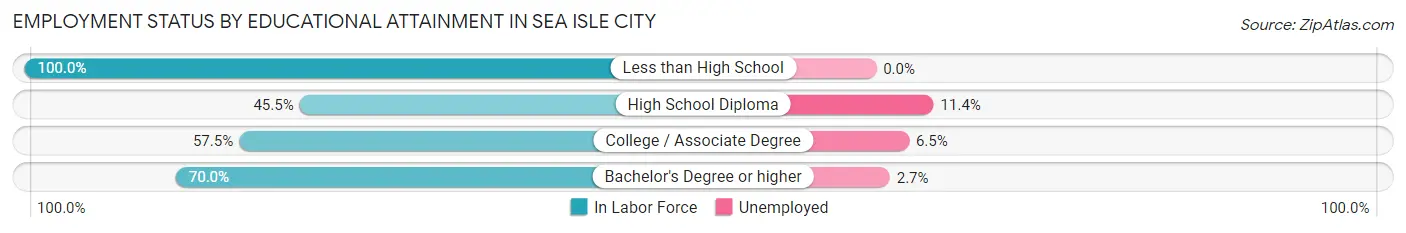
| Educational Attainment | In Labor Force | Unemployed |
| Less than High School | 34 (100.0%) | 0 (0.0%) |
| High School Diploma | 70 (45.5%) | 18 (11.4%) |
| College / Associate Degree | 138 (57.5%) | 16 (6.5%) |
| Bachelor's Degree or higher | 296 (70.0%) | 11 (2.7%) |
| Total | 538 (63.2%) | 39 (4.6%) |
Employment Occupations by Sex in Sea Isle City
Management, Business, Science and Arts Occupations
The most common Management, Business, Science and Arts occupations in Sea Isle City are Management (109 | 15.8%), Community & Social Service (72 | 10.5%), Education Instruction & Library (54 | 7.9%), Business & Financial (50 | 7.3%), and Health Diagnosing & Treating (48 | 7.0%).
Management, Business, Science and Arts Occupations by Sex
Within the Management, Business, Science and Arts occupations in Sea Isle City, the most male-oriented occupations are Architecture & Engineering (100.0%), Arts, Media & Entertainment (100.0%), and Management (78.9%), while the most female-oriented occupations are Legal Services & Support (100.0%), Health Technologists (90.9%), and Health Diagnosing & Treating (83.3%).
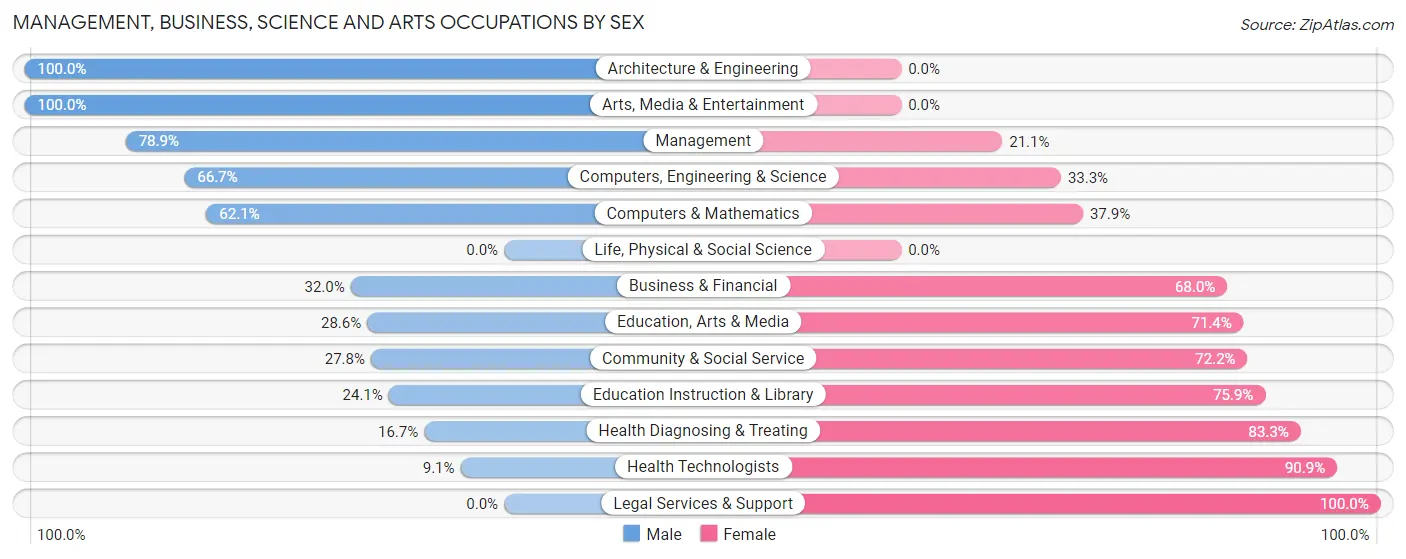
| Occupation | Male | Female |
| Management | 86 (78.9%) | 23 (21.1%) |
| Business & Financial | 16 (32.0%) | 34 (68.0%) |
| Computers, Engineering & Science | 22 (66.7%) | 11 (33.3%) |
| Computers & Mathematics | 18 (62.1%) | 11 (37.9%) |
| Architecture & Engineering | 4 (100.0%) | 0 (0.0%) |
| Life, Physical & Social Science | 0 (0.0%) | 0 (0.0%) |
| Community & Social Service | 20 (27.8%) | 52 (72.2%) |
| Education, Arts & Media | 2 (28.6%) | 5 (71.4%) |
| Legal Services & Support | 0 (0.0%) | 6 (100.0%) |
| Education Instruction & Library | 13 (24.1%) | 41 (75.9%) |
| Arts, Media & Entertainment | 5 (100.0%) | 0 (0.0%) |
| Health Diagnosing & Treating | 8 (16.7%) | 40 (83.3%) |
| Health Technologists | 4 (9.1%) | 40 (90.9%) |
| Total (Category) | 152 (48.7%) | 160 (51.3%) |
| Total (Overall) | 386 (56.1%) | 302 (43.9%) |
Services Occupations
The most common Services occupations in Sea Isle City are Cleaning & Maintenance (29 | 4.2%), Food Preparation & Serving (19 | 2.8%), Personal Care & Service (15 | 2.2%), Healthcare Support (14 | 2.0%), and Security & Protection (4 | 0.6%).
Services Occupations by Sex
Within the Services occupations in Sea Isle City, the most male-oriented occupations are Security & Protection (100.0%), Firefighting & Prevention (100.0%), and Food Preparation & Serving (100.0%), while the most female-oriented occupations are Healthcare Support (100.0%), Cleaning & Maintenance (100.0%), and Personal Care & Service (73.3%).
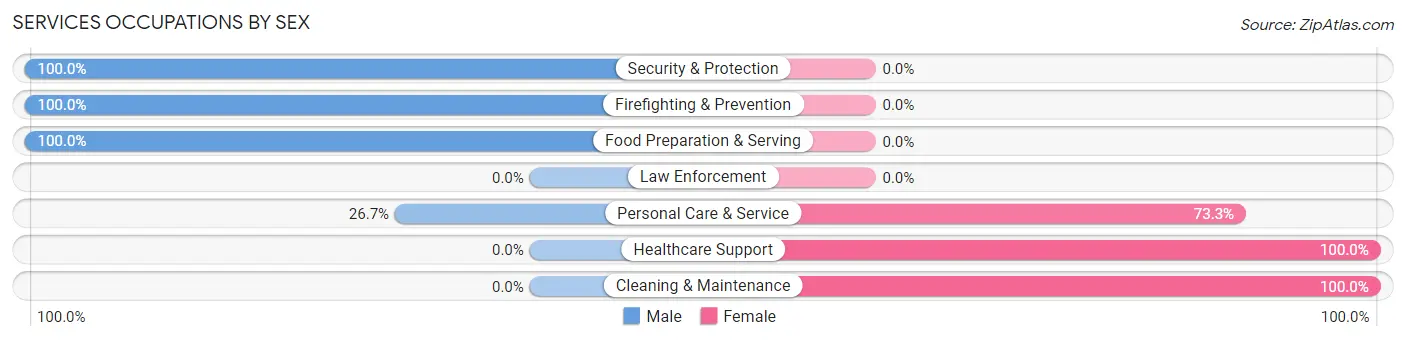
| Occupation | Male | Female |
| Healthcare Support | 0 (0.0%) | 14 (100.0%) |
| Security & Protection | 4 (100.0%) | 0 (0.0%) |
| Firefighting & Prevention | 4 (100.0%) | 0 (0.0%) |
| Law Enforcement | 0 (0.0%) | 0 (0.0%) |
| Food Preparation & Serving | 19 (100.0%) | 0 (0.0%) |
| Cleaning & Maintenance | 0 (0.0%) | 29 (100.0%) |
| Personal Care & Service | 4 (26.7%) | 11 (73.3%) |
| Total (Category) | 27 (33.3%) | 54 (66.7%) |
| Total (Overall) | 386 (56.1%) | 302 (43.9%) |
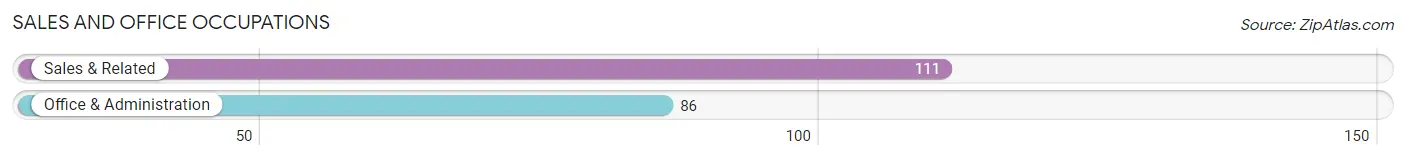
Sales and Office Occupations
The most common Sales and Office occupations in Sea Isle City are Sales & Related (111 | 16.1%), and Office & Administration (86 | 12.5%).
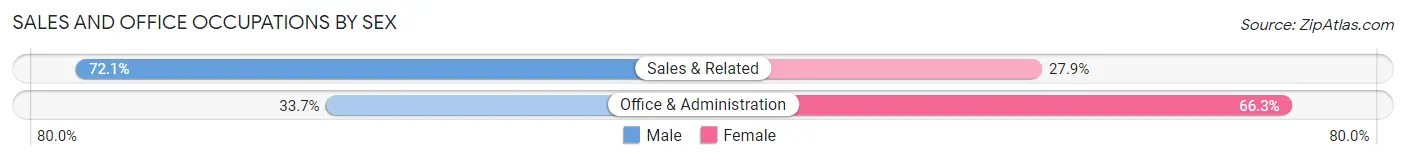
Sales and Office Occupations by Sex
| Occupation | Male | Female |
| Sales & Related | 80 (72.1%) | 31 (27.9%) |
| Office & Administration | 29 (33.7%) | 57 (66.3%) |
| Total (Category) | 109 (55.3%) | 88 (44.7%) |
| Total (Overall) | 386 (56.1%) | 302 (43.9%) |
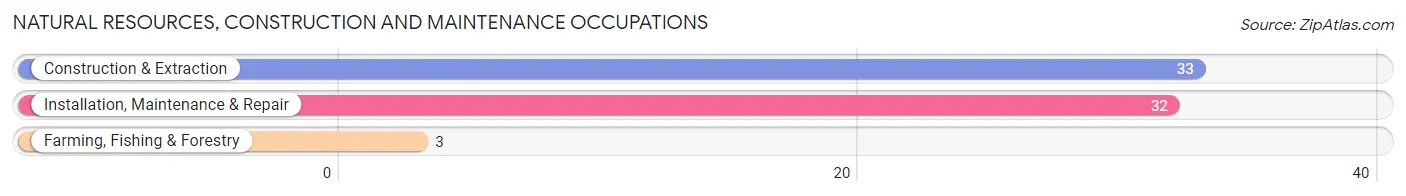
Natural Resources, Construction and Maintenance Occupations
The most common Natural Resources, Construction and Maintenance occupations in Sea Isle City are Construction & Extraction (33 | 4.8%), Installation, Maintenance & Repair (32 | 4.6%), and Farming, Fishing & Forestry (3 | 0.4%).
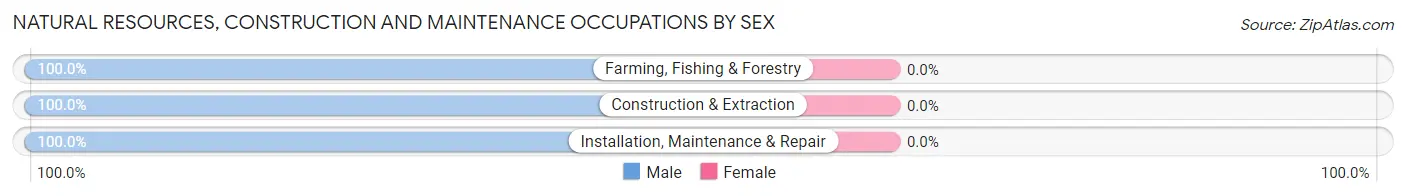
Natural Resources, Construction and Maintenance Occupations by Sex
| Occupation | Male | Female |
| Farming, Fishing & Forestry | 3 (100.0%) | 0 (0.0%) |
| Construction & Extraction | 33 (100.0%) | 0 (0.0%) |
| Installation, Maintenance & Repair | 32 (100.0%) | 0 (0.0%) |
| Total (Category) | 68 (100.0%) | 0 (0.0%) |
| Total (Overall) | 386 (56.1%) | 302 (43.9%) |
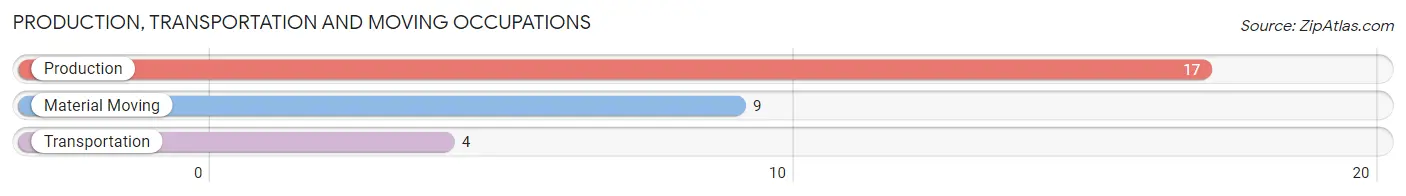
Production, Transportation and Moving Occupations
The most common Production, Transportation and Moving occupations in Sea Isle City are Production (17 | 2.5%), Material Moving (9 | 1.3%), and Transportation (4 | 0.6%).
Production, Transportation and Moving Occupations by Sex
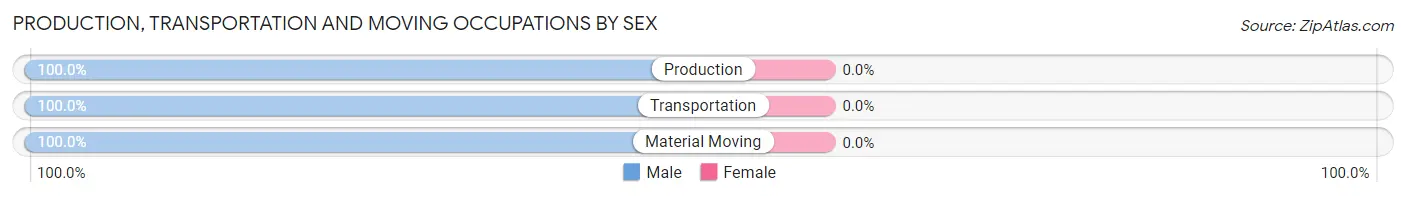
| Occupation | Male | Female |
| Production | 17 (100.0%) | 0 (0.0%) |
| Transportation | 4 (100.0%) | 0 (0.0%) |
| Material Moving | 9 (100.0%) | 0 (0.0%) |
| Total (Category) | 30 (100.0%) | 0 (0.0%) |
| Total (Overall) | 386 (56.1%) | 302 (43.9%) |
Employment Industries by Sex in Sea Isle City
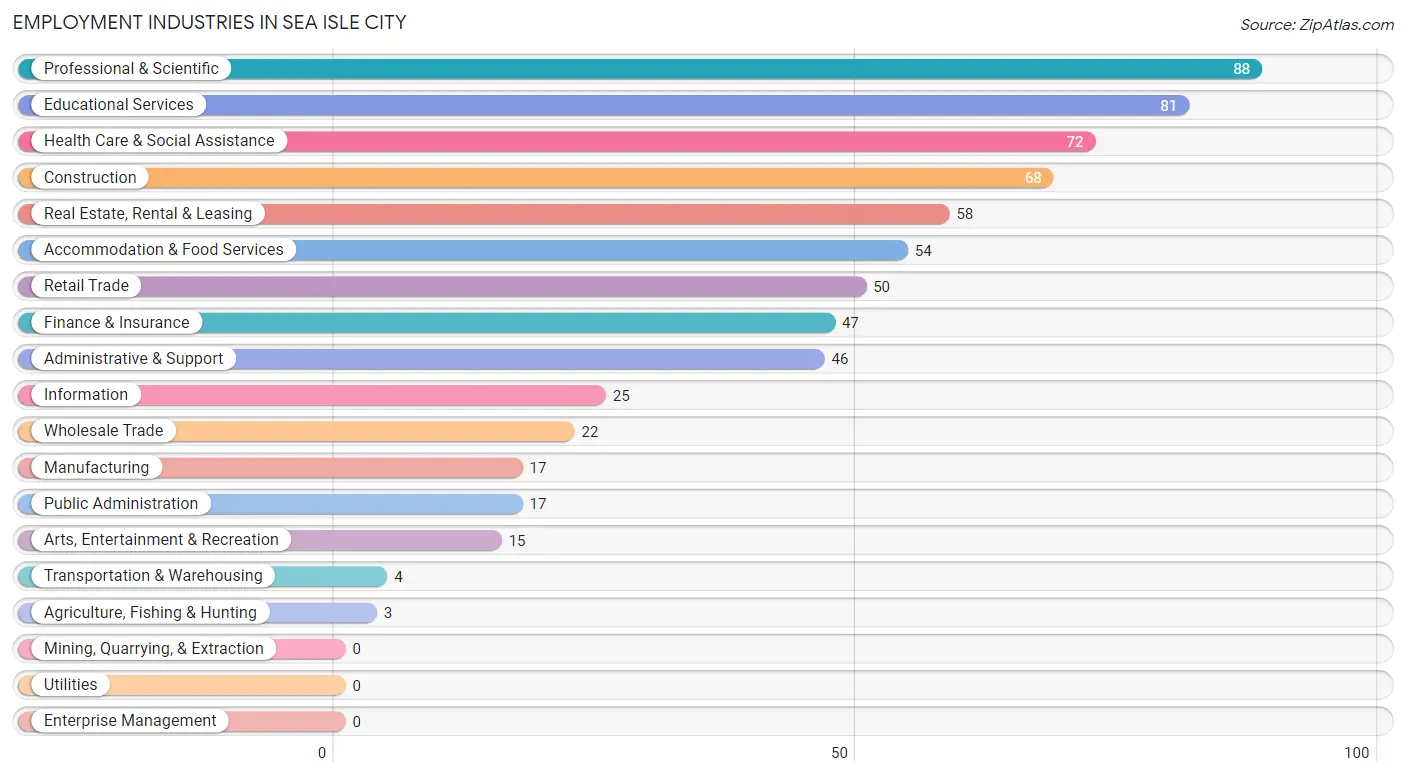
Employment Industries in Sea Isle City
The major employment industries in Sea Isle City include Professional & Scientific (88 | 12.8%), Educational Services (81 | 11.8%), Health Care & Social Assistance (72 | 10.5%), Construction (68 | 9.9%), and Real Estate, Rental & Leasing (58 | 8.4%).
Employment Industries by Sex in Sea Isle City
The Sea Isle City industries that see more men than women are Agriculture, Fishing & Hunting (100.0%), Manufacturing (100.0%), and Transportation & Warehousing (100.0%), whereas the industries that tend to have a higher number of women are Administrative & Support (100.0%), Health Care & Social Assistance (83.3%), and Educational Services (77.8%).
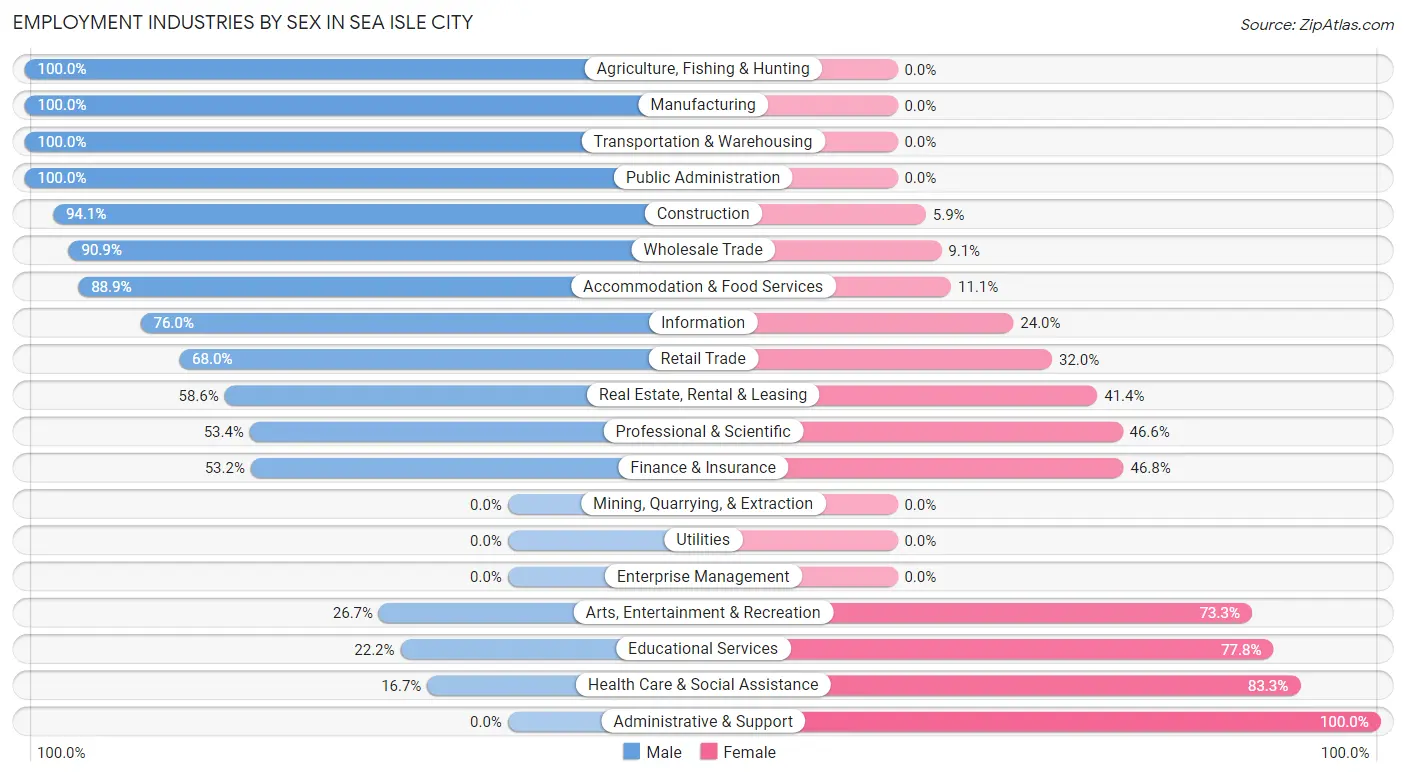
| Industry | Male | Female |
| Agriculture, Fishing & Hunting | 3 (100.0%) | 0 (0.0%) |
| Mining, Quarrying, & Extraction | 0 (0.0%) | 0 (0.0%) |
| Construction | 64 (94.1%) | 4 (5.9%) |
| Manufacturing | 17 (100.0%) | 0 (0.0%) |
| Wholesale Trade | 20 (90.9%) | 2 (9.1%) |
| Retail Trade | 34 (68.0%) | 16 (32.0%) |
| Transportation & Warehousing | 4 (100.0%) | 0 (0.0%) |
| Utilities | 0 (0.0%) | 0 (0.0%) |
| Information | 19 (76.0%) | 6 (24.0%) |
| Finance & Insurance | 25 (53.2%) | 22 (46.8%) |
| Real Estate, Rental & Leasing | 34 (58.6%) | 24 (41.4%) |
| Professional & Scientific | 47 (53.4%) | 41 (46.6%) |
| Enterprise Management | 0 (0.0%) | 0 (0.0%) |
| Administrative & Support | 0 (0.0%) | 46 (100.0%) |
| Educational Services | 18 (22.2%) | 63 (77.8%) |
| Health Care & Social Assistance | 12 (16.7%) | 60 (83.3%) |
| Arts, Entertainment & Recreation | 4 (26.7%) | 11 (73.3%) |
| Accommodation & Food Services | 48 (88.9%) | 6 (11.1%) |
| Public Administration | 17 (100.0%) | 0 (0.0%) |
| Total | 386 (56.1%) | 302 (43.9%) |
Education in Sea Isle City
School Enrollment in Sea Isle City
The most common levels of schooling among the 155 students in Sea Isle City are college / undergraduate (65 | 41.9%), middle school (50 | 32.3%), and high school (25 | 16.1%).
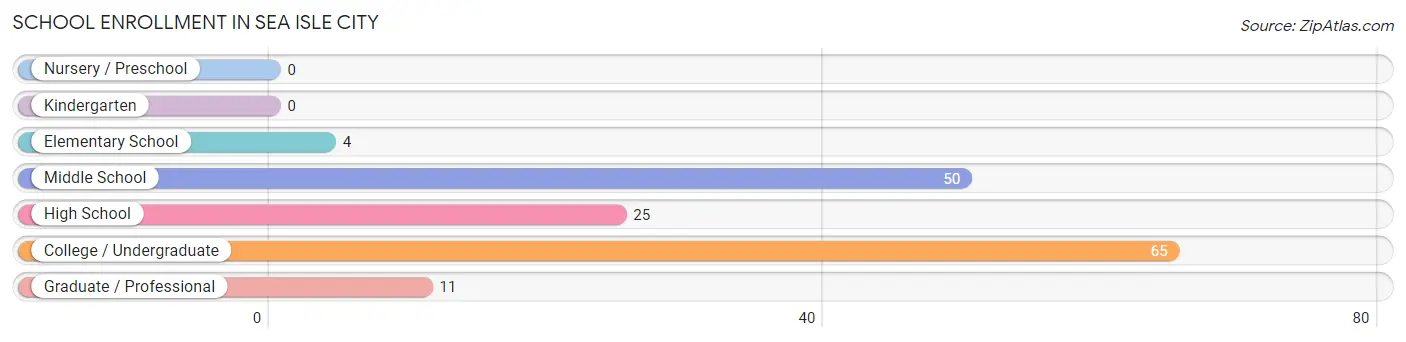
| School Level | # Students | % Students |
| Nursery / Preschool | 0 | 0.0% |
| Kindergarten | 0 | 0.0% |
| Elementary School | 4 | 2.6% |
| Middle School | 50 | 32.3% |
| High School | 25 | 16.1% |
| College / Undergraduate | 65 | 41.9% |
| Graduate / Professional | 11 | 7.1% |
| Total | 155 | 100.0% |
School Enrollment by Age by Funding Source in Sea Isle City
Out of a total of 155 students who are enrolled in schools in Sea Isle City, 32 (20.6%) attend a private institution, while the remaining 123 (79.4%) are enrolled in public schools. The age group of 18 to 19 year olds has the highest likelihood of being enrolled in private schools, with 6 (54.5% in the age bracket) enrolled. Conversely, the age group of 5 to 9 year old has the lowest likelihood of being enrolled in a private school, with 4 (100.0% in the age bracket) attending a public institution.
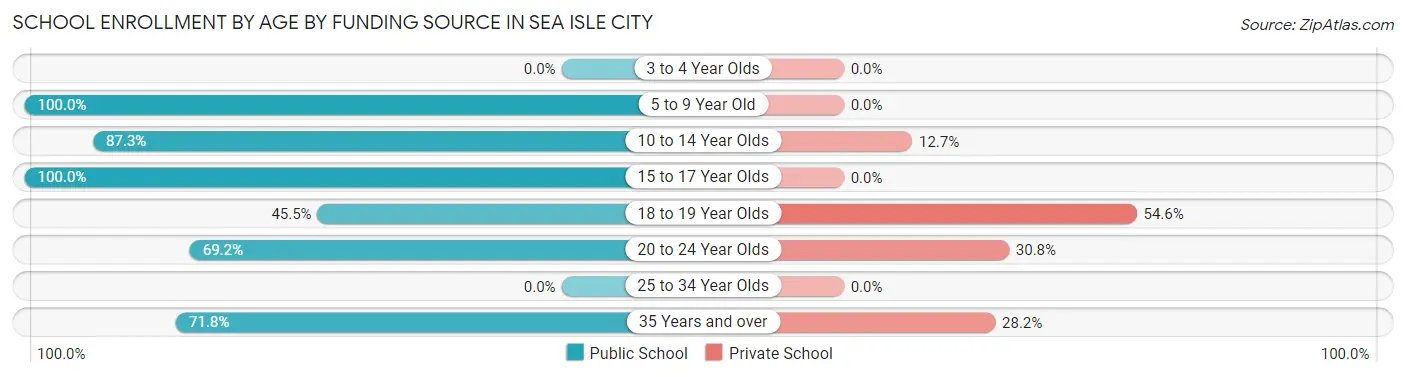
| Age Bracket | Public School | Private School |
| 3 to 4 Year Olds | 0 (0.0%) | 0 (0.0%) |
| 5 to 9 Year Old | 4 (100.0%) | 0 (0.0%) |
| 10 to 14 Year Olds | 48 (87.3%) | 7 (12.7%) |
| 15 to 17 Year Olds | 20 (100.0%) | 0 (0.0%) |
| 18 to 19 Year Olds | 5 (45.5%) | 6 (54.5%) |
| 20 to 24 Year Olds | 18 (69.2%) | 8 (30.8%) |
| 25 to 34 Year Olds | 0 (0.0%) | 0 (0.0%) |
| 35 Years and over | 28 (71.8%) | 11 (28.2%) |
| Total | 123 (79.4%) | 32 (20.6%) |
Educational Attainment by Field of Study in Sea Isle City
Business (214 | 23.6%), education (169 | 18.6%), science & technology (100 | 11.0%), social sciences (78 | 8.6%), and computers & mathematics (55 | 6.1%) are the most common fields of study among 906 individuals in Sea Isle City who have obtained a bachelor's degree or higher.
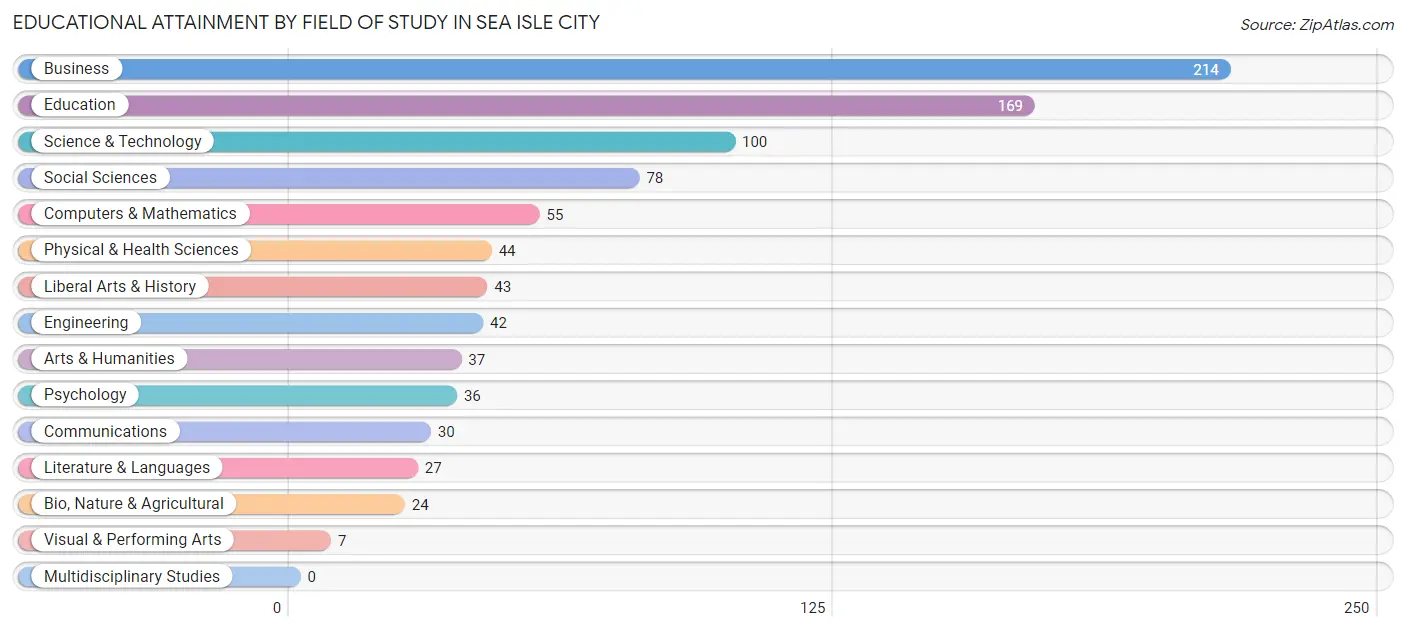
| Field of Study | # Graduates | % Graduates |
| Computers & Mathematics | 55 | 6.1% |
| Bio, Nature & Agricultural | 24 | 2.6% |
| Physical & Health Sciences | 44 | 4.9% |
| Psychology | 36 | 4.0% |
| Social Sciences | 78 | 8.6% |
| Engineering | 42 | 4.6% |
| Multidisciplinary Studies | 0 | 0.0% |
| Science & Technology | 100 | 11.0% |
| Business | 214 | 23.6% |
| Education | 169 | 18.6% |
| Literature & Languages | 27 | 3.0% |
| Liberal Arts & History | 43 | 4.8% |
| Visual & Performing Arts | 7 | 0.8% |
| Communications | 30 | 3.3% |
| Arts & Humanities | 37 | 4.1% |
| Total | 906 | 100.0% |
Transportation & Commute in Sea Isle City
Vehicle Availability by Sex in Sea Isle City
The most prevalent vehicle ownership categories in Sea Isle City are males with 2 vehicles (207, accounting for 53.9%) and females with 2 vehicles (135, making up 70.2%).
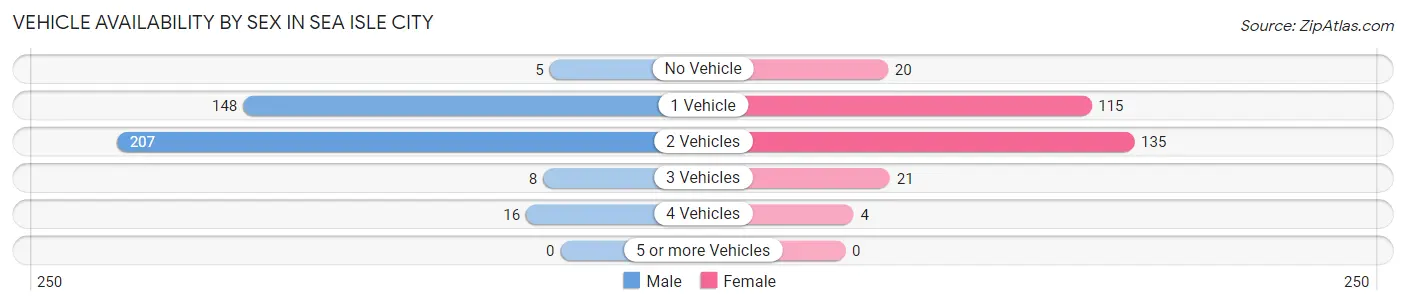
| Vehicles Available | Male | Female |
| No Vehicle | 5 (1.3%) | 20 (6.8%) |
| 1 Vehicle | 148 (38.5%) | 115 (39.0%) |
| 2 Vehicles | 207 (53.9%) | 135 (45.8%) |
| 3 Vehicles | 8 (2.1%) | 21 (7.1%) |
| 4 Vehicles | 16 (4.2%) | 4 (1.4%) |
| 5 or more Vehicles | 0 (0.0%) | 0 (0.0%) |
| Total | 384 (100.0%) | 295 (100.0%) |
Commute Time in Sea Isle City
The most frequently occuring commute durations in Sea Isle City are 10 to 14 minutes (140 commuters, 25.8%), 5 to 9 minutes (60 commuters, 11.1%), and 15 to 19 minutes (54 commuters, 9.9%).
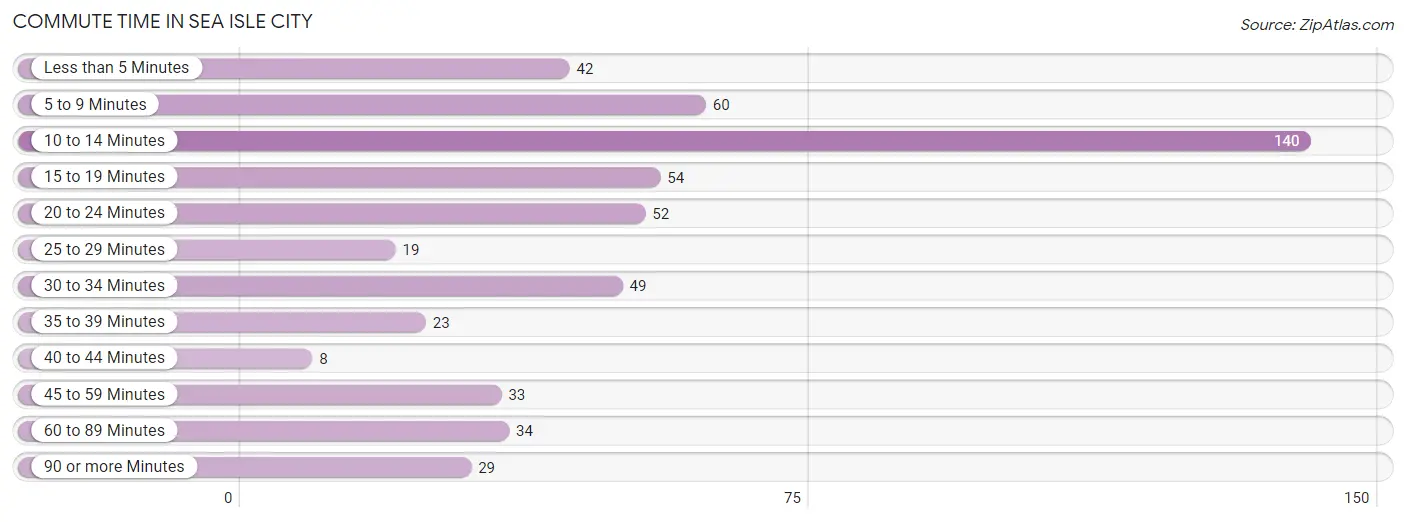
| Commute Time | # Commuters | % Commuters |
| Less than 5 Minutes | 42 | 7.7% |
| 5 to 9 Minutes | 60 | 11.1% |
| 10 to 14 Minutes | 140 | 25.8% |
| 15 to 19 Minutes | 54 | 9.9% |
| 20 to 24 Minutes | 52 | 9.6% |
| 25 to 29 Minutes | 19 | 3.5% |
| 30 to 34 Minutes | 49 | 9.0% |
| 35 to 39 Minutes | 23 | 4.2% |
| 40 to 44 Minutes | 8 | 1.5% |
| 45 to 59 Minutes | 33 | 6.1% |
| 60 to 89 Minutes | 34 | 6.3% |
| 90 or more Minutes | 29 | 5.3% |
Commute Time by Sex in Sea Isle City
The most common commute times in Sea Isle City are 10 to 14 minutes (72 commuters, 23.4%) for males and 10 to 14 minutes (68 commuters, 28.9%) for females.
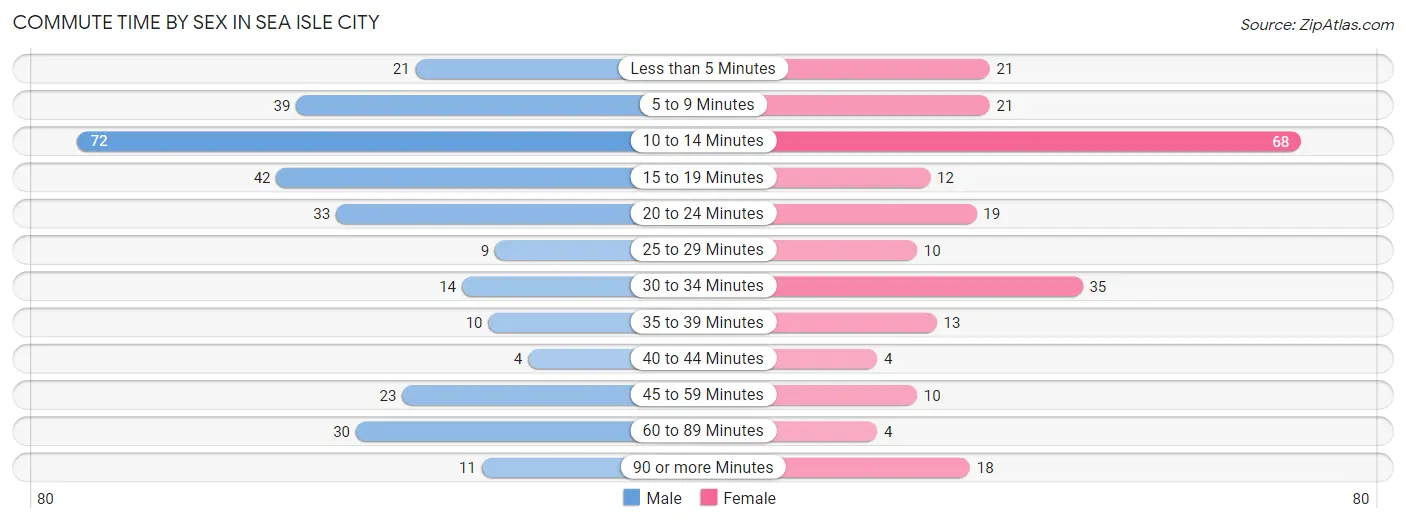
| Commute Time | Male | Female |
| Less than 5 Minutes | 21 (6.8%) | 21 (8.9%) |
| 5 to 9 Minutes | 39 (12.7%) | 21 (8.9%) |
| 10 to 14 Minutes | 72 (23.4%) | 68 (28.9%) |
| 15 to 19 Minutes | 42 (13.6%) | 12 (5.1%) |
| 20 to 24 Minutes | 33 (10.7%) | 19 (8.1%) |
| 25 to 29 Minutes | 9 (2.9%) | 10 (4.3%) |
| 30 to 34 Minutes | 14 (4.5%) | 35 (14.9%) |
| 35 to 39 Minutes | 10 (3.3%) | 13 (5.5%) |
| 40 to 44 Minutes | 4 (1.3%) | 4 (1.7%) |
| 45 to 59 Minutes | 23 (7.5%) | 10 (4.3%) |
| 60 to 89 Minutes | 30 (9.7%) | 4 (1.7%) |
| 90 or more Minutes | 11 (3.6%) | 18 (7.7%) |
Time of Departure to Work by Sex in Sea Isle City
The most frequent times of departure to work in Sea Isle City are 6:30 AM to 6:59 AM (54, 17.5%) for males and 7:00 AM to 7:29 AM (47, 20.0%) for females.
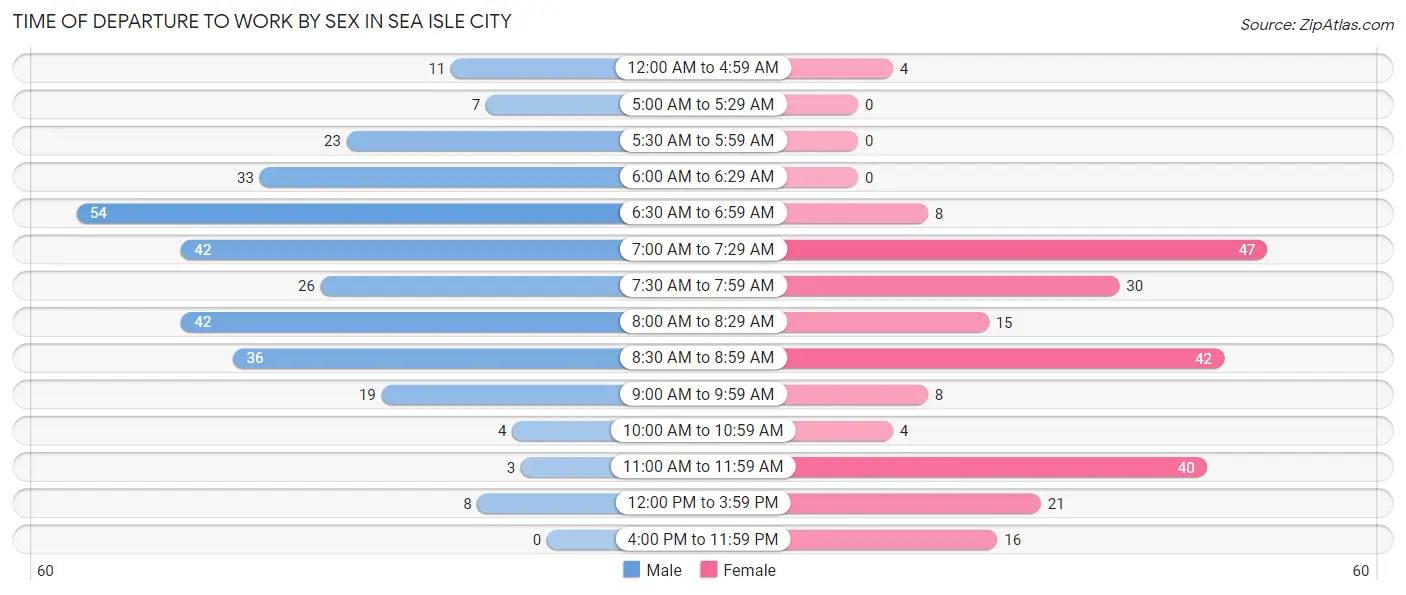
| Time of Departure | Male | Female |
| 12:00 AM to 4:59 AM | 11 (3.6%) | 4 (1.7%) |
| 5:00 AM to 5:29 AM | 7 (2.3%) | 0 (0.0%) |
| 5:30 AM to 5:59 AM | 23 (7.5%) | 0 (0.0%) |
| 6:00 AM to 6:29 AM | 33 (10.7%) | 0 (0.0%) |
| 6:30 AM to 6:59 AM | 54 (17.5%) | 8 (3.4%) |
| 7:00 AM to 7:29 AM | 42 (13.6%) | 47 (20.0%) |
| 7:30 AM to 7:59 AM | 26 (8.4%) | 30 (12.8%) |
| 8:00 AM to 8:29 AM | 42 (13.6%) | 15 (6.4%) |
| 8:30 AM to 8:59 AM | 36 (11.7%) | 42 (17.9%) |
| 9:00 AM to 9:59 AM | 19 (6.2%) | 8 (3.4%) |
| 10:00 AM to 10:59 AM | 4 (1.3%) | 4 (1.7%) |
| 11:00 AM to 11:59 AM | 3 (1.0%) | 40 (17.0%) |
| 12:00 PM to 3:59 PM | 8 (2.6%) | 21 (8.9%) |
| 4:00 PM to 11:59 PM | 0 (0.0%) | 16 (6.8%) |
| Total | 308 (100.0%) | 235 (100.0%) |
Housing Occupancy in Sea Isle City
Occupancy by Ownership in Sea Isle City
Of the total 1,127 dwellings in Sea Isle City, owner-occupied units account for 1,046 (92.8%), while renter-occupied units make up 81 (7.2%).
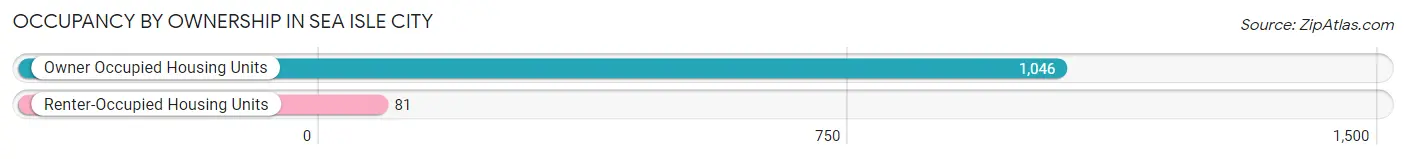
| Occupancy | # Housing Units | % Housing Units |
| Owner Occupied Housing Units | 1,046 | 92.8% |
| Renter-Occupied Housing Units | 81 | 7.2% |
| Total Occupied Housing Units | 1,127 | 100.0% |
Occupancy by Household Size in Sea Isle City
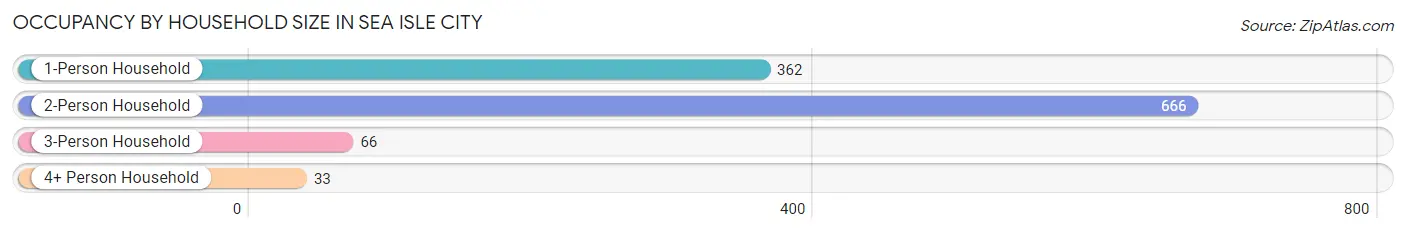
| Household Size | # Housing Units | % Housing Units |
| 1-Person Household | 362 | 32.1% |
| 2-Person Household | 666 | 59.1% |
| 3-Person Household | 66 | 5.9% |
| 4+ Person Household | 33 | 2.9% |
| Total Housing Units | 1,127 | 100.0% |
Occupancy by Ownership by Household Size in Sea Isle City
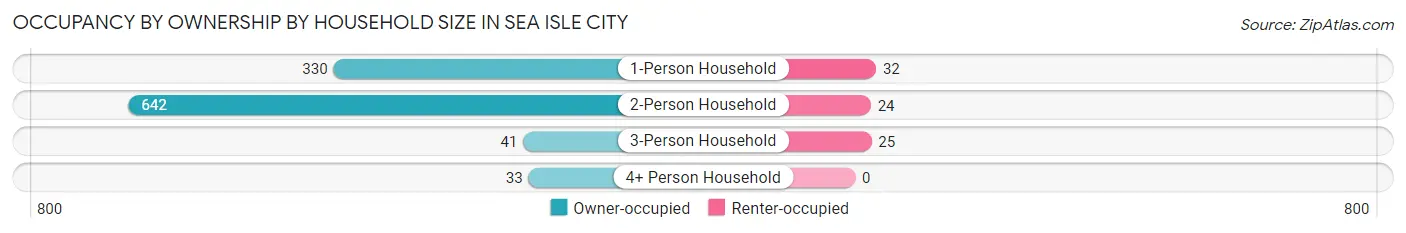
| Household Size | Owner-occupied | Renter-occupied |
| 1-Person Household | 330 (91.2%) | 32 (8.8%) |
| 2-Person Household | 642 (96.4%) | 24 (3.6%) |
| 3-Person Household | 41 (62.1%) | 25 (37.9%) |
| 4+ Person Household | 33 (100.0%) | 0 (0.0%) |
| Total Housing Units | 1,046 (92.8%) | 81 (7.2%) |
Occupancy by Educational Attainment in Sea Isle City
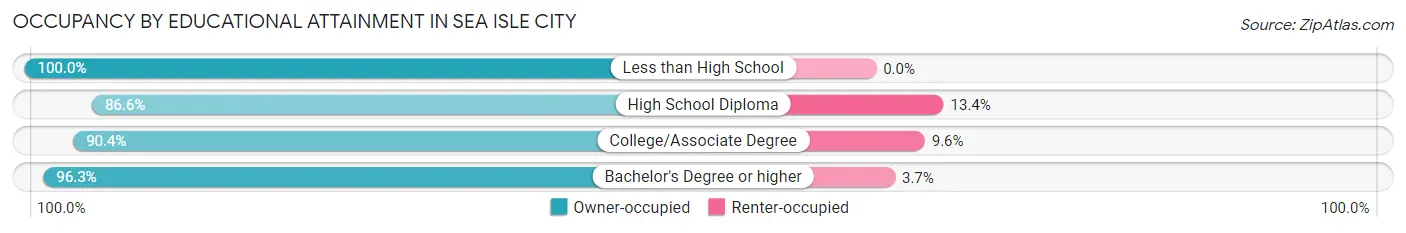
| Household Size | Owner-occupied | Renter-occupied |
| Less than High School | 4 (100.0%) | 0 (0.0%) |
| High School Diploma | 175 (86.6%) | 27 (13.4%) |
| College/Associate Degree | 300 (90.4%) | 32 (9.6%) |
| Bachelor's Degree or higher | 567 (96.3%) | 22 (3.7%) |
Occupancy by Age of Householder in Sea Isle City
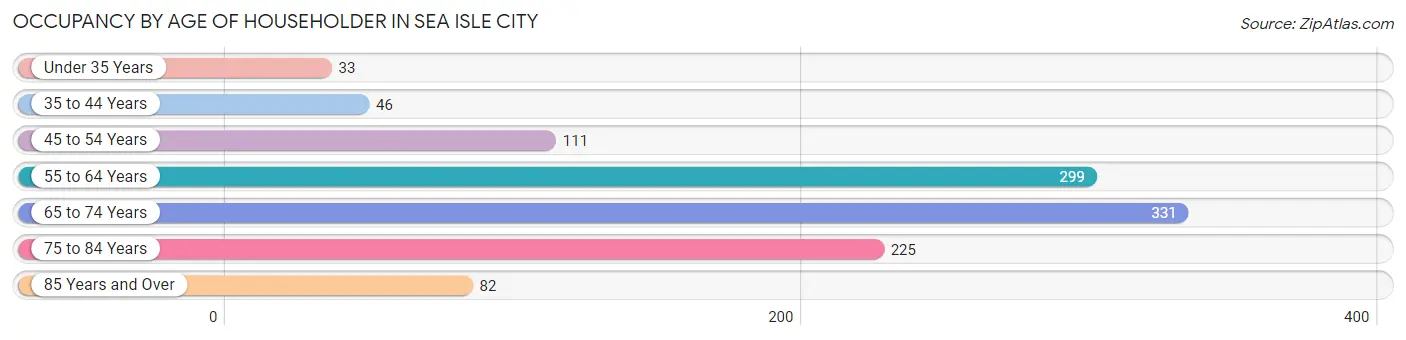
| Age Bracket | # Households | % Households |
| Under 35 Years | 33 | 2.9% |
| 35 to 44 Years | 46 | 4.1% |
| 45 to 54 Years | 111 | 9.9% |
| 55 to 64 Years | 299 | 26.5% |
| 65 to 74 Years | 331 | 29.4% |
| 75 to 84 Years | 225 | 20.0% |
| 85 Years and Over | 82 | 7.3% |
| Total | 1,127 | 100.0% |
Housing Finances in Sea Isle City
Median Income by Occupancy in Sea Isle City
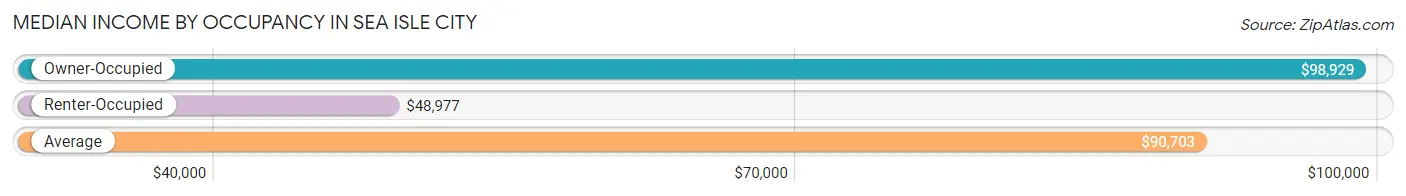
| Occupancy Type | # Households | Median Income |
| Owner-Occupied | 1,046 (92.8%) | $98,929 |
| Renter-Occupied | 81 (7.2%) | $48,977 |
| Average | 1,127 (100.0%) | $90,703 |
Occupancy by Householder Income Bracket in Sea Isle City
| Income Bracket | Owner-occupied | Renter-occupied |
| Less than $5,000 | 15 (1.4%) | 6 (7.4%) |
| $5,000 to $9,999 | 6 (0.6%) | 0 (0.0%) |
| $10,000 to $14,999 | 12 (1.1%) | 0 (0.0%) |
| $15,000 to $19,999 | 22 (2.1%) | 0 (0.0%) |
| $20,000 to $24,999 | 5 (0.5%) | 0 (0.0%) |
| $25,000 to $34,999 | 31 (3.0%) | 20 (24.7%) |
| $35,000 to $49,999 | 153 (14.6%) | 19 (23.5%) |
| $50,000 to $74,999 | 166 (15.9%) | 8 (9.9%) |
| $75,000 to $99,999 | 116 (11.1%) | 24 (29.6%) |
| $100,000 to $149,999 | 196 (18.7%) | 0 (0.0%) |
| $150,000 or more | 324 (31.0%) | 4 (4.9%) |
| Total | 1,046 (100.0%) | 81 (100.0%) |
Monthly Housing Cost Tiers in Sea Isle City
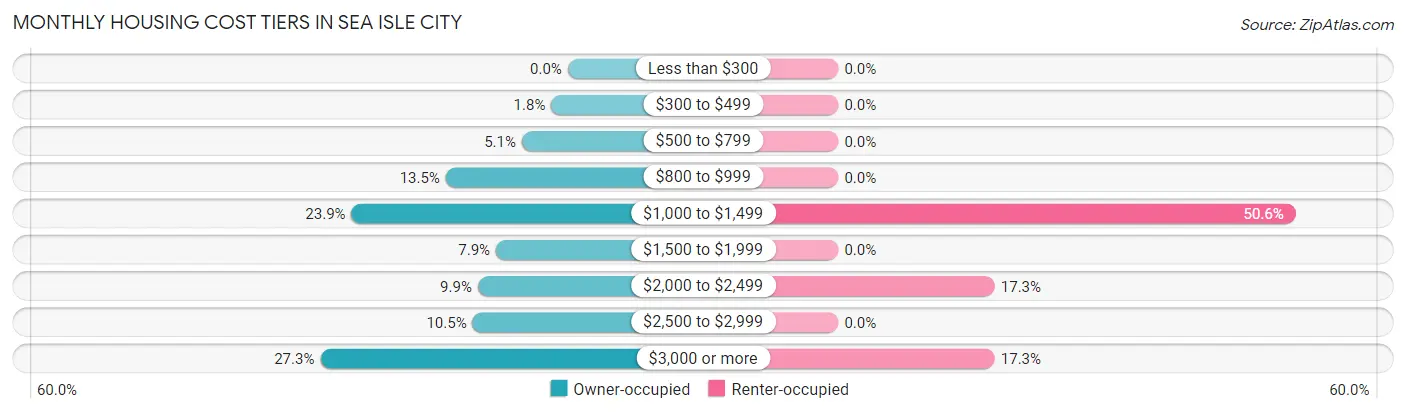
| Monthly Cost | Owner-occupied | Renter-occupied |
| Less than $300 | 0 (0.0%) | 0 (0.0%) |
| $300 to $499 | 19 (1.8%) | 0 (0.0%) |
| $500 to $799 | 53 (5.1%) | 0 (0.0%) |
| $800 to $999 | 141 (13.5%) | 0 (0.0%) |
| $1,000 to $1,499 | 250 (23.9%) | 41 (50.6%) |
| $1,500 to $1,999 | 83 (7.9%) | 0 (0.0%) |
| $2,000 to $2,499 | 104 (9.9%) | 14 (17.3%) |
| $2,500 to $2,999 | 110 (10.5%) | 0 (0.0%) |
| $3,000 or more | 286 (27.3%) | 14 (17.3%) |
| Total | 1,046 (100.0%) | 81 (100.0%) |
Physical Housing Characteristics in Sea Isle City
Housing Structures in Sea Isle City
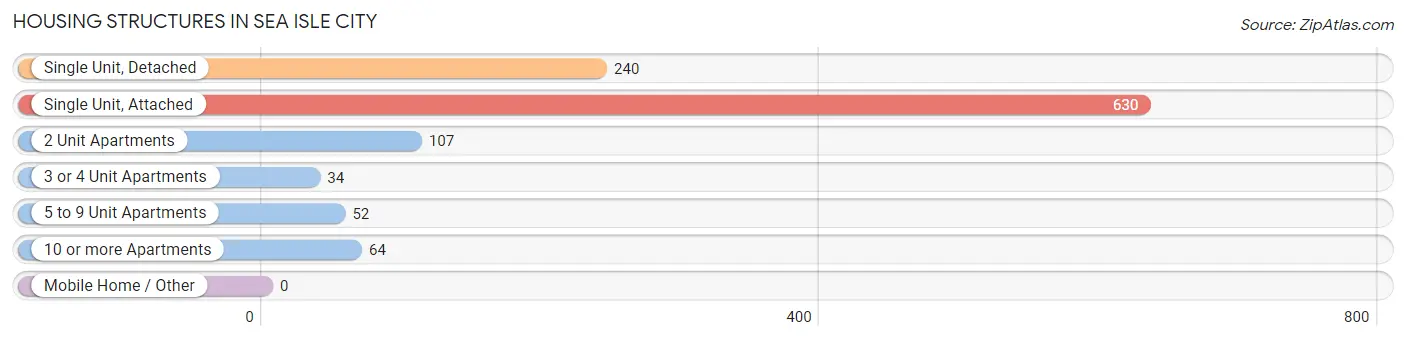
| Structure Type | # Housing Units | % Housing Units |
| Single Unit, Detached | 240 | 21.3% |
| Single Unit, Attached | 630 | 55.9% |
| 2 Unit Apartments | 107 | 9.5% |
| 3 or 4 Unit Apartments | 34 | 3.0% |
| 5 to 9 Unit Apartments | 52 | 4.6% |
| 10 or more Apartments | 64 | 5.7% |
| Mobile Home / Other | 0 | 0.0% |
| Total | 1,127 | 100.0% |
Housing Structures by Occupancy in Sea Isle City
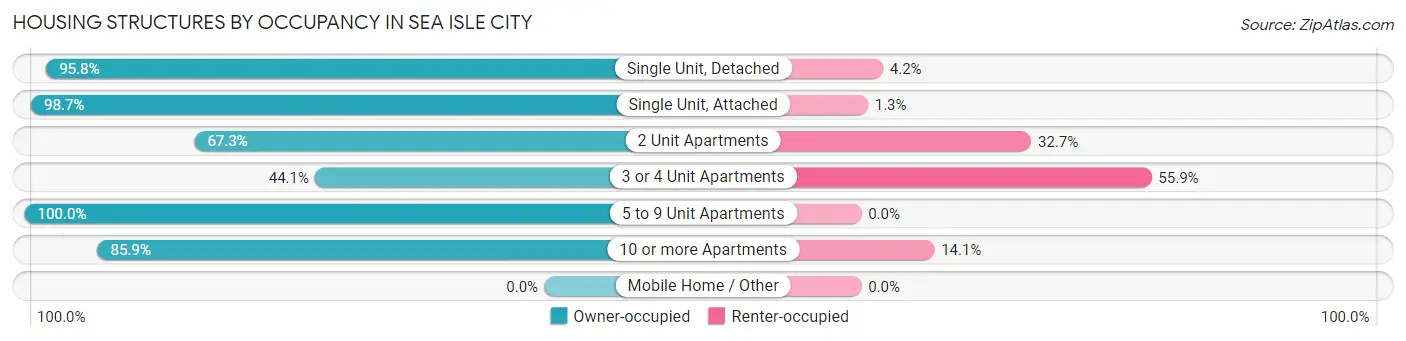
| Structure Type | Owner-occupied | Renter-occupied |
| Single Unit, Detached | 230 (95.8%) | 10 (4.2%) |
| Single Unit, Attached | 622 (98.7%) | 8 (1.3%) |
| 2 Unit Apartments | 72 (67.3%) | 35 (32.7%) |
| 3 or 4 Unit Apartments | 15 (44.1%) | 19 (55.9%) |
| 5 to 9 Unit Apartments | 52 (100.0%) | 0 (0.0%) |
| 10 or more Apartments | 55 (85.9%) | 9 (14.1%) |
| Mobile Home / Other | 0 (0.0%) | 0 (0.0%) |
| Total | 1,046 (92.8%) | 81 (7.2%) |
Housing Structures by Number of Rooms in Sea Isle City
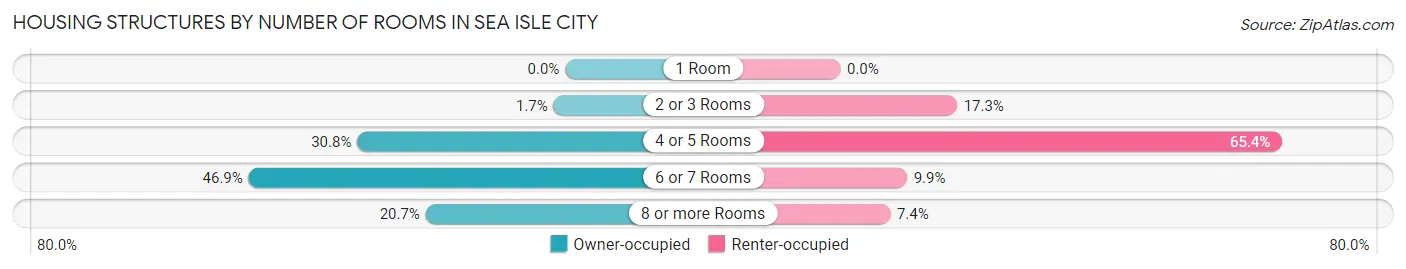
| Number of Rooms | Owner-occupied | Renter-occupied |
| 1 Room | 0 (0.0%) | 0 (0.0%) |
| 2 or 3 Rooms | 18 (1.7%) | 14 (17.3%) |
| 4 or 5 Rooms | 322 (30.8%) | 53 (65.4%) |
| 6 or 7 Rooms | 490 (46.9%) | 8 (9.9%) |
| 8 or more Rooms | 216 (20.6%) | 6 (7.4%) |
| Total | 1,046 (100.0%) | 81 (100.0%) |
Housing Structure by Heating Type in Sea Isle City
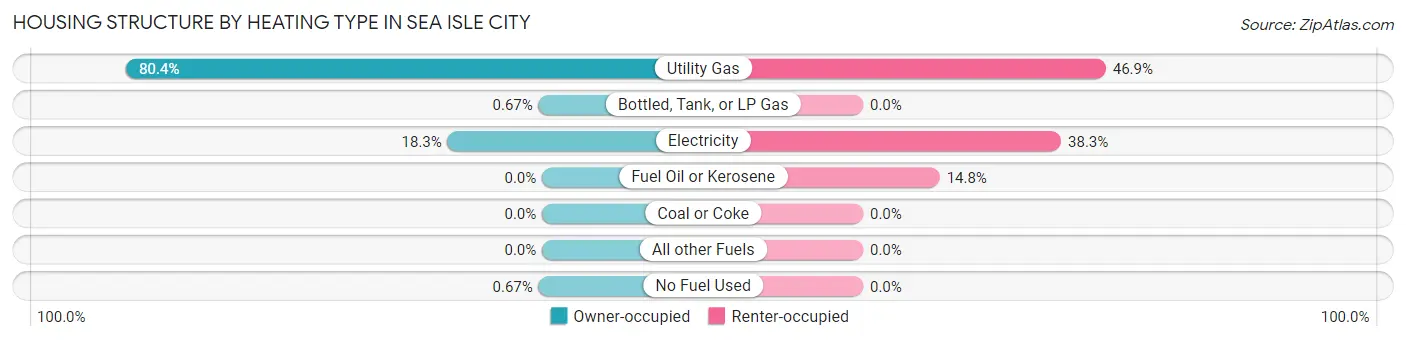
| Heating Type | Owner-occupied | Renter-occupied |
| Utility Gas | 841 (80.4%) | 38 (46.9%) |
| Bottled, Tank, or LP Gas | 7 (0.7%) | 0 (0.0%) |
| Electricity | 191 (18.3%) | 31 (38.3%) |
| Fuel Oil or Kerosene | 0 (0.0%) | 12 (14.8%) |
| Coal or Coke | 0 (0.0%) | 0 (0.0%) |
| All other Fuels | 0 (0.0%) | 0 (0.0%) |
| No Fuel Used | 7 (0.7%) | 0 (0.0%) |
| Total | 1,046 (100.0%) | 81 (100.0%) |
Household Vehicle Usage in Sea Isle City
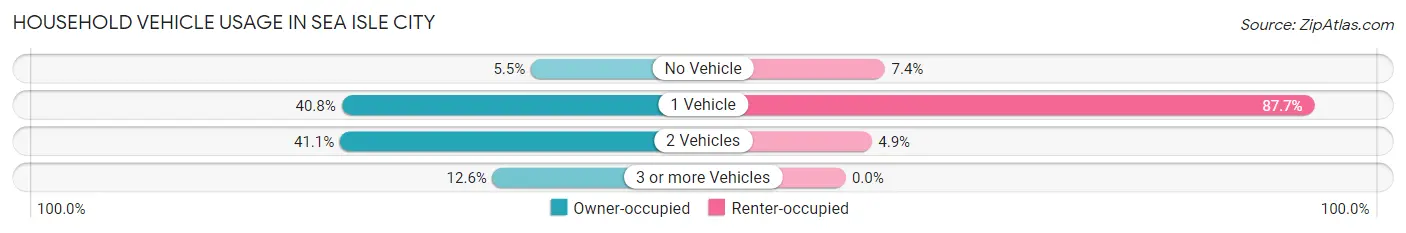
| Vehicles per Household | Owner-occupied | Renter-occupied |
| No Vehicle | 57 (5.4%) | 6 (7.4%) |
| 1 Vehicle | 427 (40.8%) | 71 (87.6%) |
| 2 Vehicles | 430 (41.1%) | 4 (4.9%) |
| 3 or more Vehicles | 132 (12.6%) | 0 (0.0%) |
| Total | 1,046 (100.0%) | 81 (100.0%) |
Real Estate & Mortgages in Sea Isle City
Real Estate and Mortgage Overview in Sea Isle City
| Characteristic | Without Mortgage | With Mortgage |
| Housing Units | 508 | 538 |
| Median Property Value | $925,000 | $878,200 |
| Median Household Income | $84,000 | $173 |
| Monthly Housing Costs | $1,075 | $278 |
| Real Estate Taxes | $5,509 | $13 |
Property Value by Mortgage Status in Sea Isle City
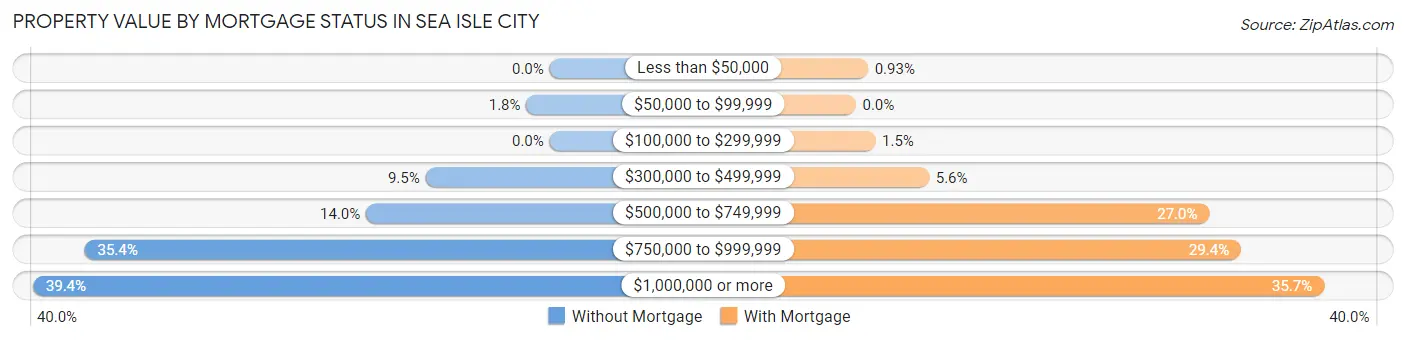
| Property Value | Without Mortgage | With Mortgage |
| Less than $50,000 | 0 (0.0%) | 5 (0.9%) |
| $50,000 to $99,999 | 9 (1.8%) | 0 (0.0%) |
| $100,000 to $299,999 | 0 (0.0%) | 8 (1.5%) |
| $300,000 to $499,999 | 48 (9.5%) | 30 (5.6%) |
| $500,000 to $749,999 | 71 (14.0%) | 145 (27.0%) |
| $750,000 to $999,999 | 180 (35.4%) | 158 (29.4%) |
| $1,000,000 or more | 200 (39.4%) | 192 (35.7%) |
| Total | 508 (100.0%) | 538 (100.0%) |
Household Income by Mortgage Status in Sea Isle City
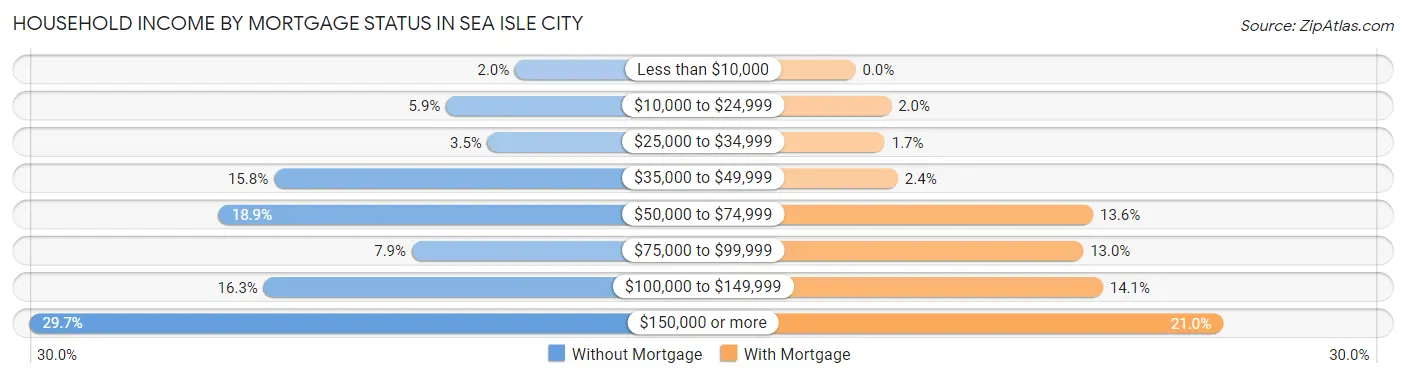
| Household Income | Without Mortgage | With Mortgage |
| Less than $10,000 | 10 (2.0%) | 0 (0.0%) |
| $10,000 to $24,999 | 30 (5.9%) | 11 (2.0%) |
| $25,000 to $34,999 | 18 (3.5%) | 9 (1.7%) |
| $35,000 to $49,999 | 80 (15.8%) | 13 (2.4%) |
| $50,000 to $74,999 | 96 (18.9%) | 73 (13.6%) |
| $75,000 to $99,999 | 40 (7.9%) | 70 (13.0%) |
| $100,000 to $149,999 | 83 (16.3%) | 76 (14.1%) |
| $150,000 or more | 151 (29.7%) | 113 (21.0%) |
| Total | 508 (100.0%) | 538 (100.0%) |
Property Value to Household Income Ratio in Sea Isle City
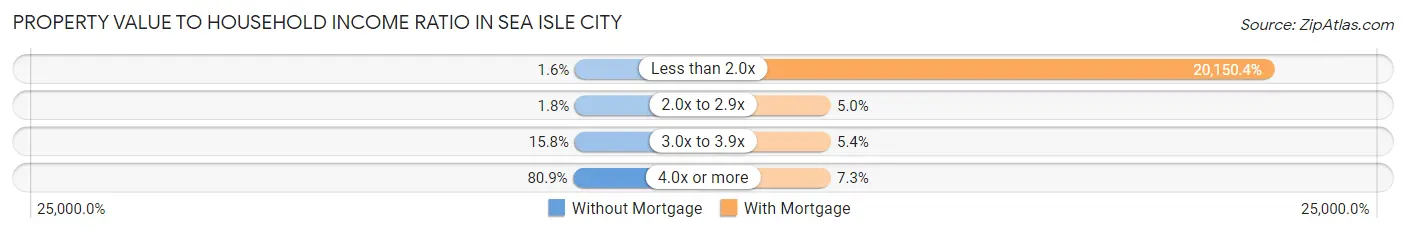
| Value-to-Income Ratio | Without Mortgage | With Mortgage |
| Less than 2.0x | 8 (1.6%) | 108,409 (20,150.4%) |
| 2.0x to 2.9x | 9 (1.8%) | 27 (5.0%) |
| 3.0x to 3.9x | 80 (15.8%) | 29 (5.4%) |
| 4.0x or more | 411 (80.9%) | 39 (7.2%) |
| Total | 508 (100.0%) | 538 (100.0%) |
Real Estate Taxes by Mortgage Status in Sea Isle City
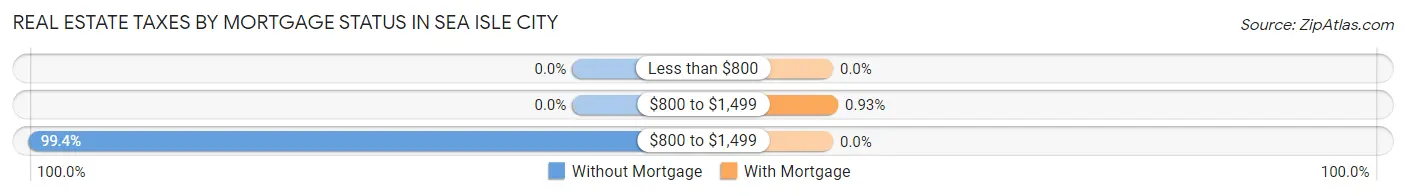
| Property Taxes | Without Mortgage | With Mortgage |
| Less than $800 | 0 (0.0%) | 0 (0.0%) |
| $800 to $1,499 | 0 (0.0%) | 5 (0.9%) |
| $800 to $1,499 | 505 (99.4%) | 0 (0.0%) |
| Total | 508 (100.0%) | 538 (100.0%) |
Health & Disability in Sea Isle City
Health Insurance Coverage by Age in Sea Isle City
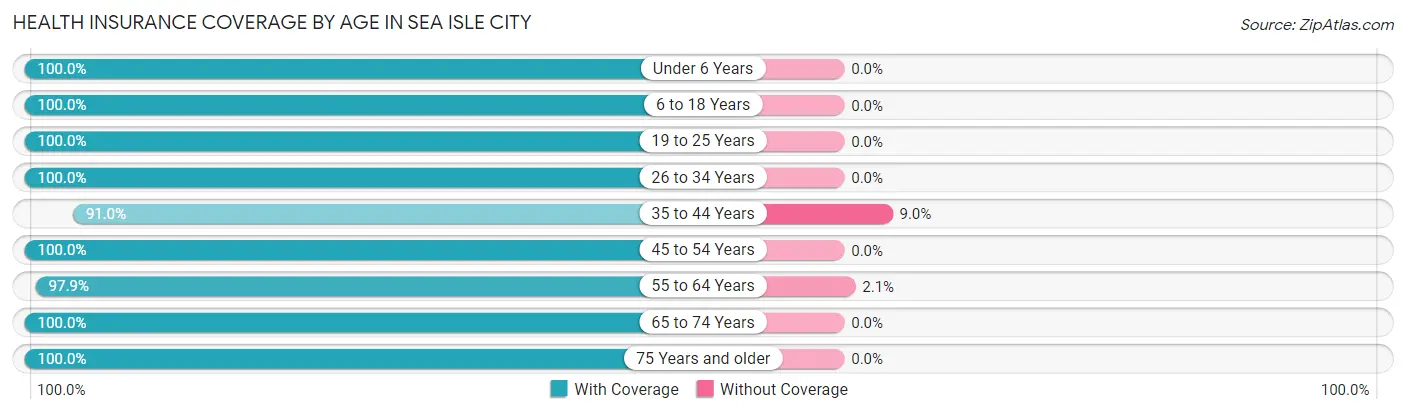
| Age Bracket | With Coverage | Without Coverage |
| Under 6 Years | 6 (100.0%) | 0 (0.0%) |
| 6 to 18 Years | 98 (100.0%) | 0 (0.0%) |
| 19 to 25 Years | 67 (100.0%) | 0 (0.0%) |
| 26 to 34 Years | 27 (100.0%) | 0 (0.0%) |
| 35 to 44 Years | 81 (91.0%) | 8 (9.0%) |
| 45 to 54 Years | 198 (100.0%) | 0 (0.0%) |
| 55 to 64 Years | 523 (97.9%) | 11 (2.1%) |
| 65 to 74 Years | 549 (100.0%) | 0 (0.0%) |
| 75 Years and older | 479 (100.0%) | 0 (0.0%) |
| Total | 2,028 (99.1%) | 19 (0.9%) |
Health Insurance Coverage by Citizenship Status in Sea Isle City
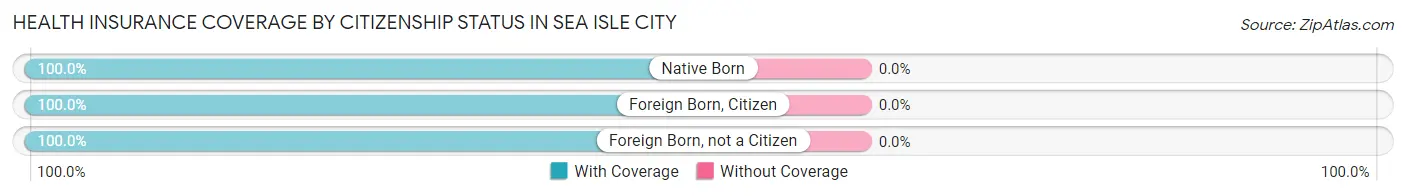
| Citizenship Status | With Coverage | Without Coverage |
| Native Born | 6 (100.0%) | 0 (0.0%) |
| Foreign Born, Citizen | 98 (100.0%) | 0 (0.0%) |
| Foreign Born, not a Citizen | 67 (100.0%) | 0 (0.0%) |
Health Insurance Coverage by Household Income in Sea Isle City
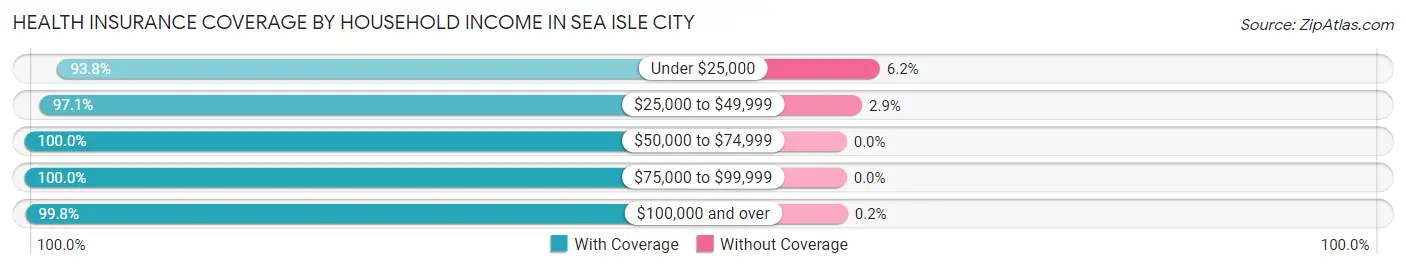
| Household Income | With Coverage | Without Coverage |
| Under $25,000 | 91 (93.8%) | 6 (6.2%) |
| $25,000 to $49,999 | 372 (97.1%) | 11 (2.9%) |
| $50,000 to $74,999 | 283 (100.0%) | 0 (0.0%) |
| $75,000 to $99,999 | 265 (100.0%) | 0 (0.0%) |
| $100,000 and over | 1,012 (99.8%) | 2 (0.2%) |
Public vs Private Health Insurance Coverage by Age in Sea Isle City
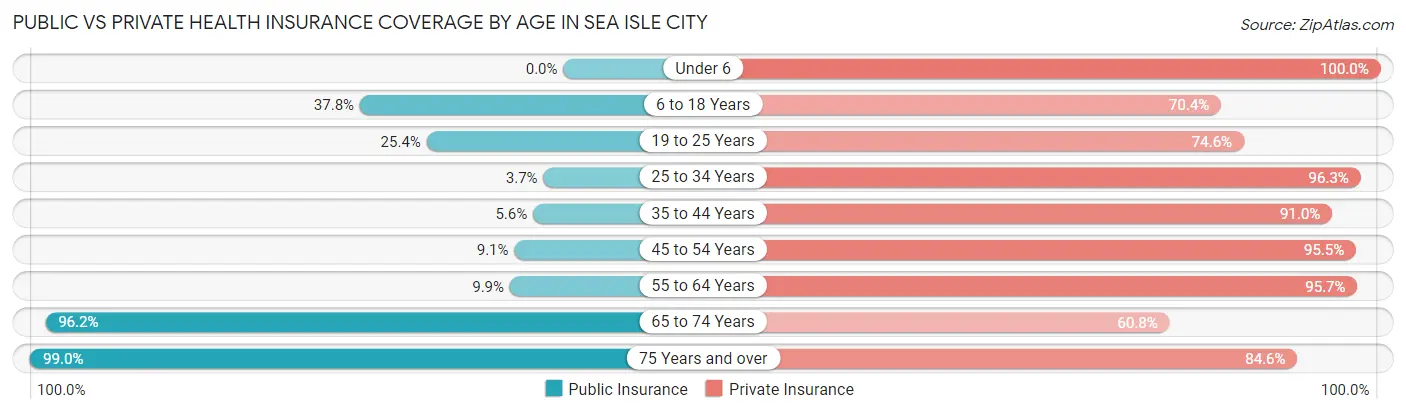
| Age Bracket | Public Insurance | Private Insurance |
| Under 6 | 0 (0.0%) | 6 (100.0%) |
| 6 to 18 Years | 37 (37.8%) | 69 (70.4%) |
| 19 to 25 Years | 17 (25.4%) | 50 (74.6%) |
| 25 to 34 Years | 1 (3.7%) | 26 (96.3%) |
| 35 to 44 Years | 5 (5.6%) | 81 (91.0%) |
| 45 to 54 Years | 18 (9.1%) | 189 (95.5%) |
| 55 to 64 Years | 53 (9.9%) | 511 (95.7%) |
| 65 to 74 Years | 528 (96.2%) | 334 (60.8%) |
| 75 Years and over | 474 (99.0%) | 405 (84.6%) |
| Total | 1,133 (55.3%) | 1,671 (81.6%) |
Disability Status by Sex by Age in Sea Isle City
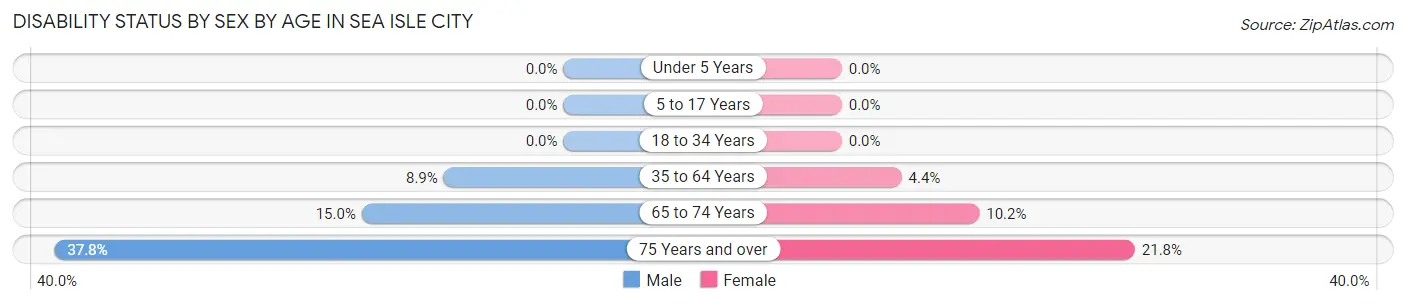
| Age Bracket | Male | Female |
| Under 5 Years | 0 (0.0%) | 0 (0.0%) |
| 5 to 17 Years | 0 (0.0%) | 0 (0.0%) |
| 18 to 34 Years | 0 (0.0%) | 0 (0.0%) |
| 35 to 64 Years | 33 (8.9%) | 20 (4.4%) |
| 65 to 74 Years | 47 (15.0%) | 24 (10.2%) |
| 75 Years and over | 82 (37.8%) | 57 (21.8%) |
Disability Class by Sex by Age in Sea Isle City
Disability Class: Hearing Difficulty
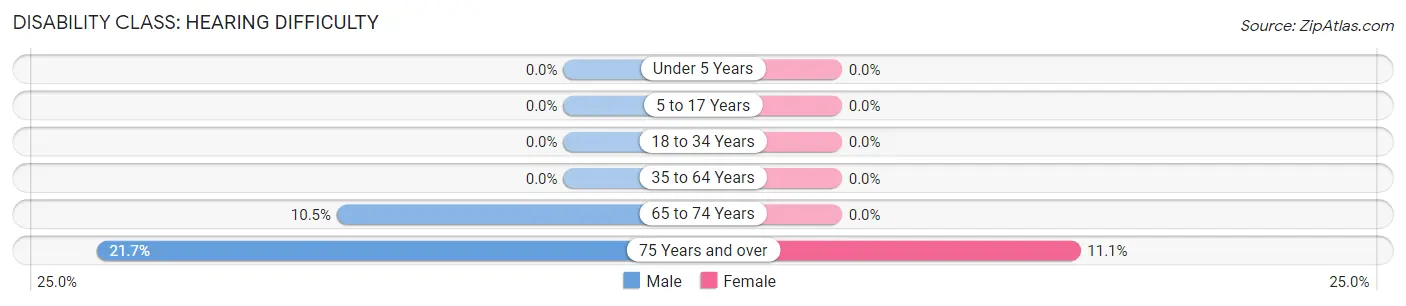
| Age Bracket | Male | Female |
| Under 5 Years | 0 (0.0%) | 0 (0.0%) |
| 5 to 17 Years | 0 (0.0%) | 0 (0.0%) |
| 18 to 34 Years | 0 (0.0%) | 0 (0.0%) |
| 35 to 64 Years | 0 (0.0%) | 0 (0.0%) |
| 65 to 74 Years | 33 (10.5%) | 0 (0.0%) |
| 75 Years and over | 47 (21.7%) | 29 (11.1%) |
Disability Class: Vision Difficulty
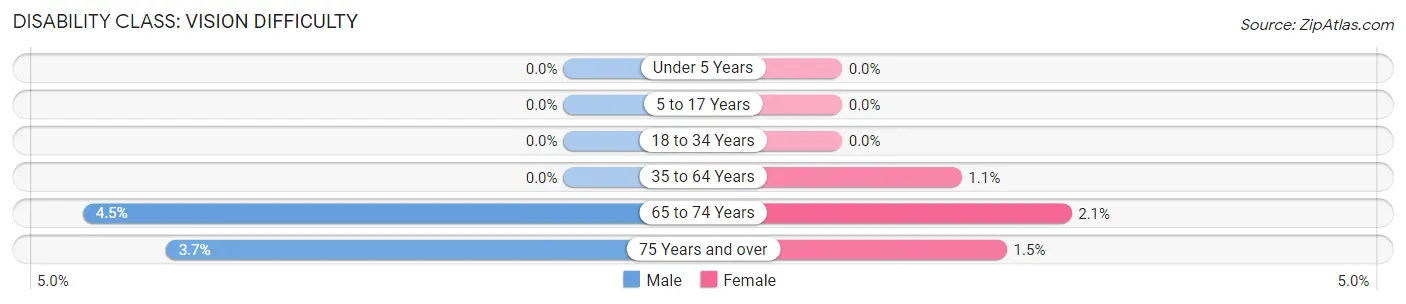
| Age Bracket | Male | Female |
| Under 5 Years | 0 (0.0%) | 0 (0.0%) |
| 5 to 17 Years | 0 (0.0%) | 0 (0.0%) |
| 18 to 34 Years | 0 (0.0%) | 0 (0.0%) |
| 35 to 64 Years | 0 (0.0%) | 5 (1.1%) |
| 65 to 74 Years | 14 (4.5%) | 5 (2.1%) |
| 75 Years and over | 8 (3.7%) | 4 (1.5%) |
Disability Class: Cognitive Difficulty
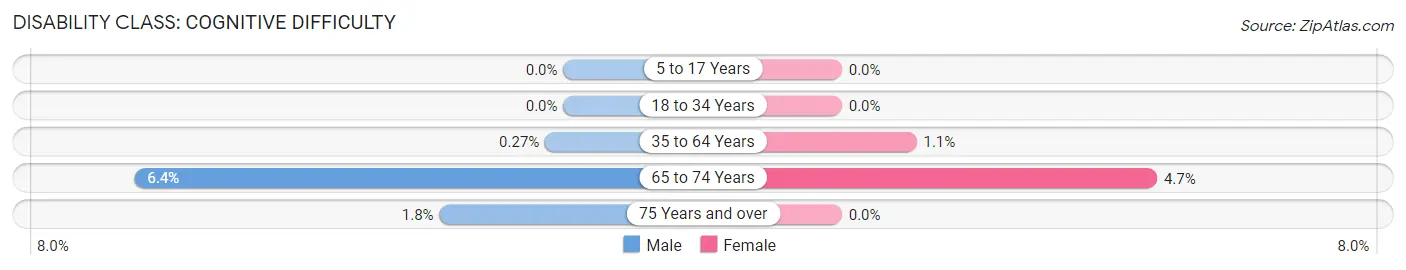
| Age Bracket | Male | Female |
| 5 to 17 Years | 0 (0.0%) | 0 (0.0%) |
| 18 to 34 Years | 0 (0.0%) | 0 (0.0%) |
| 35 to 64 Years | 1 (0.3%) | 5 (1.1%) |
| 65 to 74 Years | 20 (6.4%) | 11 (4.7%) |
| 75 Years and over | 4 (1.8%) | 0 (0.0%) |
Disability Class: Ambulatory Difficulty
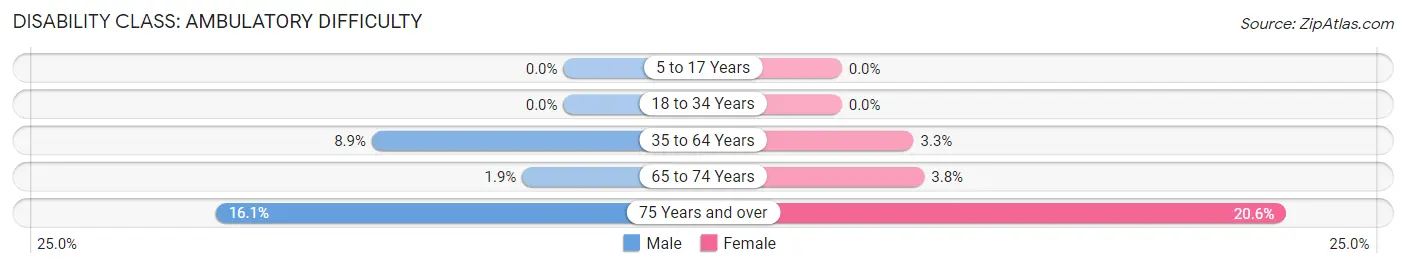
| Age Bracket | Male | Female |
| 5 to 17 Years | 0 (0.0%) | 0 (0.0%) |
| 18 to 34 Years | 0 (0.0%) | 0 (0.0%) |
| 35 to 64 Years | 33 (8.9%) | 15 (3.3%) |
| 65 to 74 Years | 6 (1.9%) | 9 (3.8%) |
| 75 Years and over | 35 (16.1%) | 54 (20.6%) |
Disability Class: Self-Care Difficulty
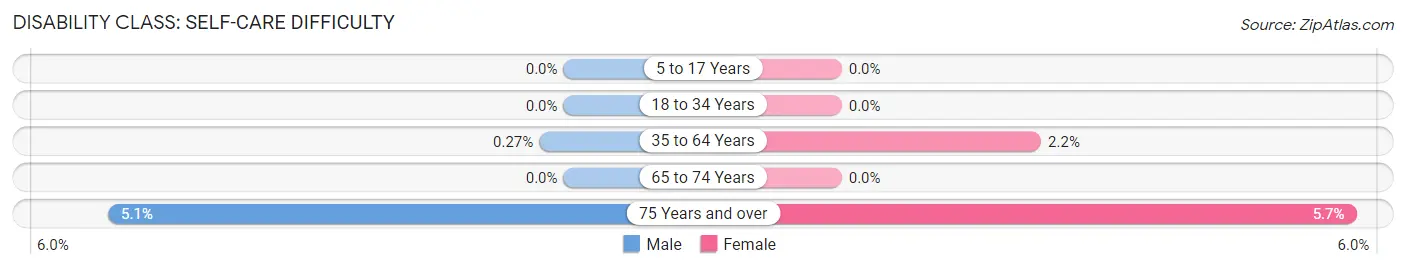
| Age Bracket | Male | Female |
| 5 to 17 Years | 0 (0.0%) | 0 (0.0%) |
| 18 to 34 Years | 0 (0.0%) | 0 (0.0%) |
| 35 to 64 Years | 1 (0.3%) | 10 (2.2%) |
| 65 to 74 Years | 0 (0.0%) | 0 (0.0%) |
| 75 Years and over | 11 (5.1%) | 15 (5.7%) |
Technology Access in Sea Isle City
Computing Device Access in Sea Isle City
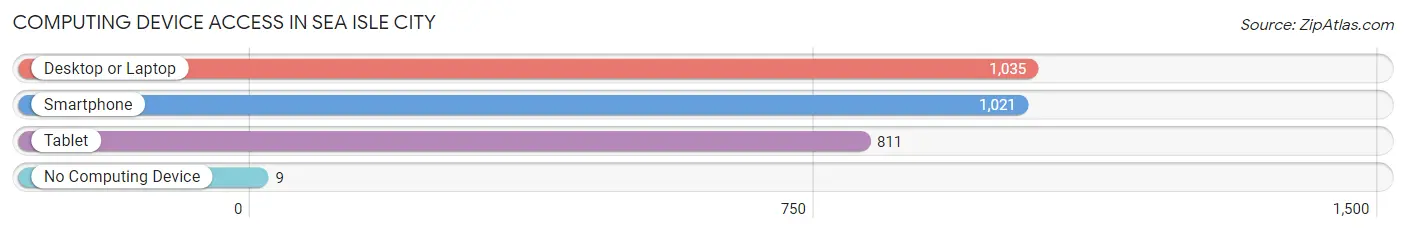
| Device Type | # Households | % Households |
| Desktop or Laptop | 1,035 | 91.8% |
| Smartphone | 1,021 | 90.6% |
| Tablet | 811 | 72.0% |
| No Computing Device | 9 | 0.8% |
| Total | 1,127 | 100.0% |
Internet Access in Sea Isle City
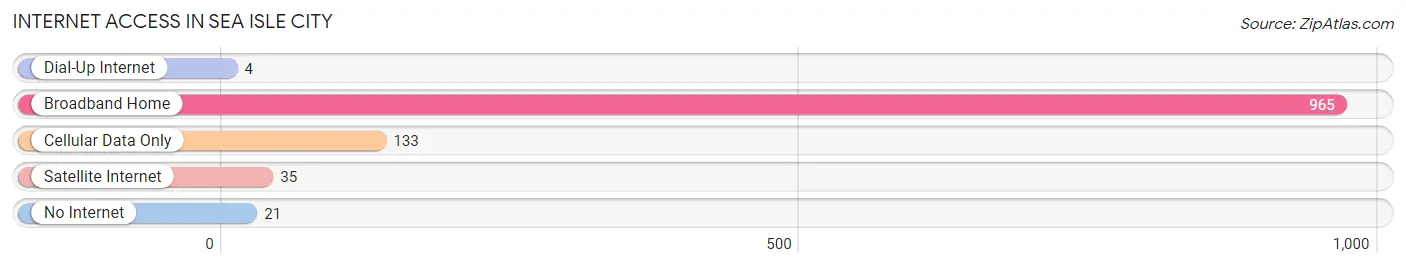
| Internet Type | # Households | % Households |
| Dial-Up Internet | 4 | 0.4% |
| Broadband Home | 965 | 85.6% |
| Cellular Data Only | 133 | 11.8% |
| Satellite Internet | 35 | 3.1% |
| No Internet | 21 | 1.9% |
| Total | 1,127 | 100.0% |
Sea Isle City Summary
Sea Isle City is a small city located in Cape May County, New Jersey. It is situated on the southern tip of the Jersey Shore, approximately 60 miles south of Philadelphia and 90 miles north of Atlantic City. The city is a popular summer destination for tourists and vacationers, and is known for its beaches, boardwalk, and nightlife.
History
Sea Isle City was founded in 1882 by Charles K. Landis, a Philadelphia lawyer and real estate developer. Landis purchased a large tract of land from the estate of John Somers, a local farmer, and began to develop the area into a resort town. He named the town after his daughter, Sea Isle, and began to build a boardwalk, hotels, and other amenities to attract visitors.
In the early 1900s, Sea Isle City became a popular destination for vacationers from Philadelphia and other nearby cities. The town was known for its beaches, boardwalk, and nightlife. In the 1920s, the city was home to several large hotels, including the Sea Isle Hotel, the Hotel La Mer, and the Hotel La Plage.
Geography
Sea Isle City is located in Cape May County, New Jersey, on the southern tip of the Jersey Shore. It is situated on a barrier island, with the Atlantic Ocean to the east and the Great Egg Harbor Bay to the west. The city is approximately 60 miles south of Philadelphia and 90 miles north of Atlantic City.
The city has a total area of 2.3 square miles, all of which is land. The city is bordered by Strathmere to the north, Avalon to the south, and Ocean City to the west.
Economy
The economy of Sea Isle City is largely driven by tourism. The city is a popular summer destination for vacationers and tourists, and is known for its beaches, boardwalk, and nightlife. The city is home to several hotels, restaurants, and other businesses that cater to tourists.
In addition to tourism, Sea Isle City is home to several businesses that provide goods and services to the local community. These include retail stores, banks, medical offices, and other businesses.
Demographics
As of the 2010 census, Sea Isle City had a population of 2,114. The racial makeup of the city was 94.3% White, 2.2% African American, 0.3% Native American, 0.9% Asian, 0.1% Pacific Islander, 0.7% from other races, and 1.5% from two or more races. Hispanic or Latino of any race were 3.2% of the population.
The median household income in Sea Isle City was $50,972, and the median family income was $60,972. The per capita income for the city was $30,972. About 5.3% of families and 7.2% of the population were below the poverty line, including 8.3% of those under age 18 and 4.2% of those age 65 or over.
Common Questions
What is Per Capita Income in Sea Isle City?
Per Capita income in Sea Isle City is $71,268.
What is the Median Family Income in Sea Isle City?
Median Family Income in Sea Isle City is $115,481.
What is the Median Household income in Sea Isle City?
Median Household Income in Sea Isle City is $90,703.
What is Income or Wage Gap in Sea Isle City?
Income or Wage Gap in Sea Isle City is 21.9%.
Women in Sea Isle City earn 78.1 cents for every dollar earned by a man.
What is Inequality or Gini Index in Sea Isle City?
Inequality or Gini Index in Sea Isle City is 0.45.
What is the Total Population of Sea Isle City?
Total Population of Sea Isle City is 2,047.
What is the Total Male Population of Sea Isle City?
Total Male Population of Sea Isle City is 1,015.
What is the Total Female Population of Sea Isle City?
Total Female Population of Sea Isle City is 1,032.
What is the Ratio of Males per 100 Females in Sea Isle City?
There are 98.35 Males per 100 Females in Sea Isle City.
What is the Ratio of Females per 100 Males in Sea Isle City?
There are 101.67 Females per 100 Males in Sea Isle City.
What is the Median Population Age in Sea Isle City?
Median Population Age in Sea Isle City is 65.1 Years.
What is the Average Family Size in Sea Isle City
Average Family Size in Sea Isle City is 2.2 People.
What is the Average Household Size in Sea Isle City
Average Household Size in Sea Isle City is 1.8 People.
How Large is the Labor Force in Sea Isle City?
There are 729 People in the Labor Forcein in Sea Isle City.
What is the Percentage of People in the Labor Force in Sea Isle City?
36.8% of People are in the Labor Force in Sea Isle City.
What is the Unemployment Rate in Sea Isle City?
Unemployment Rate in Sea Isle City is 5.8%.