Waretown, NJ Map & Demographics
Waretown Map
Waretown Overview
$41,061
PER CAPITA INCOME
$99,588
AVG FAMILY INCOME
$101,500
AVG HOUSEHOLD INCOME
20.7%
WAGE / INCOME GAP [ % ]
79.3¢/ $1
WAGE / INCOME GAP [ $ ]
0.33
INEQUALITY / GINI INDEX
2,257
TOTAL POPULATION
1,181
MALE POPULATION
1,076
FEMALE POPULATION
109.76
MALES / 100 FEMALES
91.11
FEMALES / 100 MALES
44.8
MEDIAN AGE
2.7
AVG FAMILY SIZE
2.6
AVG HOUSEHOLD SIZE
1,098
LABOR FORCE [ PEOPLE ]
57.6%
PERCENT IN LABOR FORCE
9.1%
UNEMPLOYMENT RATE
Waretown Zip Codes
Waretown Area Codes
Income in Waretown
Income Overview in Waretown
Per Capita Income in Waretown is $41,061, while median incomes of families and households are $99,588 and $101,500 respectively.
| Characteristic | Number | Measure |
| Per Capita Income | 2,257 | $41,061 |
| Median Family Income | 739 | $99,588 |
| Mean Family Income | 739 | $98,858 |
| Median Household Income | 860 | $101,500 |
| Mean Household Income | 860 | $116,617 |
| Income Deficit | 739 | $0 |
| Wage / Income Gap (%) | 2,257 | 20.69% |
| Wage / Income Gap ($) | 2,257 | 79.31¢ per $1 |
| Gini / Inequality Index | 2,257 | 0.33 |
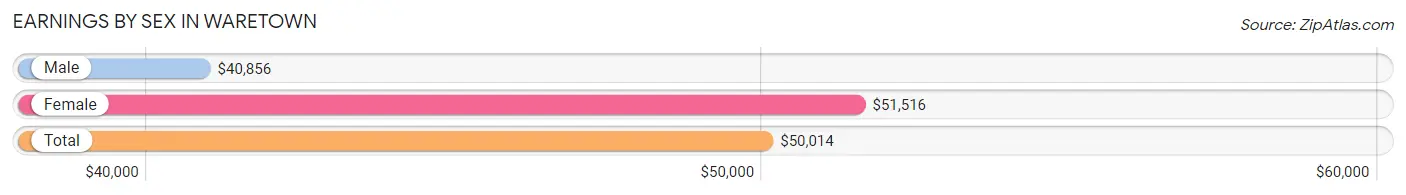
Earnings by Sex in Waretown
Average Earnings in Waretown are $50,014, $40,856 for men and $51,516 for women, a difference of 20.7%.
| Sex | Number | Average Earnings |
| Male | 468 (44.8%) | $40,856 |
| Female | 577 (55.2%) | $51,516 |
| Total | 1,045 (100.0%) | $50,014 |
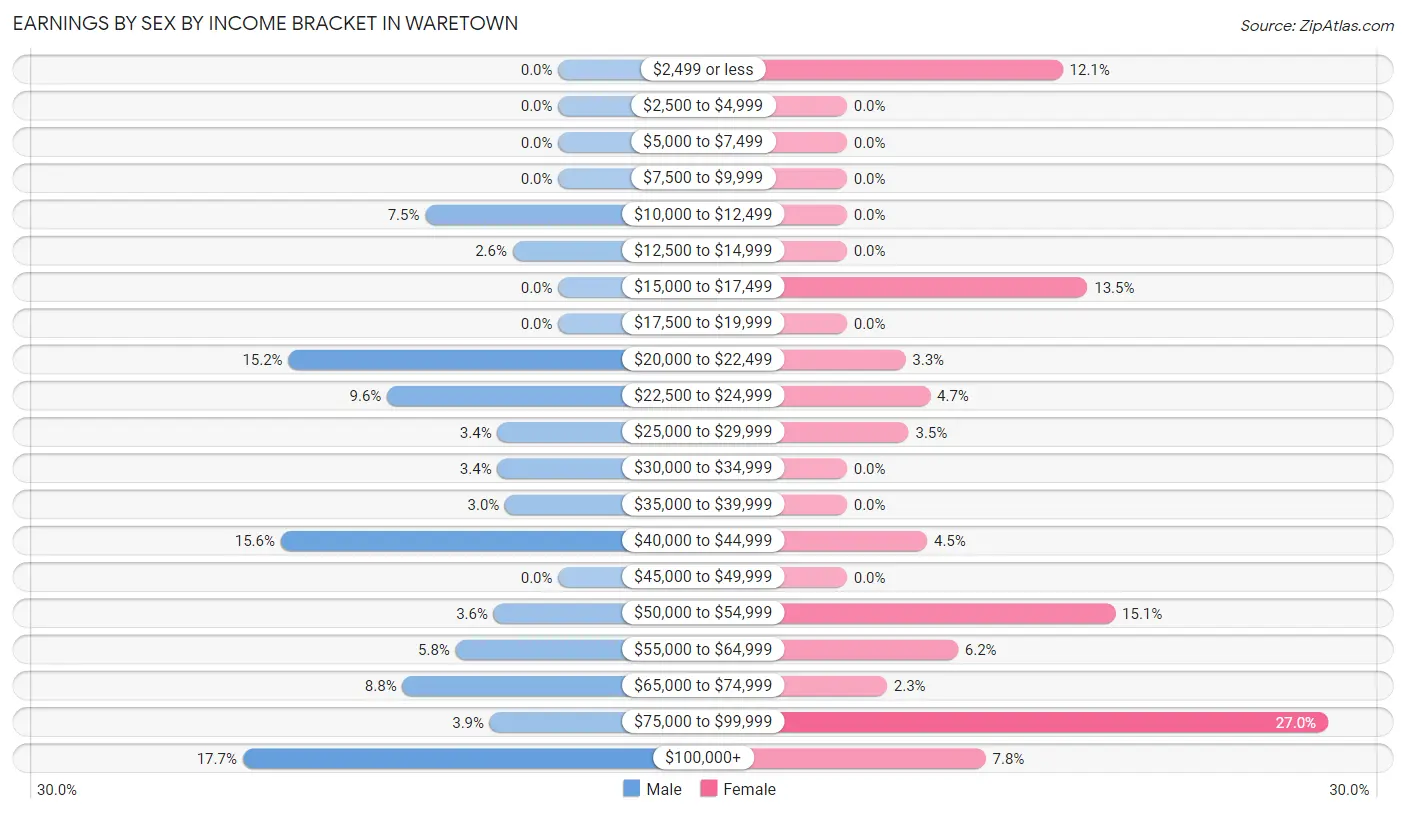
Earnings by Sex by Income Bracket in Waretown
The most common earnings brackets in Waretown are $100,000+ for men (83 | 17.7%) and $75,000 to $99,999 for women (156 | 27.0%).
| Income | Male | Female |
| $2,499 or less | 0 (0.0%) | 70 (12.1%) |
| $2,500 to $4,999 | 0 (0.0%) | 0 (0.0%) |
| $5,000 to $7,499 | 0 (0.0%) | 0 (0.0%) |
| $7,500 to $9,999 | 0 (0.0%) | 0 (0.0%) |
| $10,000 to $12,499 | 35 (7.5%) | 0 (0.0%) |
| $12,500 to $14,999 | 12 (2.6%) | 0 (0.0%) |
| $15,000 to $17,499 | 0 (0.0%) | 78 (13.5%) |
| $17,500 to $19,999 | 0 (0.0%) | 0 (0.0%) |
| $20,000 to $22,499 | 71 (15.2%) | 19 (3.3%) |
| $22,500 to $24,999 | 45 (9.6%) | 27 (4.7%) |
| $25,000 to $29,999 | 16 (3.4%) | 20 (3.5%) |
| $30,000 to $34,999 | 16 (3.4%) | 0 (0.0%) |
| $35,000 to $39,999 | 14 (3.0%) | 0 (0.0%) |
| $40,000 to $44,999 | 73 (15.6%) | 26 (4.5%) |
| $45,000 to $49,999 | 0 (0.0%) | 0 (0.0%) |
| $50,000 to $54,999 | 17 (3.6%) | 87 (15.1%) |
| $55,000 to $64,999 | 27 (5.8%) | 36 (6.2%) |
| $65,000 to $74,999 | 41 (8.8%) | 13 (2.2%) |
| $75,000 to $99,999 | 18 (3.8%) | 156 (27.0%) |
| $100,000+ | 83 (17.7%) | 45 (7.8%) |
| Total | 468 (100.0%) | 577 (100.0%) |
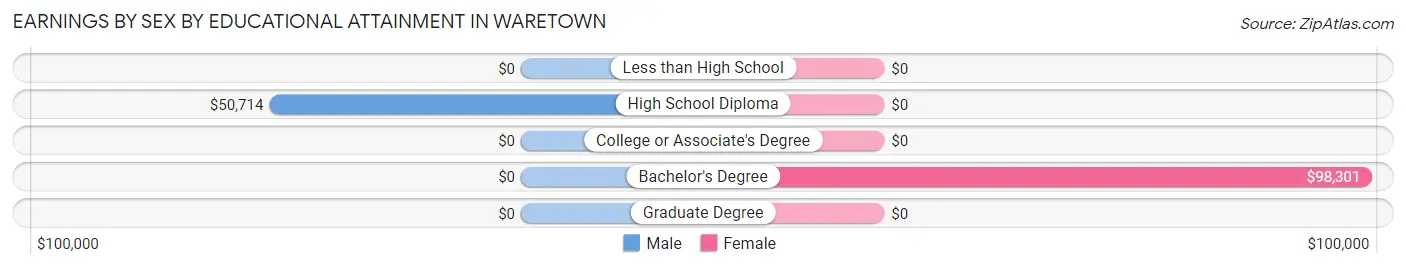
Earnings by Sex by Educational Attainment in Waretown
Average earnings in Waretown are $42,432 for men and $51,516 for women, a difference of 17.6%. Men with an educational attainment of high school diploma enjoy the highest average annual earnings of $50,714, while those with high school diploma education earn the least with $50,714. Women with an educational attainment of bachelor's degree earn the most with the average annual earnings of $98,301, while those with bachelor's degree education have the smallest earnings of $98,301.
| Educational Attainment | Male Income | Female Income |
| Less than High School | - | - |
| High School Diploma | $50,714 | $0 |
| College or Associate's Degree | - | - |
| Bachelor's Degree | - | - |
| Graduate Degree | - | - |
| Total | $42,432 | $51,516 |
Family Income in Waretown
Family Income Brackets in Waretown
According to the Waretown family income data, there are 266 families falling into the $100,000 to $149,999 income range, which is the most common income bracket and makes up 36.0% of all families.
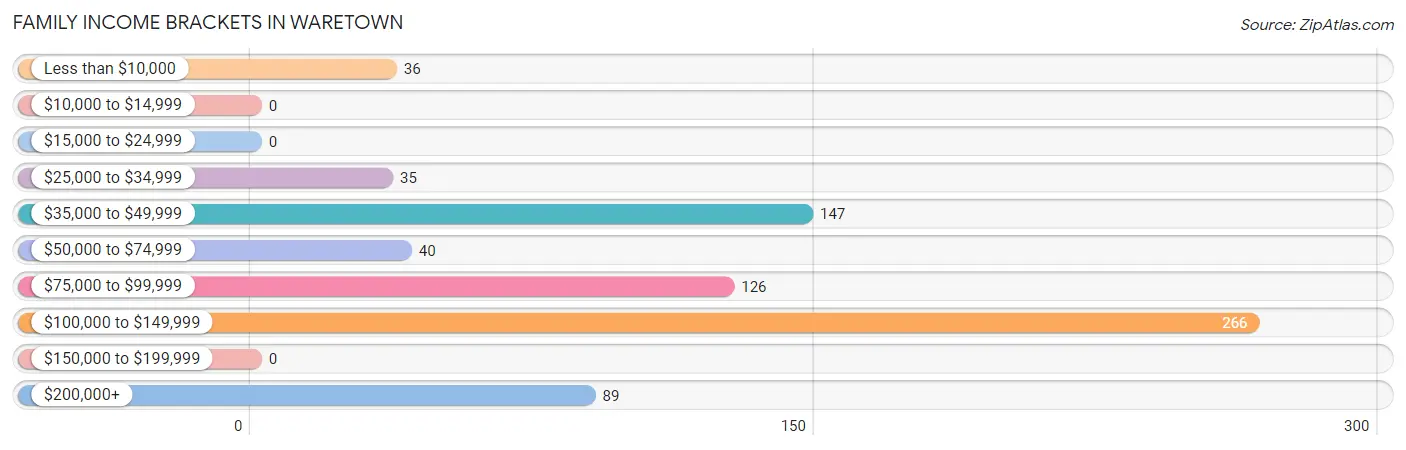
| Income Bracket | # Families | % Families |
| Less than $10,000 | 36 | 4.9% |
| $10,000 to $14,999 | 0 | 0.0% |
| $15,000 to $24,999 | 0 | 0.0% |
| $25,000 to $34,999 | 35 | 4.7% |
| $35,000 to $49,999 | 147 | 19.9% |
| $50,000 to $74,999 | 40 | 5.4% |
| $75,000 to $99,999 | 126 | 17.1% |
| $100,000 to $149,999 | 266 | 36.0% |
| $150,000 to $199,999 | 0 | 0.0% |
| $200,000+ | 89 | 12.0% |
Family Income by Famaliy Size in Waretown
4-person families (169 | 22.9%) account for the highest median family income in Waretown with $101,312 per family, while 2-person families (457 | 61.8%) have the highest median income of $32,634 per family member.
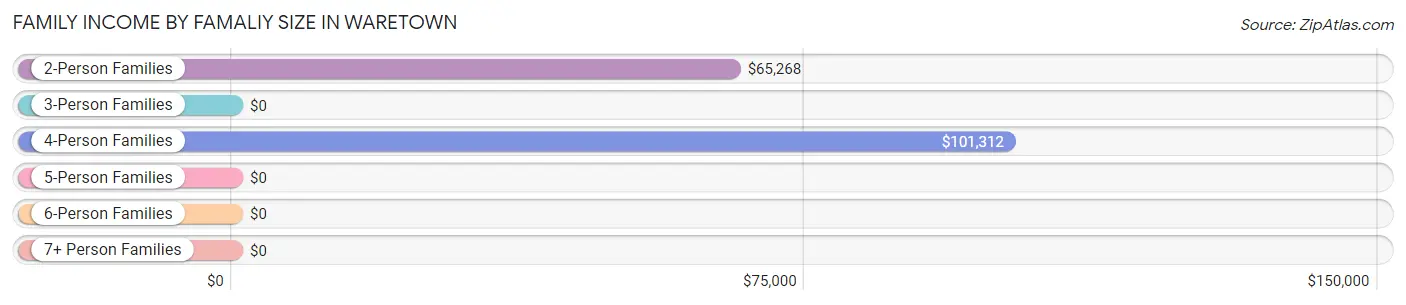
| Income Bracket | # Families | Median Income |
| 2-Person Families | 457 (61.8%) | $65,268 |
| 3-Person Families | 61 (8.3%) | $0 |
| 4-Person Families | 169 (22.9%) | $101,312 |
| 5-Person Families | 52 (7.0%) | $0 |
| 6-Person Families | 0 (0.0%) | $0 |
| 7+ Person Families | 0 (0.0%) | $0 |
| Total | 739 (100.0%) | $99,588 |
Family Income by Number of Earners in Waretown
The median family income in Waretown is $99,588, with families comprising 3+ earners (63) having the highest median family income of $112,813, while families with no earners (151) have the lowest median family income of $58,750, accounting for 8.5% and 20.4% of families, respectively.
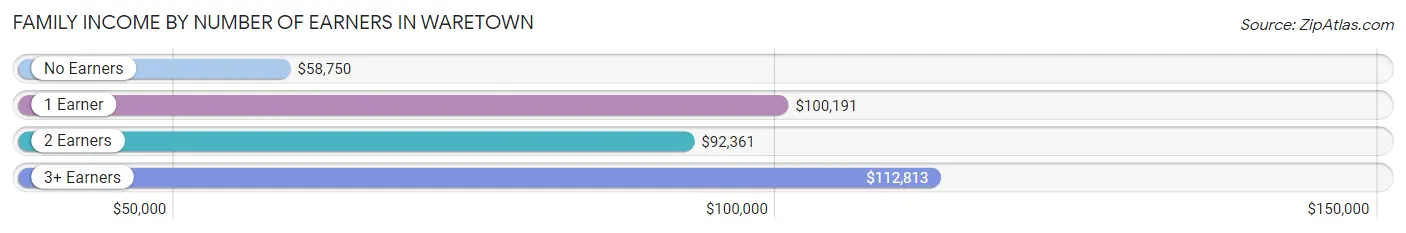
| Number of Earners | # Families | Median Income |
| No Earners | 151 (20.4%) | $58,750 |
| 1 Earner | 410 (55.5%) | $100,191 |
| 2 Earners | 115 (15.6%) | $92,361 |
| 3+ Earners | 63 (8.5%) | $112,813 |
| Total | 739 (100.0%) | $99,588 |
Household Income in Waretown
Household Income Brackets in Waretown
With 177 households falling in the category, the $100,000 to $149,999 income range is the most frequent in Waretown, accounting for 20.6% of all households.
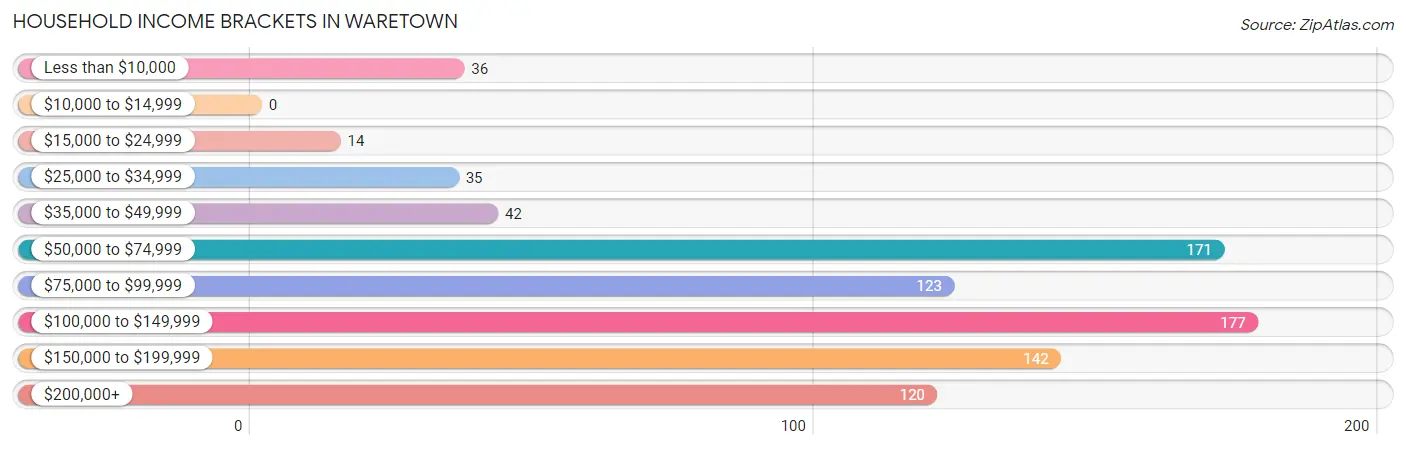
| Income Bracket | # Households | % Households |
| Less than $10,000 | 36 | 4.2% |
| $10,000 to $14,999 | 0 | 0.0% |
| $15,000 to $24,999 | 14 | 1.6% |
| $25,000 to $34,999 | 35 | 4.1% |
| $35,000 to $49,999 | 42 | 4.9% |
| $50,000 to $74,999 | 171 | 19.9% |
| $75,000 to $99,999 | 123 | 14.3% |
| $100,000 to $149,999 | 177 | 20.6% |
| $150,000 to $199,999 | 142 | 16.5% |
| $200,000+ | 120 | 14.0% |
Household Income by Householder Age in Waretown
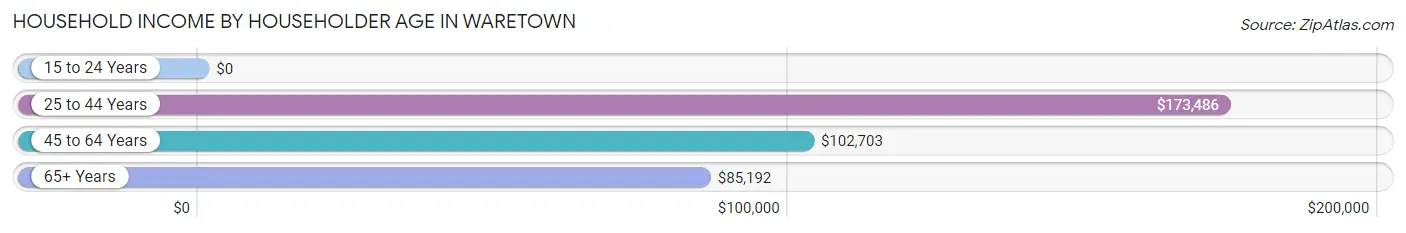
The median household income in Waretown is $101,500, with the highest median household income of $173,486 found in the 25 to 44 years age bracket for the primary householder. A total of 246 households (28.6%) fall into this category.
| Income Bracket | # Households | Median Income |
| 15 to 24 Years | 0 (0.0%) | $0 |
| 25 to 44 Years | 246 (28.6%) | $173,486 |
| 45 to 64 Years | 224 (26.1%) | $102,703 |
| 65+ Years | 390 (45.4%) | $85,192 |
| Total | 860 (100.0%) | $101,500 |
Poverty in Waretown
Income Below Poverty by Sex and Age in Waretown
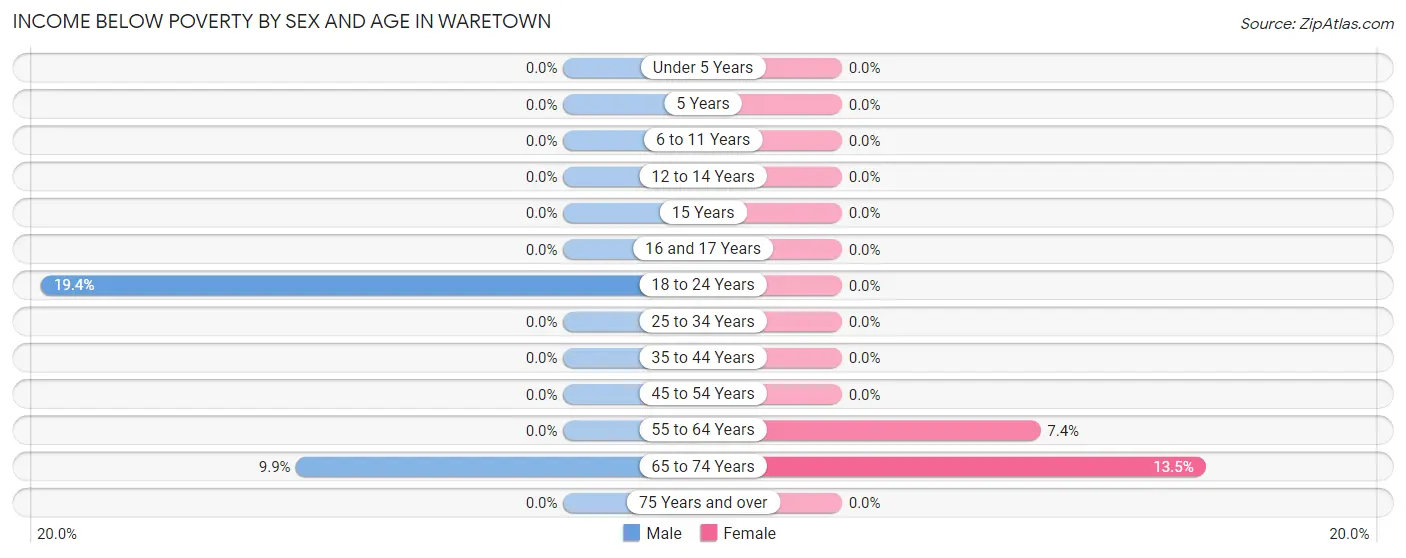
With 3.6% poverty level for males and 3.4% for females among the residents of Waretown, 18 to 24 year old males and 65 to 74 year old females are the most vulnerable to poverty, with 19 males (19.4%) and 22 females (13.5%) in their respective age groups living below the poverty level.
| Age Bracket | Male | Female |
| Under 5 Years | 0 (0.0%) | 0 (0.0%) |
| 5 Years | 0 (0.0%) | 0 (0.0%) |
| 6 to 11 Years | 0 (0.0%) | 0 (0.0%) |
| 12 to 14 Years | 0 (0.0%) | 0 (0.0%) |
| 15 Years | 0 (0.0%) | 0 (0.0%) |
| 16 and 17 Years | 0 (0.0%) | 0 (0.0%) |
| 18 to 24 Years | 19 (19.4%) | 0 (0.0%) |
| 25 to 34 Years | 0 (0.0%) | 0 (0.0%) |
| 35 to 44 Years | 0 (0.0%) | 0 (0.0%) |
| 45 to 54 Years | 0 (0.0%) | 0 (0.0%) |
| 55 to 64 Years | 0 (0.0%) | 14 (7.4%) |
| 65 to 74 Years | 23 (9.9%) | 22 (13.5%) |
| 75 Years and over | 0 (0.0%) | 0 (0.0%) |
| Total | 42 (3.6%) | 36 (3.4%) |
Income Above Poverty by Sex and Age in Waretown
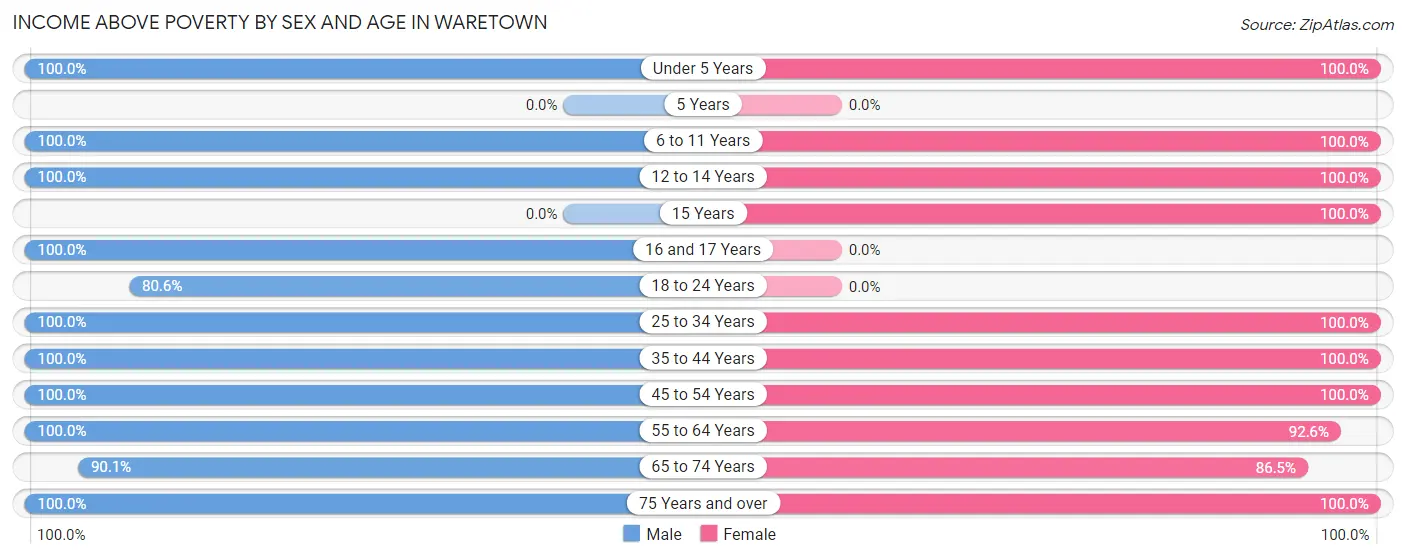
According to the poverty statistics in Waretown, males aged under 5 years and females aged under 5 years are the age groups that are most secure financially, with 100.0% of males and 100.0% of females in these age groups living above the poverty line.
| Age Bracket | Male | Female |
| Under 5 Years | 17 (100.0%) | 17 (100.0%) |
| 5 Years | 0 (0.0%) | 0 (0.0%) |
| 6 to 11 Years | 34 (100.0%) | 63 (100.0%) |
| 12 to 14 Years | 67 (100.0%) | 34 (100.0%) |
| 15 Years | 0 (0.0%) | 119 (100.0%) |
| 16 and 17 Years | 206 (100.0%) | 0 (0.0%) |
| 18 to 24 Years | 79 (80.6%) | 0 (0.0%) |
| 25 to 34 Years | 73 (100.0%) | 61 (100.0%) |
| 35 to 44 Years | 148 (100.0%) | 195 (100.0%) |
| 45 to 54 Years | 93 (100.0%) | 141 (100.0%) |
| 55 to 64 Years | 91 (100.0%) | 176 (92.6%) |
| 65 to 74 Years | 209 (90.1%) | 141 (86.5%) |
| 75 Years and over | 122 (100.0%) | 93 (100.0%) |
| Total | 1,139 (96.4%) | 1,040 (96.7%) |
Income Below Poverty Among Married-Couple Families in Waretown
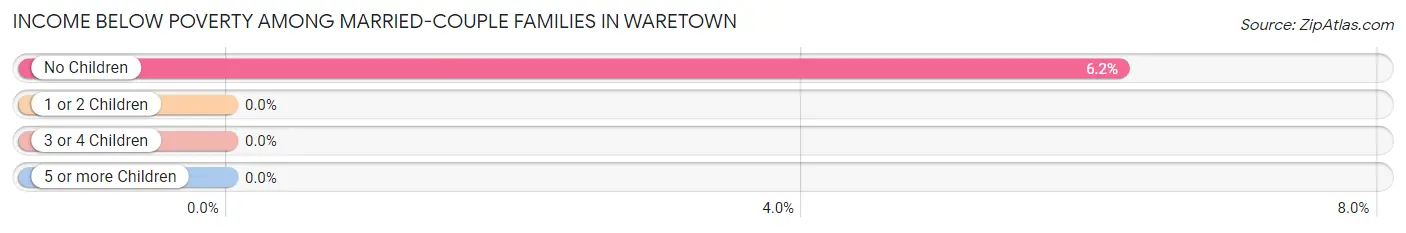
The poverty statistics for married-couple families in Waretown show that 5.4% or 22 of the total 406 families live below the poverty line. Families with no children have the highest poverty rate of 6.2%, comprising of 22 families. On the other hand, families with 1 or 2 children have the lowest poverty rate of 0.0%, which includes 0 families.
| Children | Above Poverty | Below Poverty |
| No Children | 332 (93.8%) | 22 (6.2%) |
| 1 or 2 Children | 16 (100.0%) | 0 (0.0%) |
| 3 or 4 Children | 36 (100.0%) | 0 (0.0%) |
| 5 or more Children | 0 (0.0%) | 0 (0.0%) |
| Total | 384 (94.6%) | 22 (5.4%) |
Income Below Poverty Among Single-Parent Households in Waretown
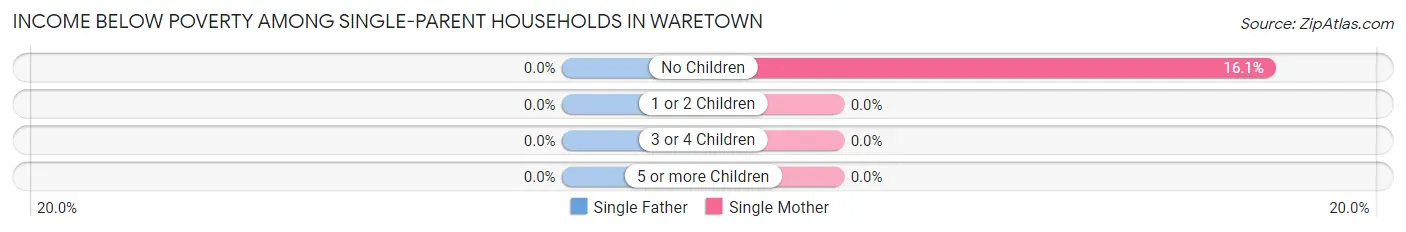
| Children | Single Father | Single Mother |
| No Children | 0 (0.0%) | 14 (16.1%) |
| 1 or 2 Children | 0 (0.0%) | 0 (0.0%) |
| 3 or 4 Children | 0 (0.0%) | 0 (0.0%) |
| 5 or more Children | 0 (0.0%) | 0 (0.0%) |
| Total | 0 (0.0%) | 14 (6.1%) |
Income Below Poverty Among Married-Couple vs Single-Parent Households in Waretown
The poverty data for Waretown shows that 22 of the married-couple family households (5.4%) and 14 of the single-parent households (4.2%) are living below the poverty level. Within the married-couple family households, those with no children have the highest poverty rate, with 22 households (6.2%) falling below the poverty line. Among the single-parent households, those with no children have the highest poverty rate, with 14 household (9.1%) living below poverty.
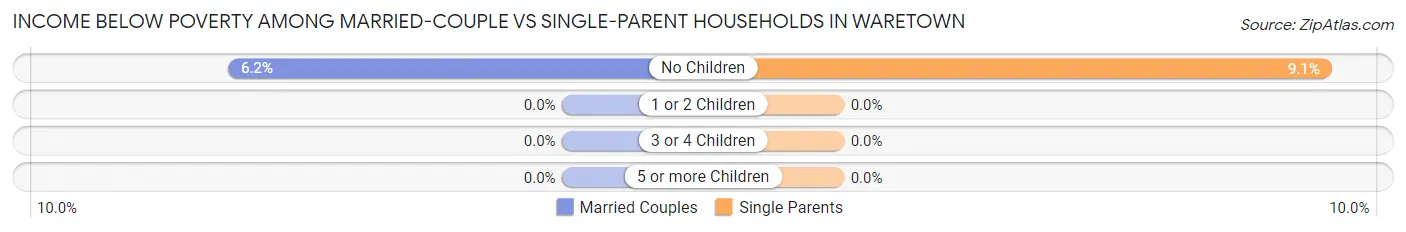
| Children | Married-Couple Families | Single-Parent Households |
| No Children | 22 (6.2%) | 14 (9.1%) |
| 1 or 2 Children | 0 (0.0%) | 0 (0.0%) |
| 3 or 4 Children | 0 (0.0%) | 0 (0.0%) |
| 5 or more Children | 0 (0.0%) | 0 (0.0%) |
| Total | 22 (5.4%) | 14 (4.2%) |
Race in Waretown
The most populous races in Waretown are White / Caucasian (2,140 | 94.8%), Two or more Races (104 | 4.6%), and Hispanic or Latino (92 | 4.1%).
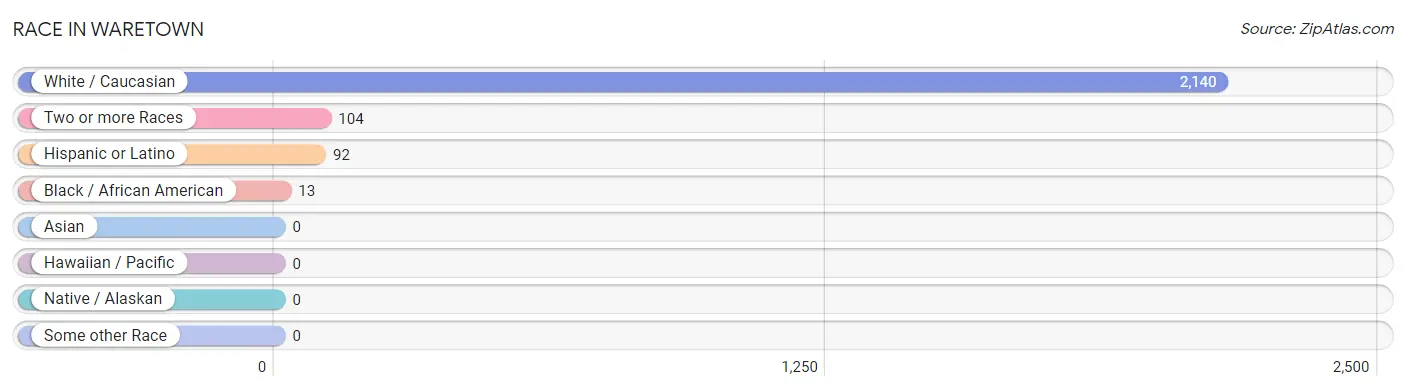
| Race | # Population | % Population |
| Asian | 0 | 0.0% |
| Black / African American | 13 | 0.6% |
| Hawaiian / Pacific | 0 | 0.0% |
| Hispanic or Latino | 92 | 4.1% |
| Native / Alaskan | 0 | 0.0% |
| White / Caucasian | 2,140 | 94.8% |
| Two or more Races | 104 | 4.6% |
| Some other Race | 0 | 0.0% |
| Total | 2,257 | 100.0% |
Ancestry in Waretown
The most populous ancestries reported in Waretown are German (531 | 23.5%), Italian (472 | 20.9%), Irish (374 | 16.6%), English (208 | 9.2%), and Polish (131 | 5.8%), together accounting for 76.0% of all Waretown residents.
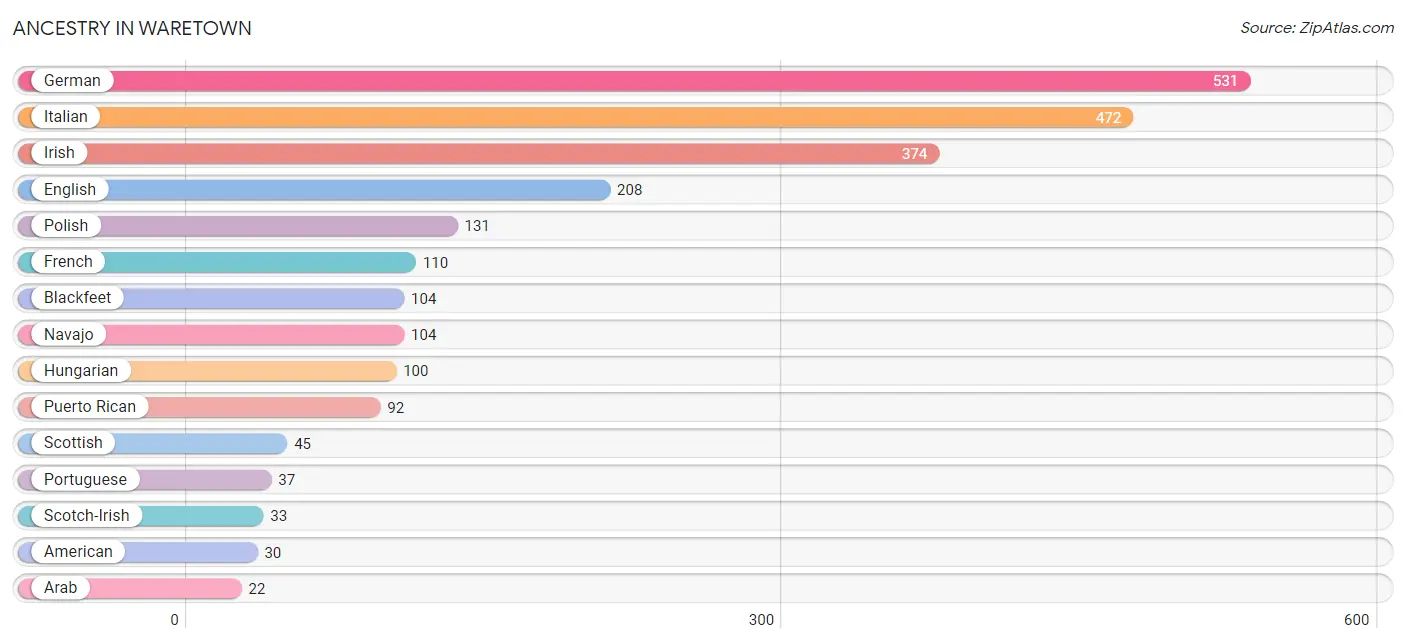
| Ancestry | # Population | % Population |
| American | 30 | 1.3% |
| Arab | 22 | 1.0% |
| Blackfeet | 104 | 4.6% |
| Dutch | 16 | 0.7% |
| English | 208 | 9.2% |
| European | 16 | 0.7% |
| French | 110 | 4.9% |
| German | 531 | 23.5% |
| Hungarian | 100 | 4.4% |
| Irish | 374 | 16.6% |
| Italian | 472 | 20.9% |
| Lithuanian | 6 | 0.3% |
| Navajo | 104 | 4.6% |
| Norwegian | 14 | 0.6% |
| Polish | 131 | 5.8% |
| Portuguese | 37 | 1.6% |
| Puerto Rican | 92 | 4.1% |
| Russian | 13 | 0.6% |
| Scotch-Irish | 33 | 1.5% |
| Scottish | 45 | 2.0% |
| Swedish | 16 | 0.7% |
| Syrian | 22 | 1.0% | View All 22 Rows |
Immigrants in Waretown
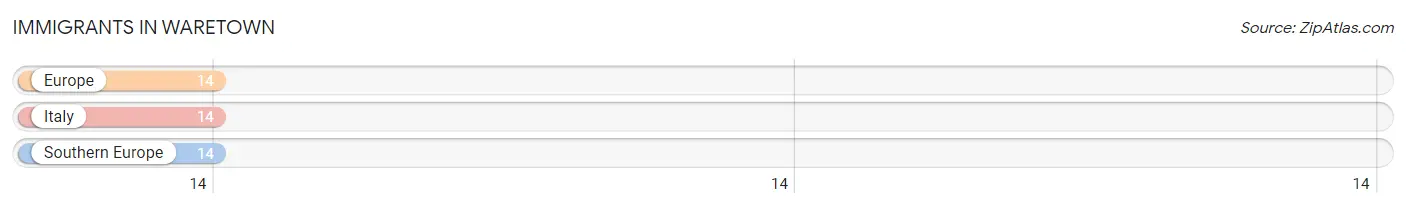
The most numerous immigrant groups reported in Waretown came from Europe (14 | 0.6%), Italy (14 | 0.6%), and Southern Europe (14 | 0.6%), together accounting for 1.9% of all Waretown residents.
| Immigration Origin | # Population | % Population |
| Europe | 14 | 0.6% |
| Italy | 14 | 0.6% |
| Southern Europe | 14 | 0.6% | View All 3 Rows |
Sex and Age in Waretown
Sex and Age in Waretown
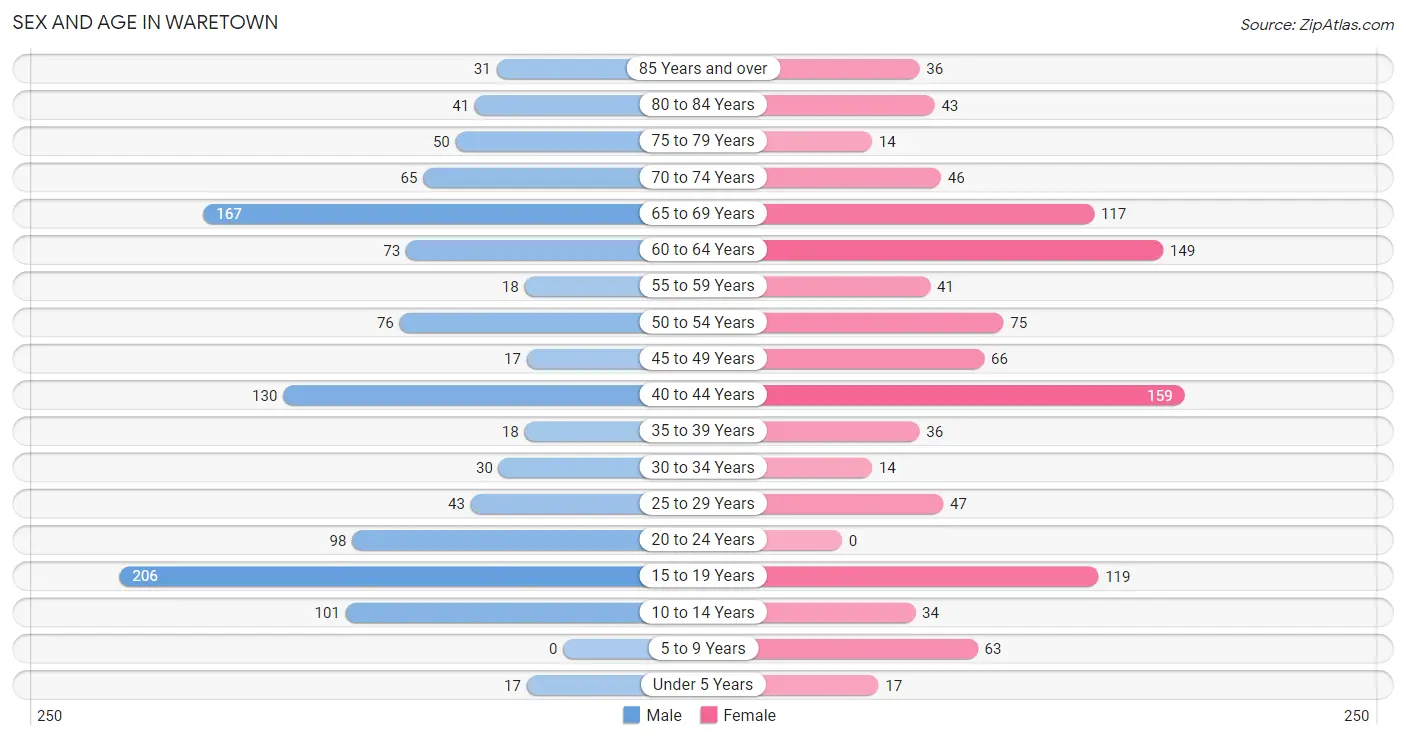
The most populous age groups in Waretown are 15 to 19 Years (206 | 17.4%) for men and 40 to 44 Years (159 | 14.8%) for women.
| Age Bracket | Male | Female |
| Under 5 Years | 17 (1.4%) | 17 (1.6%) |
| 5 to 9 Years | 0 (0.0%) | 63 (5.9%) |
| 10 to 14 Years | 101 (8.6%) | 34 (3.2%) |
| 15 to 19 Years | 206 (17.4%) | 119 (11.1%) |
| 20 to 24 Years | 98 (8.3%) | 0 (0.0%) |
| 25 to 29 Years | 43 (3.6%) | 47 (4.4%) |
| 30 to 34 Years | 30 (2.5%) | 14 (1.3%) |
| 35 to 39 Years | 18 (1.5%) | 36 (3.4%) |
| 40 to 44 Years | 130 (11.0%) | 159 (14.8%) |
| 45 to 49 Years | 17 (1.4%) | 66 (6.1%) |
| 50 to 54 Years | 76 (6.4%) | 75 (7.0%) |
| 55 to 59 Years | 18 (1.5%) | 41 (3.8%) |
| 60 to 64 Years | 73 (6.2%) | 149 (13.9%) |
| 65 to 69 Years | 167 (14.1%) | 117 (10.9%) |
| 70 to 74 Years | 65 (5.5%) | 46 (4.3%) |
| 75 to 79 Years | 50 (4.2%) | 14 (1.3%) |
| 80 to 84 Years | 41 (3.5%) | 43 (4.0%) |
| 85 Years and over | 31 (2.6%) | 36 (3.4%) |
| Total | 1,181 (100.0%) | 1,076 (100.0%) |
Families and Households in Waretown
Median Family Size in Waretown
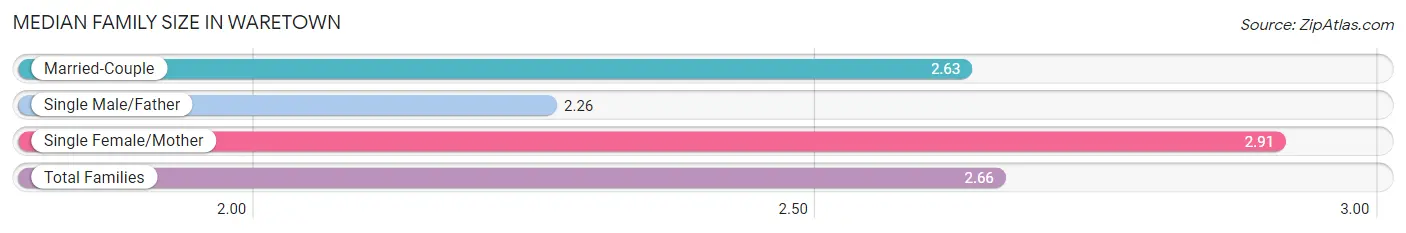
The median family size in Waretown is 2.66 persons per family, with single female/mother families (229 | 31.0%) accounting for the largest median family size of 2.91 persons per family. On the other hand, single male/father families (104 | 14.1%) represent the smallest median family size with 2.26 persons per family.
| Family Type | # Families | Family Size |
| Married-Couple | 406 (54.9%) | 2.63 |
| Single Male/Father | 104 (14.1%) | 2.26 |
| Single Female/Mother | 229 (31.0%) | 2.91 |
| Total Families | 739 (100.0%) | 2.66 |
Median Household Size in Waretown
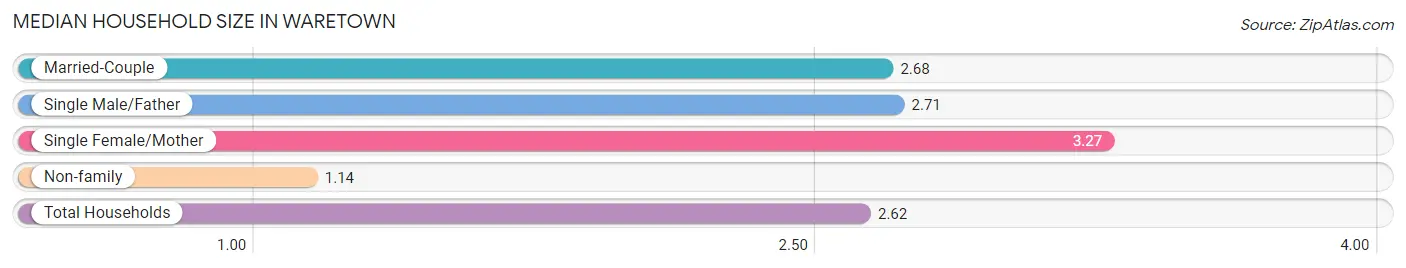
The median household size in Waretown is 2.62 persons per household, with single female/mother households (229 | 26.6%) accounting for the largest median household size of 3.27 persons per household. non-family households (121 | 14.1%) represent the smallest median household size with 1.14 persons per household.
| Household Type | # Households | Household Size |
| Married-Couple | 406 (47.2%) | 2.68 |
| Single Male/Father | 104 (12.1%) | 2.71 |
| Single Female/Mother | 229 (26.6%) | 3.27 |
| Non-family | 121 (14.1%) | 1.14 |
| Total Households | 860 (100.0%) | 2.62 |
Household Size by Marriage Status in Waretown
Out of a total of 860 households in Waretown, 739 (85.9%) are family households, while 121 (14.1%) are nonfamily households. The most numerous type of family households are 2-person households, comprising 352, and the most common type of nonfamily households are 1-person households, comprising 104.
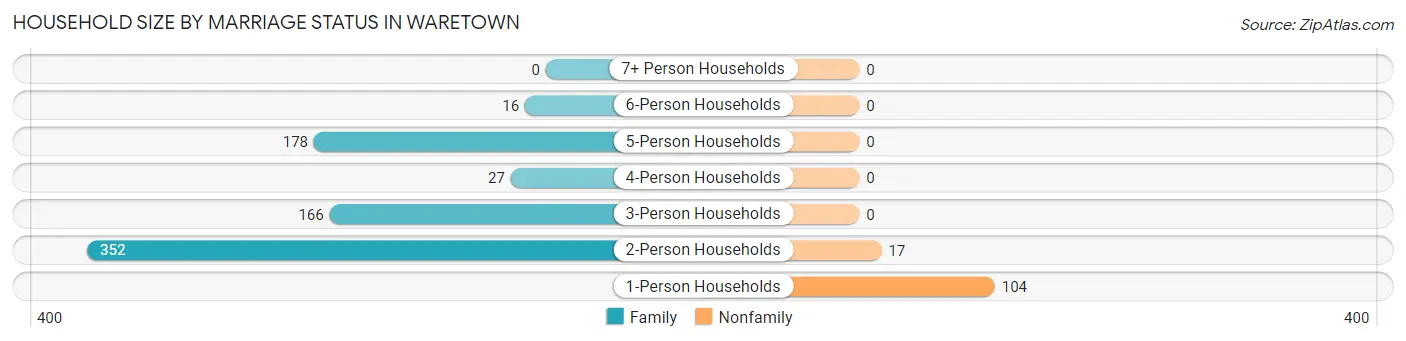
| Household Size | Family Households | Nonfamily Households |
| 1-Person Households | - | 104 (12.1%) |
| 2-Person Households | 352 (40.9%) | 17 (2.0%) |
| 3-Person Households | 166 (19.3%) | 0 (0.0%) |
| 4-Person Households | 27 (3.1%) | 0 (0.0%) |
| 5-Person Households | 178 (20.7%) | 0 (0.0%) |
| 6-Person Households | 16 (1.9%) | 0 (0.0%) |
| 7+ Person Households | 0 (0.0%) | 0 (0.0%) |
| Total | 739 (85.9%) | 121 (14.1%) |
Female Fertility in Waretown
Fertility by Age in Waretown
Average fertility rate in Waretown is 39.0 births per 1,000 women. Women in the age bracket of 20 to 34 years have the highest fertility rate with 311.0 births per 1,000 women. Women in the age bracket of 20 to 34 years acount for 100.0% of all women with births.
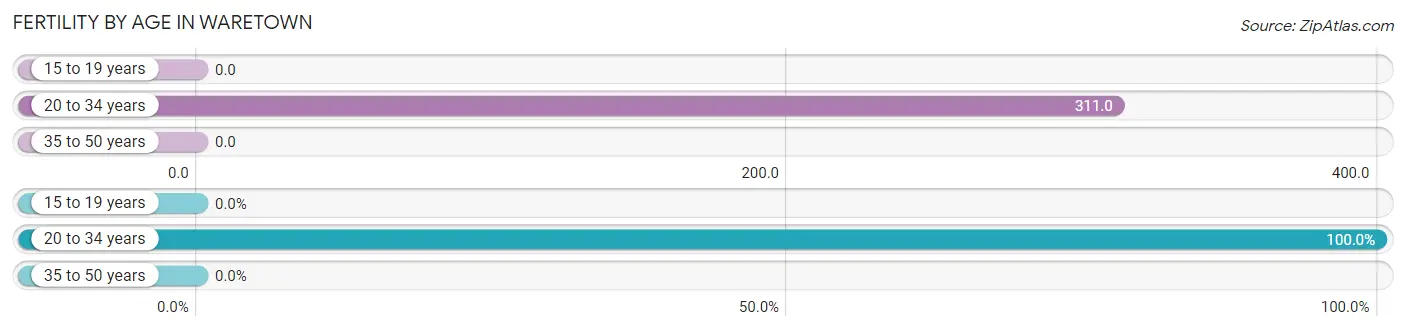
| Age Bracket | Women with Births | Births / 1,000 Women |
| 15 to 19 years | 0 (0.0%) | 0.0 |
| 20 to 34 years | 19 (100.0%) | 311.0 |
| 35 to 50 years | 0 (0.0%) | 0.0 |
| Total | 19 (100.0%) | 39.0 |
Fertility by Age by Marriage Status in Waretown
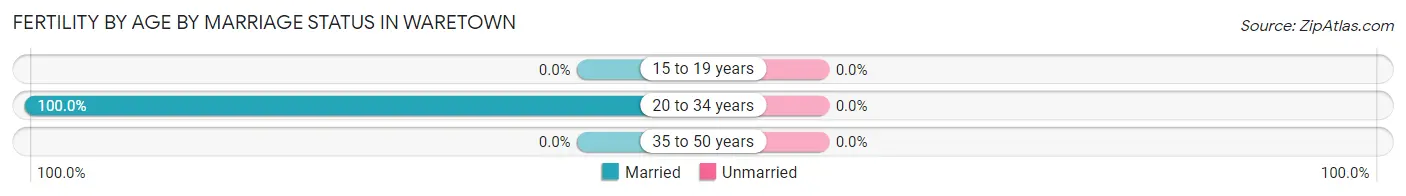
| Age Bracket | Married | Unmarried |
| 15 to 19 years | 0 (0.0%) | 0 (0.0%) |
| 20 to 34 years | 19 (100.0%) | 0 (0.0%) |
| 35 to 50 years | 0 (0.0%) | 0 (0.0%) |
| Total | 19 (100.0%) | 0 (0.0%) |
Fertility by Education in Waretown
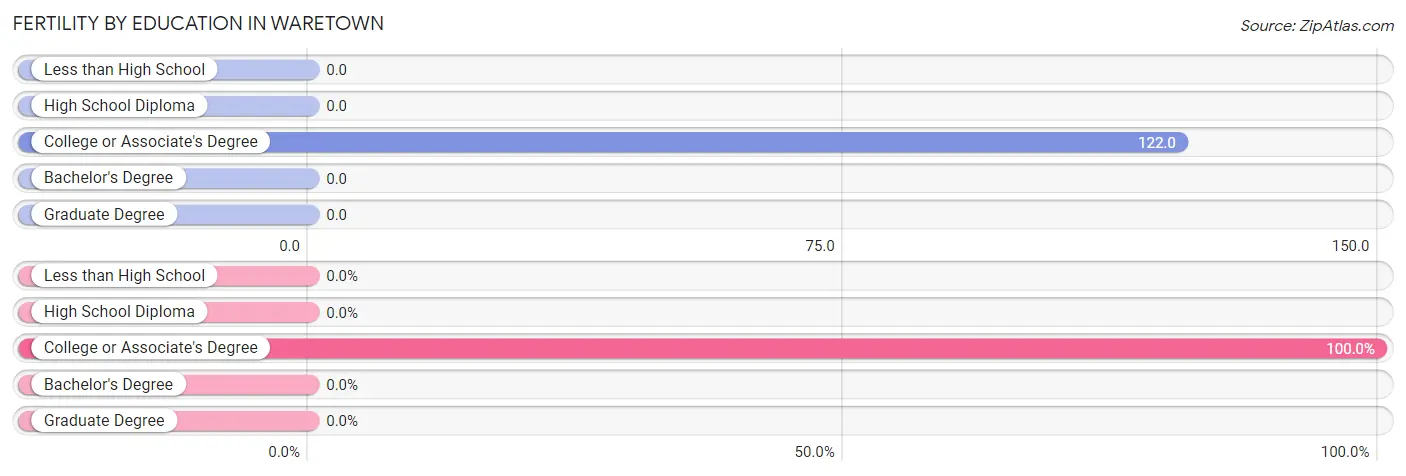
| Educational Attainment | Women with Births | Births / 1,000 Women |
| Less than High School | 0 (0.0%) | 0.0 |
| High School Diploma | 0 (0.0%) | 0.0 |
| College or Associate's Degree | 19 (100.0%) | 122.0 |
| Bachelor's Degree | 0 (0.0%) | 0.0 |
| Graduate Degree | 0 (0.0%) | 0.0 |
| Total | 19 (100.0%) | 39.0 |
Fertility by Education by Marriage Status in Waretown
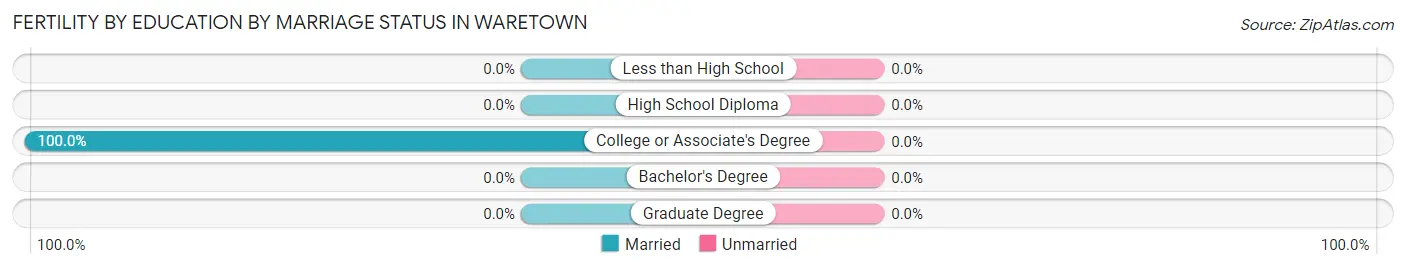
| Educational Attainment | Married | Unmarried |
| Less than High School | 0 (0.0%) | 0 (0.0%) |
| High School Diploma | 0 (0.0%) | 0 (0.0%) |
| College or Associate's Degree | 19 (100.0%) | 0 (0.0%) |
| Bachelor's Degree | 0 (0.0%) | 0 (0.0%) |
| Graduate Degree | 0 (0.0%) | 0 (0.0%) |
| Total | 19 (100.0%) | 0 (0.0%) |
Employment Characteristics in Waretown
Employment by Class of Employer in Waretown
Among the 856 employed individuals in Waretown, private company employees (497 | 58.1%), local government employees (168 | 19.6%), and self-employed (not incorporated) (84 | 9.8%) make up the most common classes of employment.
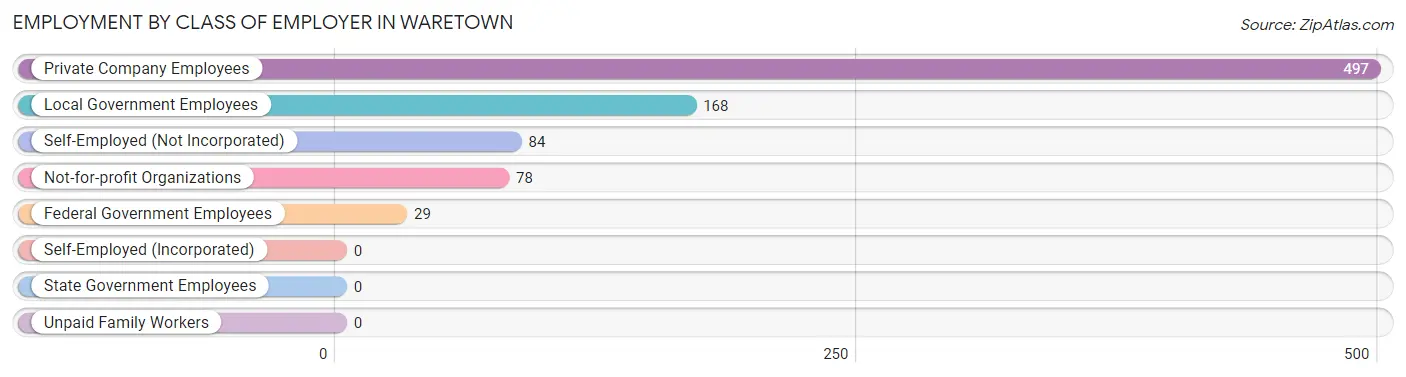
| Employer Class | # Employees | % Employees |
| Private Company Employees | 497 | 58.1% |
| Self-Employed (Incorporated) | 0 | 0.0% |
| Self-Employed (Not Incorporated) | 84 | 9.8% |
| Not-for-profit Organizations | 78 | 9.1% |
| Local Government Employees | 168 | 19.6% |
| State Government Employees | 0 | 0.0% |
| Federal Government Employees | 29 | 3.4% |
| Unpaid Family Workers | 0 | 0.0% |
| Total | 856 | 100.0% |
Employment Status by Age in Waretown
According to the labor force statistics for Waretown, out of the total population over 16 years of age (1,906), 57.6% or 1,098 individuals are in the labor force, with 9.1% or 100 of them unemployed. The age group with the highest labor force participation rate is 35 to 44 years, with 100.0% or 343 individuals in the labor force. Within the labor force, the 55 to 59 years age range has the highest percentage of unemployed individuals, with 28.6% or 14 of them being unemployed.
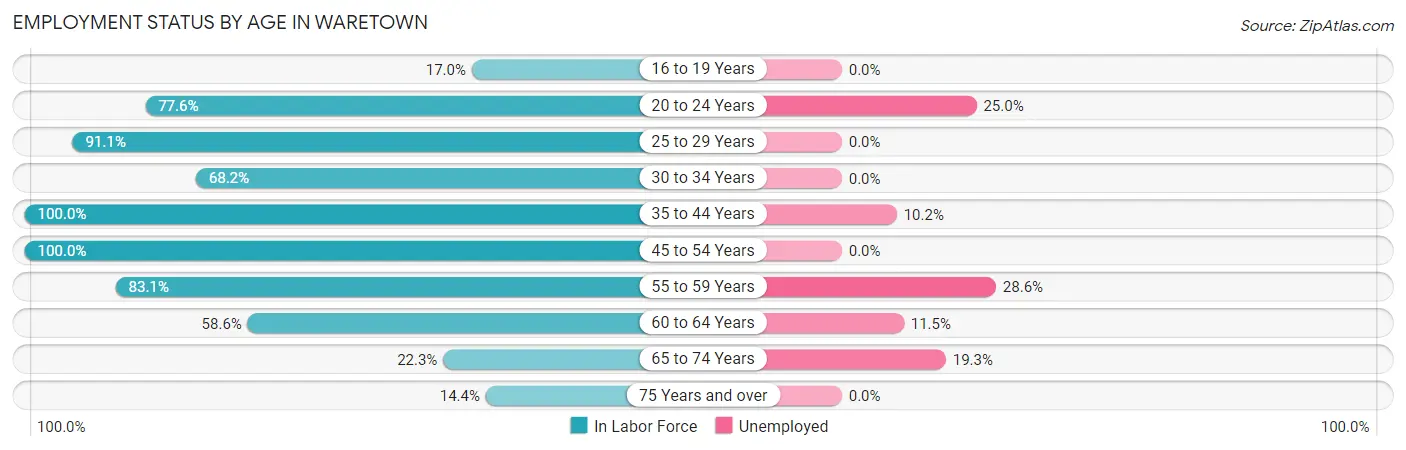
| Age Bracket | In Labor Force | Unemployed |
| 16 to 19 Years | 35 (17.0%) | 0 (0.0%) |
| 20 to 24 Years | 76 (77.6%) | 19 (25.0%) |
| 25 to 29 Years | 82 (91.1%) | 0 (0.0%) |
| 30 to 34 Years | 30 (68.2%) | 0 (0.0%) |
| 35 to 44 Years | 343 (100.0%) | 35 (10.2%) |
| 45 to 54 Years | 234 (100.0%) | 0 (0.0%) |
| 55 to 59 Years | 49 (83.1%) | 14 (28.6%) |
| 60 to 64 Years | 130 (58.6%) | 15 (11.5%) |
| 65 to 74 Years | 88 (22.3%) | 17 (19.3%) |
| 75 Years and over | 31 (14.4%) | 0 (0.0%) |
| Total | 1,098 (57.6%) | 100 (9.1%) |
Employment Status by Educational Attainment in Waretown
According to labor force statistics for Waretown, 87.5% of individuals (868) out of the total population between 25 and 64 years of age (992) are in the labor force, with 7.4% or 64 of them being unemployed. The group with the highest labor force participation rate are those with the educational attainment of less than high school, with 100.0% or 31 individuals in the labor force. Within the labor force, individuals with high school diploma education have the highest percentage of unemployment, with 11.8% or 33 of them being unemployed.
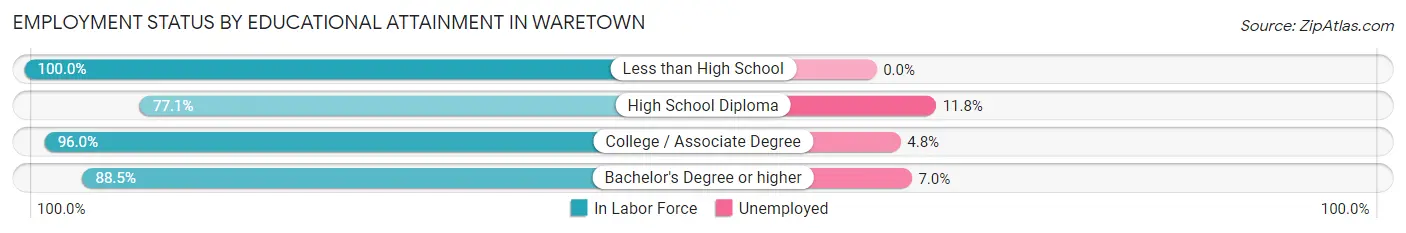
| Educational Attainment | In Labor Force | Unemployed |
| Less than High School | 31 (100.0%) | 0 (0.0%) |
| High School Diploma | 280 (77.1%) | 43 (11.8%) |
| College / Associate Degree | 356 (96.0%) | 18 (4.8%) |
| Bachelor's Degree or higher | 201 (88.5%) | 16 (7.0%) |
| Total | 868 (87.5%) | 73 (7.4%) |
Employment Occupations by Sex in Waretown
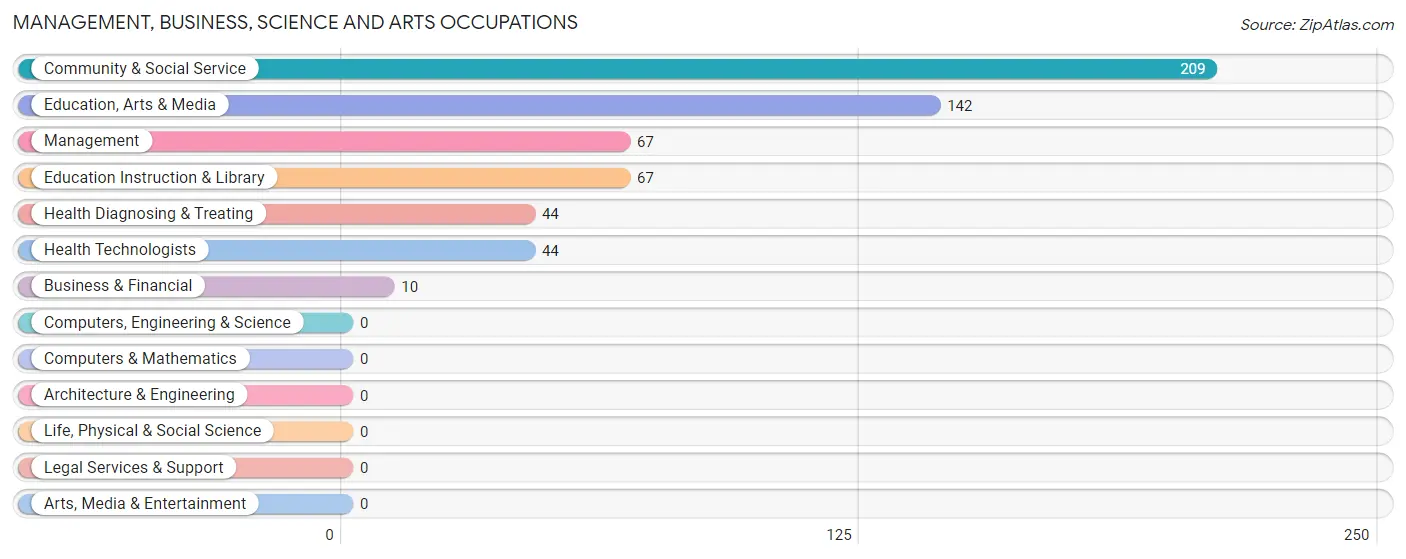
Management, Business, Science and Arts Occupations
The most common Management, Business, Science and Arts occupations in Waretown are Community & Social Service (209 | 20.9%), Education, Arts & Media (142 | 14.2%), Management (67 | 6.7%), Education Instruction & Library (67 | 6.7%), and Health Diagnosing & Treating (44 | 4.4%).
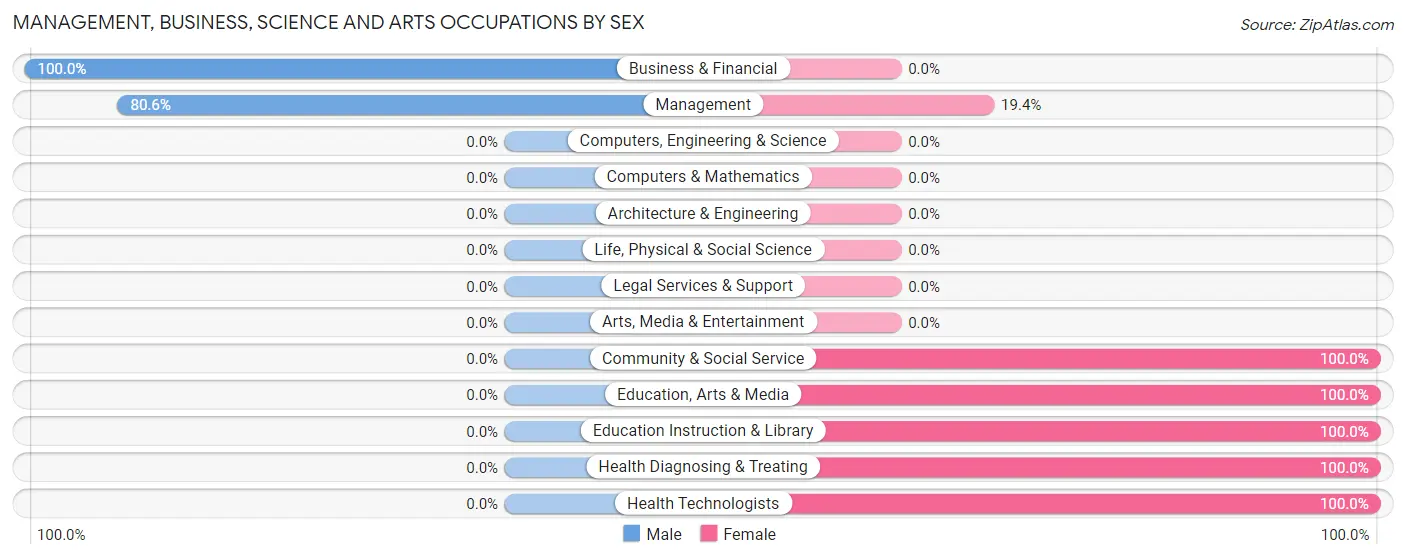
Management, Business, Science and Arts Occupations by Sex
Within the Management, Business, Science and Arts occupations in Waretown, the most male-oriented occupations are Business & Financial (100.0%), and Management (80.6%), while the most female-oriented occupations are Community & Social Service (100.0%), Education, Arts & Media (100.0%), and Education Instruction & Library (100.0%).
| Occupation | Male | Female |
| Management | 54 (80.6%) | 13 (19.4%) |
| Business & Financial | 10 (100.0%) | 0 (0.0%) |
| Computers, Engineering & Science | 0 (0.0%) | 0 (0.0%) |
| Computers & Mathematics | 0 (0.0%) | 0 (0.0%) |
| Architecture & Engineering | 0 (0.0%) | 0 (0.0%) |
| Life, Physical & Social Science | 0 (0.0%) | 0 (0.0%) |
| Community & Social Service | 0 (0.0%) | 209 (100.0%) |
| Education, Arts & Media | 0 (0.0%) | 142 (100.0%) |
| Legal Services & Support | 0 (0.0%) | 0 (0.0%) |
| Education Instruction & Library | 0 (0.0%) | 67 (100.0%) |
| Arts, Media & Entertainment | 0 (0.0%) | 0 (0.0%) |
| Health Diagnosing & Treating | 0 (0.0%) | 44 (100.0%) |
| Health Technologists | 0 (0.0%) | 44 (100.0%) |
| Total (Category) | 64 (19.4%) | 266 (80.6%) |
| Total (Overall) | 452 (45.3%) | 546 (54.7%) |
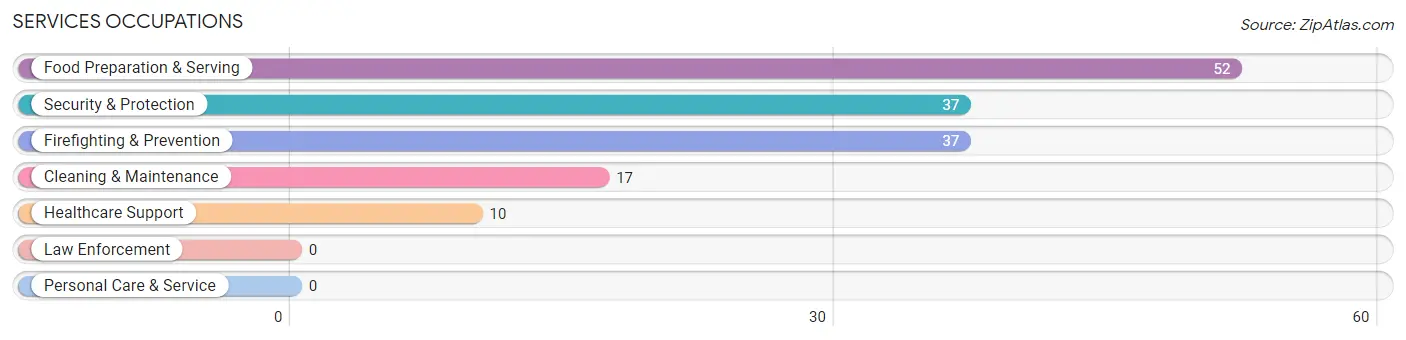
Services Occupations
The most common Services occupations in Waretown are Food Preparation & Serving (52 | 5.2%), Security & Protection (37 | 3.7%), Firefighting & Prevention (37 | 3.7%), Cleaning & Maintenance (17 | 1.7%), and Healthcare Support (10 | 1.0%).
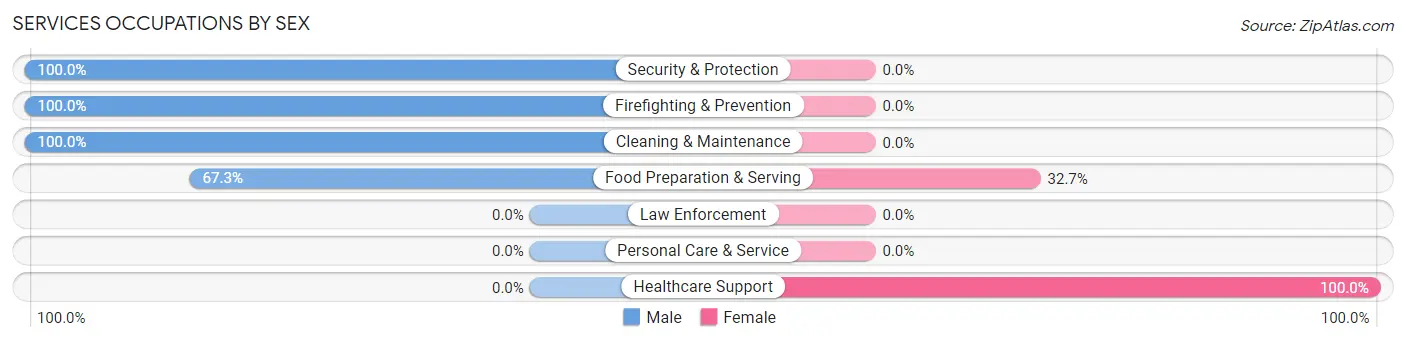
Services Occupations by Sex
Within the Services occupations in Waretown, the most male-oriented occupations are Security & Protection (100.0%), Firefighting & Prevention (100.0%), and Cleaning & Maintenance (100.0%), while the most female-oriented occupations are Healthcare Support (100.0%), and Food Preparation & Serving (32.7%).
| Occupation | Male | Female |
| Healthcare Support | 0 (0.0%) | 10 (100.0%) |
| Security & Protection | 37 (100.0%) | 0 (0.0%) |
| Firefighting & Prevention | 37 (100.0%) | 0 (0.0%) |
| Law Enforcement | 0 (0.0%) | 0 (0.0%) |
| Food Preparation & Serving | 35 (67.3%) | 17 (32.7%) |
| Cleaning & Maintenance | 17 (100.0%) | 0 (0.0%) |
| Personal Care & Service | 0 (0.0%) | 0 (0.0%) |
| Total (Category) | 89 (76.7%) | 27 (23.3%) |
| Total (Overall) | 452 (45.3%) | 546 (54.7%) |
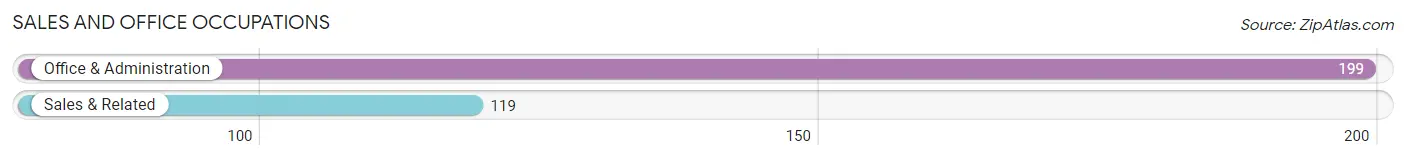
Sales and Office Occupations
The most common Sales and Office occupations in Waretown are Office & Administration (199 | 19.9%), and Sales & Related (119 | 11.9%).
Sales and Office Occupations by Sex
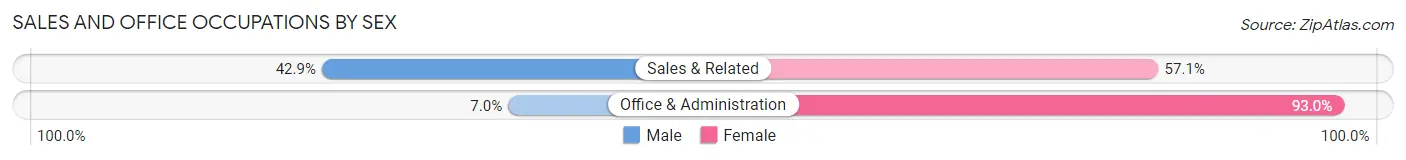
| Occupation | Male | Female |
| Sales & Related | 51 (42.9%) | 68 (57.1%) |
| Office & Administration | 14 (7.0%) | 185 (93.0%) |
| Total (Category) | 65 (20.4%) | 253 (79.6%) |
| Total (Overall) | 452 (45.3%) | 546 (54.7%) |
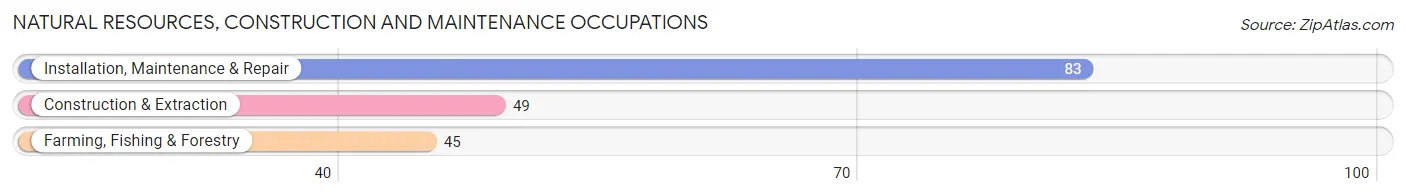
Natural Resources, Construction and Maintenance Occupations
The most common Natural Resources, Construction and Maintenance occupations in Waretown are Installation, Maintenance & Repair (83 | 8.3%), Construction & Extraction (49 | 4.9%), and Farming, Fishing & Forestry (45 | 4.5%).
Natural Resources, Construction and Maintenance Occupations by Sex
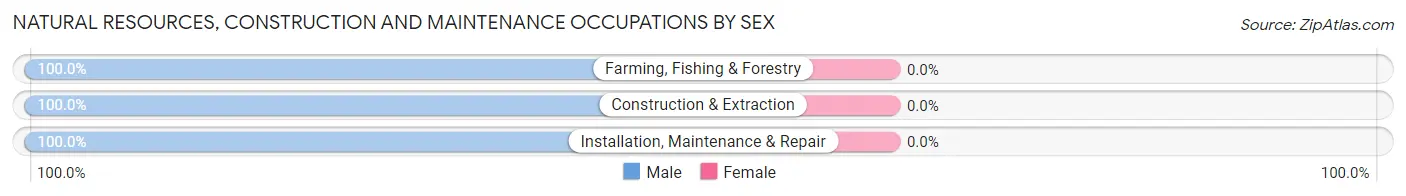
| Occupation | Male | Female |
| Farming, Fishing & Forestry | 45 (100.0%) | 0 (0.0%) |
| Construction & Extraction | 49 (100.0%) | 0 (0.0%) |
| Installation, Maintenance & Repair | 83 (100.0%) | 0 (0.0%) |
| Total (Category) | 177 (100.0%) | 0 (0.0%) |
| Total (Overall) | 452 (45.3%) | 546 (54.7%) |
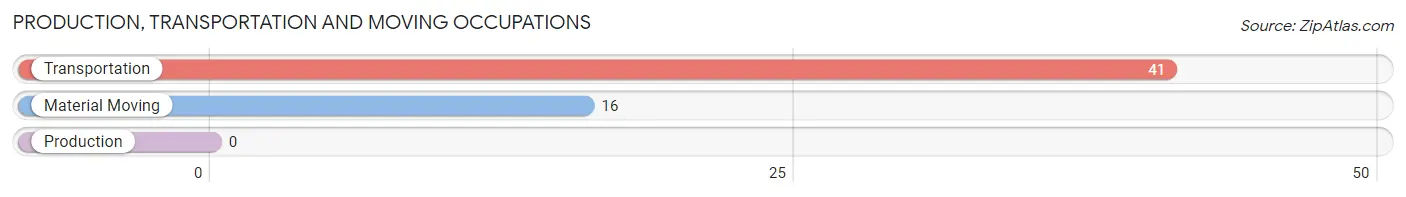
Production, Transportation and Moving Occupations
The most common Production, Transportation and Moving occupations in Waretown are Transportation (41 | 4.1%), and Material Moving (16 | 1.6%).
Production, Transportation and Moving Occupations by Sex
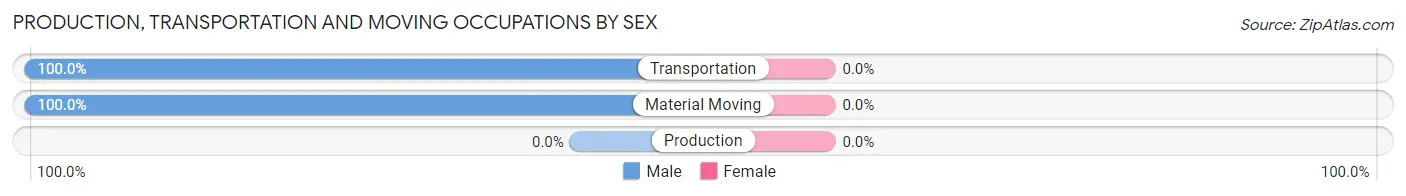
| Occupation | Male | Female |
| Production | 0 (0.0%) | 0 (0.0%) |
| Transportation | 41 (100.0%) | 0 (0.0%) |
| Material Moving | 16 (100.0%) | 0 (0.0%) |
| Total (Category) | 57 (100.0%) | 0 (0.0%) |
| Total (Overall) | 452 (45.3%) | 546 (54.7%) |
Employment Industries by Sex in Waretown
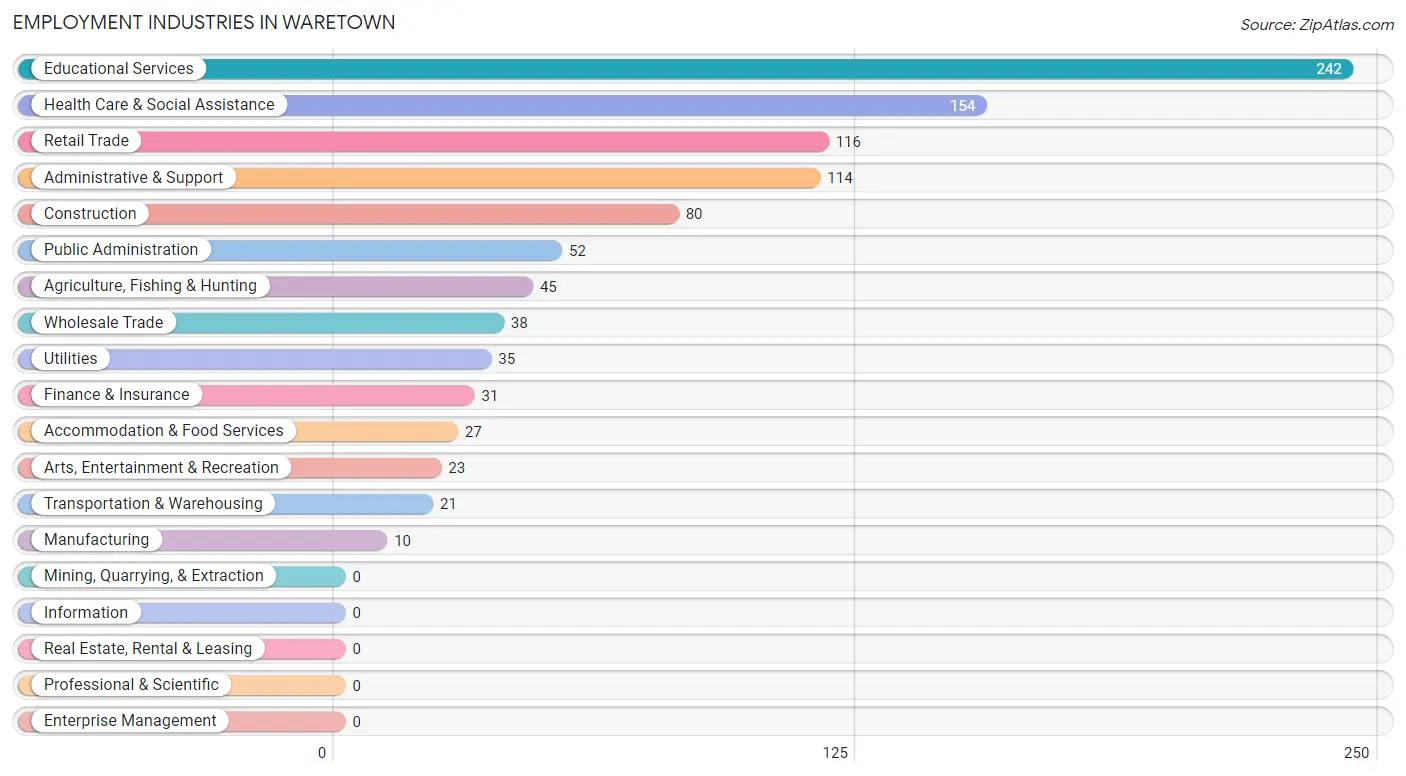
Employment Industries in Waretown
The major employment industries in Waretown include Educational Services (242 | 24.2%), Health Care & Social Assistance (154 | 15.4%), Retail Trade (116 | 11.6%), Administrative & Support (114 | 11.4%), and Construction (80 | 8.0%).
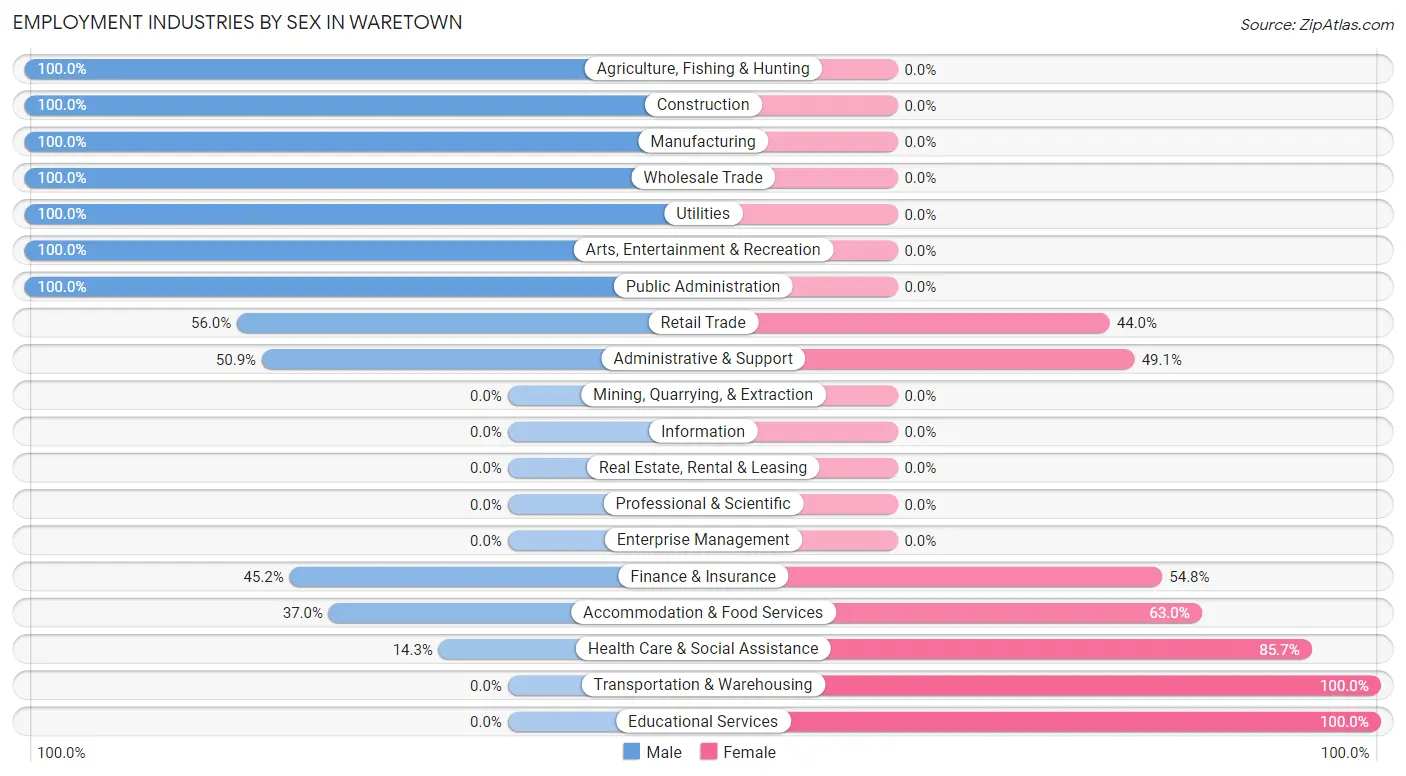
Employment Industries by Sex in Waretown
The Waretown industries that see more men than women are Agriculture, Fishing & Hunting (100.0%), Construction (100.0%), and Manufacturing (100.0%), whereas the industries that tend to have a higher number of women are Transportation & Warehousing (100.0%), Educational Services (100.0%), and Health Care & Social Assistance (85.7%).
| Industry | Male | Female |
| Agriculture, Fishing & Hunting | 45 (100.0%) | 0 (0.0%) |
| Mining, Quarrying, & Extraction | 0 (0.0%) | 0 (0.0%) |
| Construction | 80 (100.0%) | 0 (0.0%) |
| Manufacturing | 10 (100.0%) | 0 (0.0%) |
| Wholesale Trade | 38 (100.0%) | 0 (0.0%) |
| Retail Trade | 65 (56.0%) | 51 (44.0%) |
| Transportation & Warehousing | 0 (0.0%) | 21 (100.0%) |
| Utilities | 35 (100.0%) | 0 (0.0%) |
| Information | 0 (0.0%) | 0 (0.0%) |
| Finance & Insurance | 14 (45.2%) | 17 (54.8%) |
| Real Estate, Rental & Leasing | 0 (0.0%) | 0 (0.0%) |
| Professional & Scientific | 0 (0.0%) | 0 (0.0%) |
| Enterprise Management | 0 (0.0%) | 0 (0.0%) |
| Administrative & Support | 58 (50.9%) | 56 (49.1%) |
| Educational Services | 0 (0.0%) | 242 (100.0%) |
| Health Care & Social Assistance | 22 (14.3%) | 132 (85.7%) |
| Arts, Entertainment & Recreation | 23 (100.0%) | 0 (0.0%) |
| Accommodation & Food Services | 10 (37.0%) | 17 (63.0%) |
| Public Administration | 52 (100.0%) | 0 (0.0%) |
| Total | 452 (45.3%) | 546 (54.7%) |
Education in Waretown
School Enrollment in Waretown
The most common levels of schooling among the 634 students in Waretown are high school (325 | 51.3%), middle school (135 | 21.3%), and college / undergraduate (111 | 17.5%).
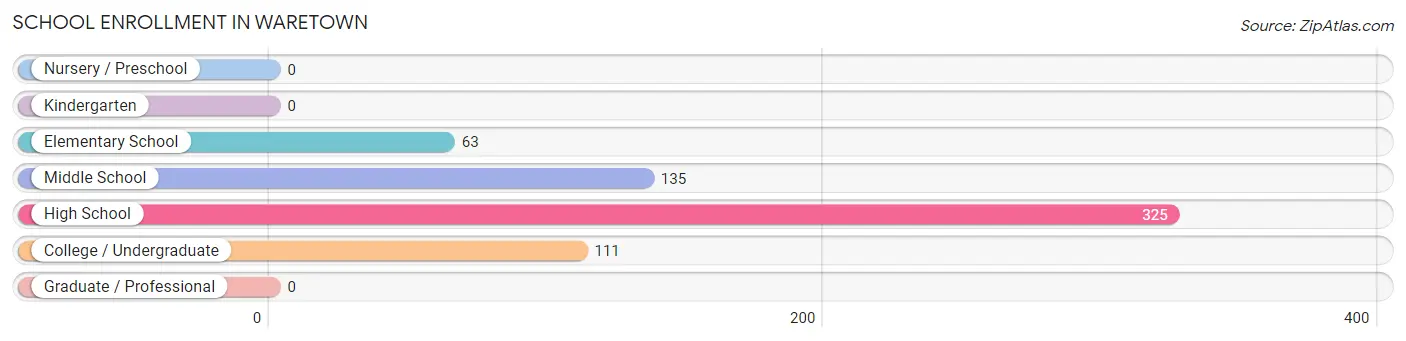
| School Level | # Students | % Students |
| Nursery / Preschool | 0 | 0.0% |
| Kindergarten | 0 | 0.0% |
| Elementary School | 63 | 9.9% |
| Middle School | 135 | 21.3% |
| High School | 325 | 51.3% |
| College / Undergraduate | 111 | 17.5% |
| Graduate / Professional | 0 | 0.0% |
| Total | 634 | 100.0% |
School Enrollment by Age by Funding Source in Waretown
Out of a total of 634 students who are enrolled in schools in Waretown, 99 (15.6%) attend a private institution, while the remaining 535 (84.4%) are enrolled in public schools. The age group of 5 to 9 year old has the highest likelihood of being enrolled in private schools, with 63 (100.0% in the age bracket) enrolled. Conversely, the age group of 10 to 14 year olds has the lowest likelihood of being enrolled in a private school, with 135 (100.0% in the age bracket) attending a public institution.
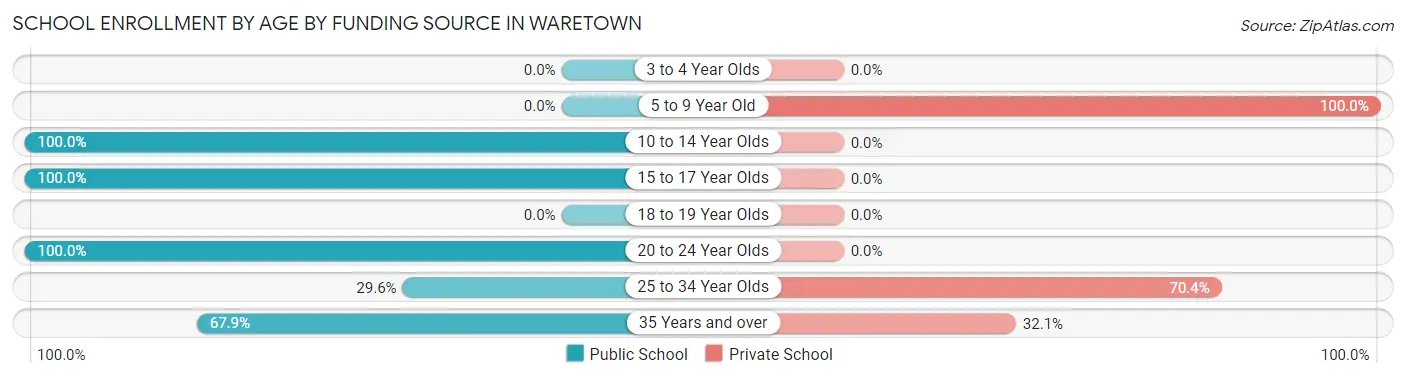
| Age Bracket | Public School | Private School |
| 3 to 4 Year Olds | 0 (0.0%) | 0 (0.0%) |
| 5 to 9 Year Old | 0 (0.0%) | 63 (100.0%) |
| 10 to 14 Year Olds | 135 (100.0%) | 0 (0.0%) |
| 15 to 17 Year Olds | 325 (100.0%) | 0 (0.0%) |
| 18 to 19 Year Olds | 0 (0.0%) | 0 (0.0%) |
| 20 to 24 Year Olds | 31 (100.0%) | 0 (0.0%) |
| 25 to 34 Year Olds | 8 (29.6%) | 19 (70.4%) |
| 35 Years and over | 36 (67.9%) | 17 (32.1%) |
| Total | 535 (84.4%) | 99 (15.6%) |
Educational Attainment by Field of Study in Waretown
Business (159 | 40.6%), arts & humanities (61 | 15.6%), social sciences (42 | 10.7%), education (35 | 8.9%), and science & technology (24 | 6.1%) are the most common fields of study among 392 individuals in Waretown who have obtained a bachelor's degree or higher.
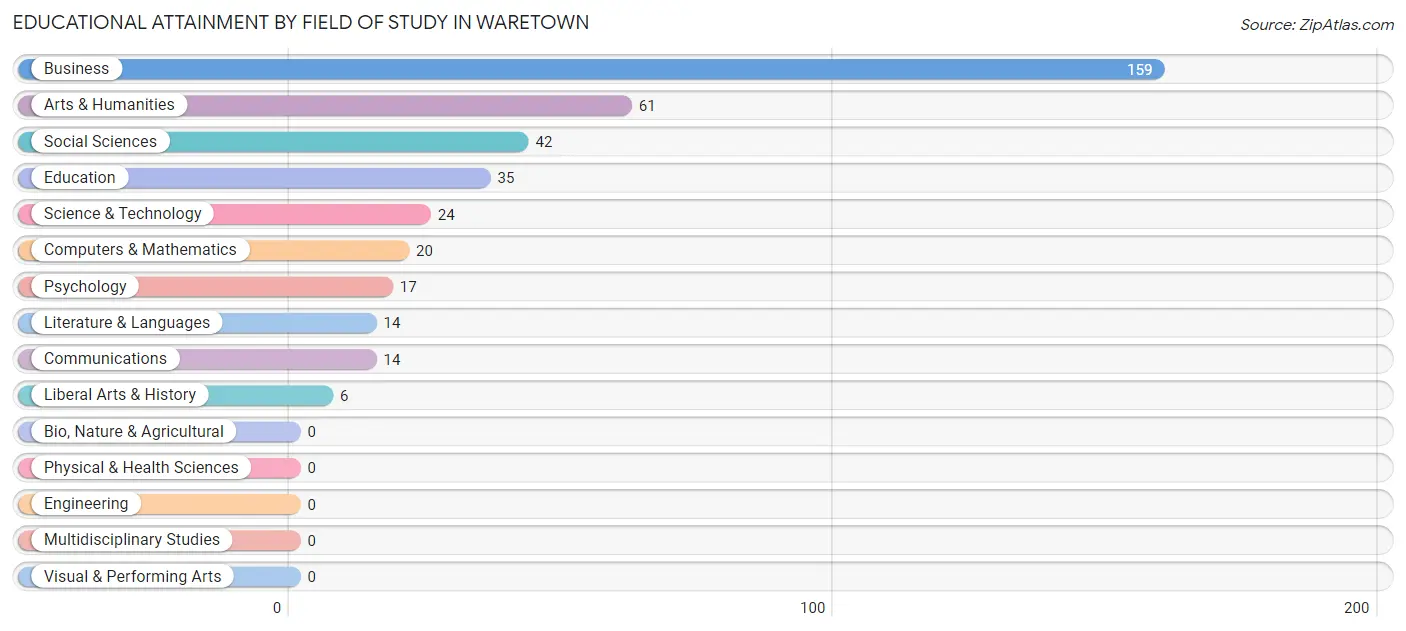
| Field of Study | # Graduates | % Graduates |
| Computers & Mathematics | 20 | 5.1% |
| Bio, Nature & Agricultural | 0 | 0.0% |
| Physical & Health Sciences | 0 | 0.0% |
| Psychology | 17 | 4.3% |
| Social Sciences | 42 | 10.7% |
| Engineering | 0 | 0.0% |
| Multidisciplinary Studies | 0 | 0.0% |
| Science & Technology | 24 | 6.1% |
| Business | 159 | 40.6% |
| Education | 35 | 8.9% |
| Literature & Languages | 14 | 3.6% |
| Liberal Arts & History | 6 | 1.5% |
| Visual & Performing Arts | 0 | 0.0% |
| Communications | 14 | 3.6% |
| Arts & Humanities | 61 | 15.6% |
| Total | 392 | 100.0% |
Transportation & Commute in Waretown
Vehicle Availability by Sex in Waretown
The most prevalent vehicle ownership categories in Waretown are males with 3 vehicles (143, accounting for 31.6%) and females with 3 vehicles (116, making up 35.4%).
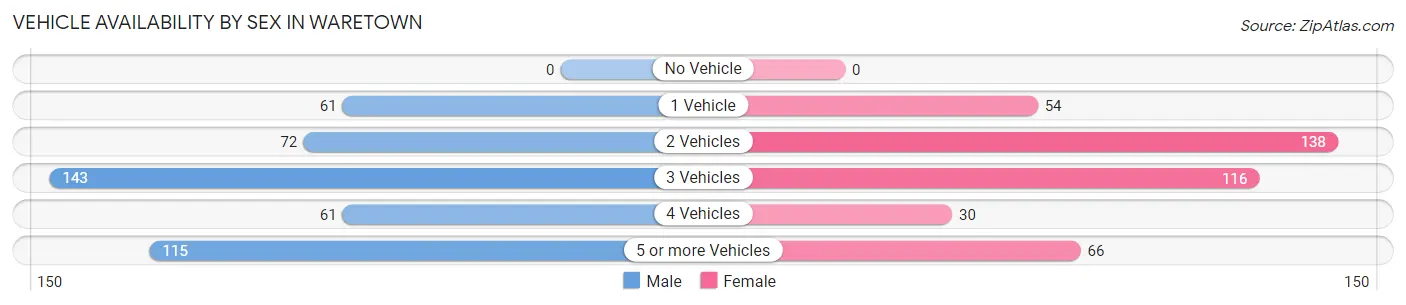
| Vehicles Available | Male | Female |
| No Vehicle | 0 (0.0%) | 0 (0.0%) |
| 1 Vehicle | 61 (13.5%) | 54 (13.4%) |
| 2 Vehicles | 72 (15.9%) | 138 (34.2%) |
| 3 Vehicles | 143 (31.6%) | 116 (28.7%) |
| 4 Vehicles | 61 (13.5%) | 30 (7.4%) |
| 5 or more Vehicles | 115 (25.4%) | 66 (16.3%) |
| Total | 452 (100.0%) | 404 (100.0%) |
Commute Time in Waretown
The most frequently occuring commute durations in Waretown are 20 to 24 minutes (238 commuters, 28.6%), 60 to 89 minutes (178 commuters, 21.4%), and 90 or more minutes (132 commuters, 15.9%).
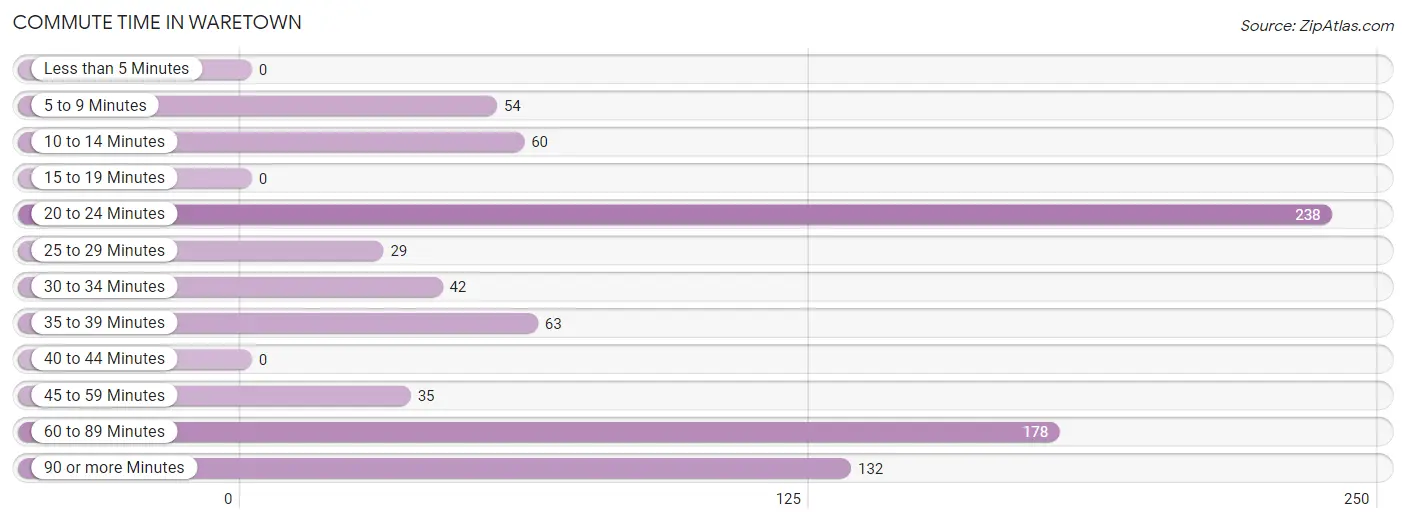
| Commute Time | # Commuters | % Commuters |
| Less than 5 Minutes | 0 | 0.0% |
| 5 to 9 Minutes | 54 | 6.5% |
| 10 to 14 Minutes | 60 | 7.2% |
| 15 to 19 Minutes | 0 | 0.0% |
| 20 to 24 Minutes | 238 | 28.6% |
| 25 to 29 Minutes | 29 | 3.5% |
| 30 to 34 Minutes | 42 | 5.1% |
| 35 to 39 Minutes | 63 | 7.6% |
| 40 to 44 Minutes | 0 | 0.0% |
| 45 to 59 Minutes | 35 | 4.2% |
| 60 to 89 Minutes | 178 | 21.4% |
| 90 or more Minutes | 132 | 15.9% |
Commute Time by Sex in Waretown
The most common commute times in Waretown are 60 to 89 minutes (141 commuters, 31.2%) for males and 20 to 24 minutes (193 commuters, 50.9%) for females.
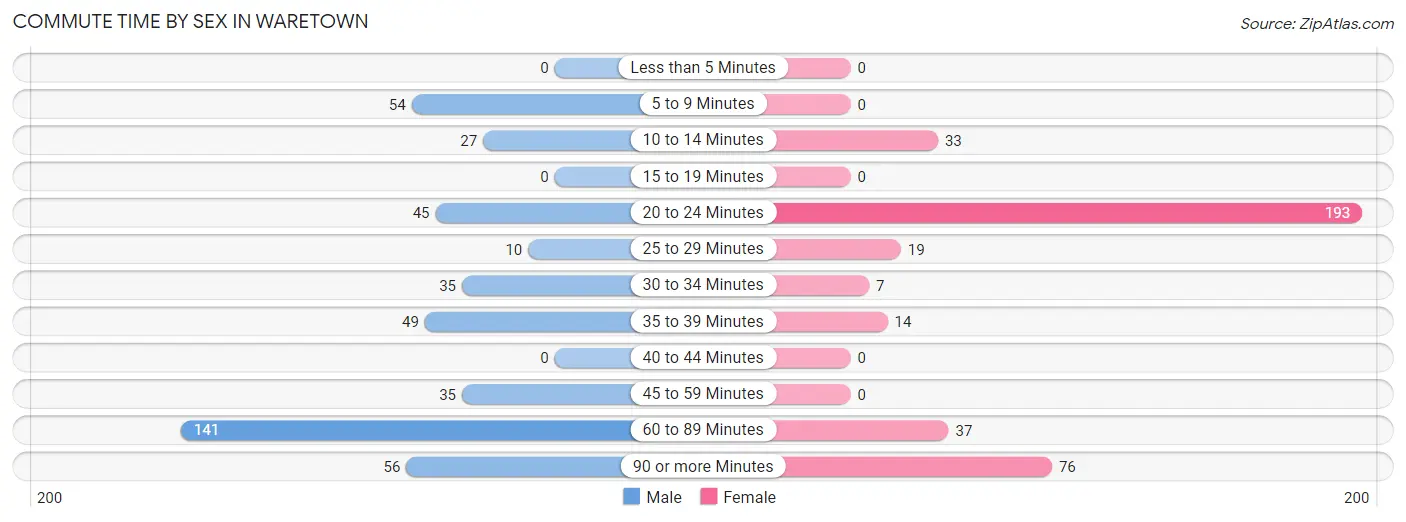
| Commute Time | Male | Female |
| Less than 5 Minutes | 0 (0.0%) | 0 (0.0%) |
| 5 to 9 Minutes | 54 (11.9%) | 0 (0.0%) |
| 10 to 14 Minutes | 27 (6.0%) | 33 (8.7%) |
| 15 to 19 Minutes | 0 (0.0%) | 0 (0.0%) |
| 20 to 24 Minutes | 45 (10.0%) | 193 (50.9%) |
| 25 to 29 Minutes | 10 (2.2%) | 19 (5.0%) |
| 30 to 34 Minutes | 35 (7.7%) | 7 (1.8%) |
| 35 to 39 Minutes | 49 (10.8%) | 14 (3.7%) |
| 40 to 44 Minutes | 0 (0.0%) | 0 (0.0%) |
| 45 to 59 Minutes | 35 (7.7%) | 0 (0.0%) |
| 60 to 89 Minutes | 141 (31.2%) | 37 (9.8%) |
| 90 or more Minutes | 56 (12.4%) | 76 (20.1%) |
Time of Departure to Work by Sex in Waretown
The most frequent times of departure to work in Waretown are 8:00 AM to 8:29 AM (153, 33.9%) for males and 6:30 AM to 6:59 AM (112, 29.5%) for females.
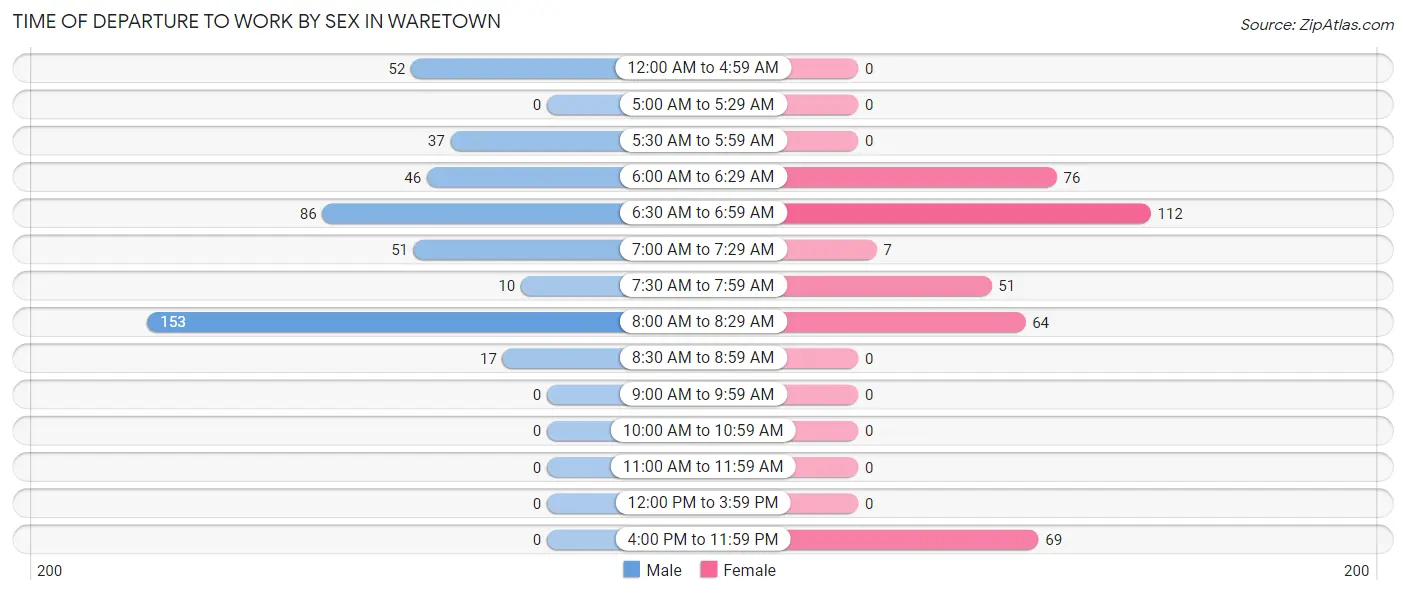
| Time of Departure | Male | Female |
| 12:00 AM to 4:59 AM | 52 (11.5%) | 0 (0.0%) |
| 5:00 AM to 5:29 AM | 0 (0.0%) | 0 (0.0%) |
| 5:30 AM to 5:59 AM | 37 (8.2%) | 0 (0.0%) |
| 6:00 AM to 6:29 AM | 46 (10.2%) | 76 (20.1%) |
| 6:30 AM to 6:59 AM | 86 (19.0%) | 112 (29.5%) |
| 7:00 AM to 7:29 AM | 51 (11.3%) | 7 (1.8%) |
| 7:30 AM to 7:59 AM | 10 (2.2%) | 51 (13.5%) |
| 8:00 AM to 8:29 AM | 153 (33.9%) | 64 (16.9%) |
| 8:30 AM to 8:59 AM | 17 (3.8%) | 0 (0.0%) |
| 9:00 AM to 9:59 AM | 0 (0.0%) | 0 (0.0%) |
| 10:00 AM to 10:59 AM | 0 (0.0%) | 0 (0.0%) |
| 11:00 AM to 11:59 AM | 0 (0.0%) | 0 (0.0%) |
| 12:00 PM to 3:59 PM | 0 (0.0%) | 0 (0.0%) |
| 4:00 PM to 11:59 PM | 0 (0.0%) | 69 (18.2%) |
| Total | 452 (100.0%) | 379 (100.0%) |
Housing Occupancy in Waretown
Occupancy by Ownership in Waretown
Of the total 860 dwellings in Waretown, owner-occupied units account for 775 (90.1%), while renter-occupied units make up 85 (9.9%).
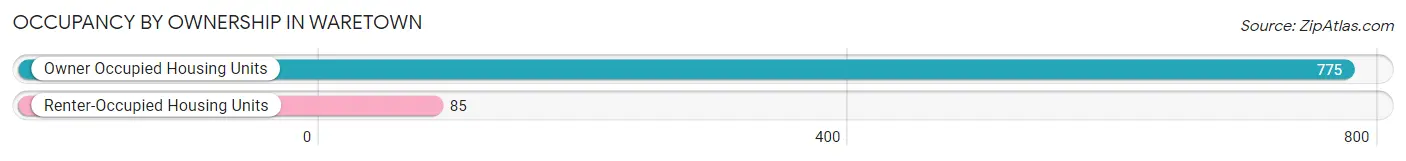
| Occupancy | # Housing Units | % Housing Units |
| Owner Occupied Housing Units | 775 | 90.1% |
| Renter-Occupied Housing Units | 85 | 9.9% |
| Total Occupied Housing Units | 860 | 100.0% |
Occupancy by Household Size in Waretown
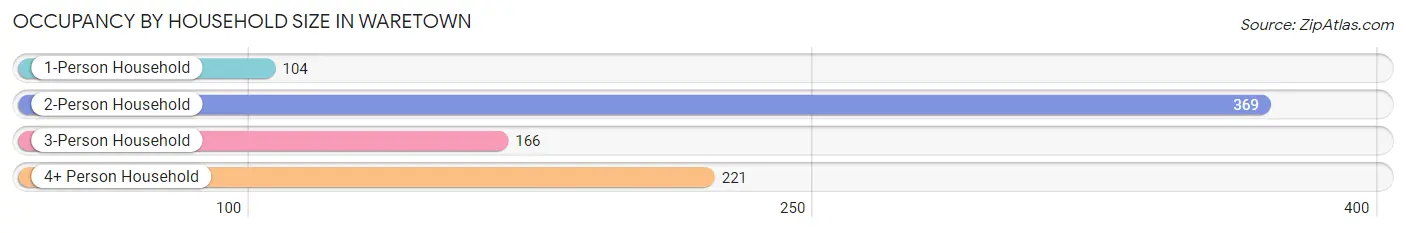
| Household Size | # Housing Units | % Housing Units |
| 1-Person Household | 104 | 12.1% |
| 2-Person Household | 369 | 42.9% |
| 3-Person Household | 166 | 19.3% |
| 4+ Person Household | 221 | 25.7% |
| Total Housing Units | 860 | 100.0% |
Occupancy by Ownership by Household Size in Waretown
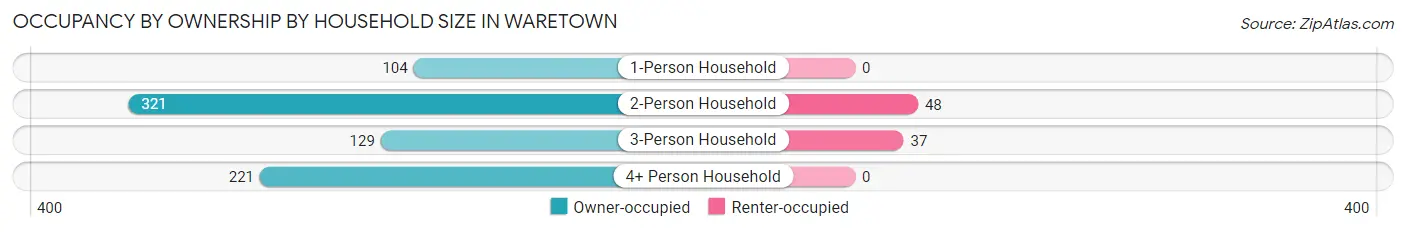
| Household Size | Owner-occupied | Renter-occupied |
| 1-Person Household | 104 (100.0%) | 0 (0.0%) |
| 2-Person Household | 321 (87.0%) | 48 (13.0%) |
| 3-Person Household | 129 (77.7%) | 37 (22.3%) |
| 4+ Person Household | 221 (100.0%) | 0 (0.0%) |
| Total Housing Units | 775 (90.1%) | 85 (9.9%) |
Occupancy by Educational Attainment in Waretown
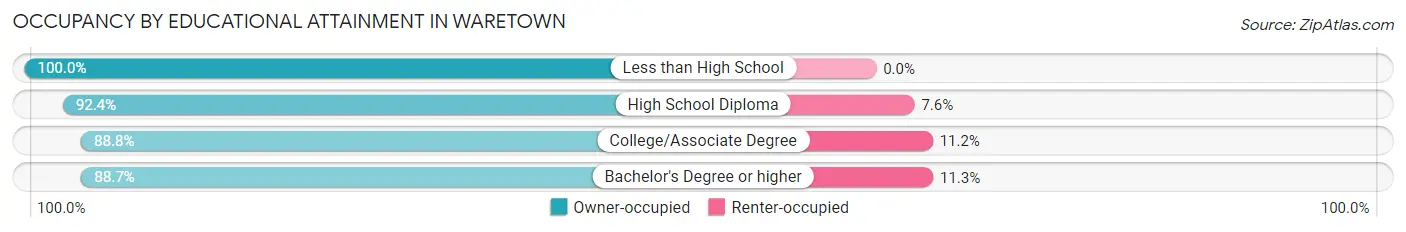
| Household Size | Owner-occupied | Renter-occupied |
| Less than High School | 31 (100.0%) | 0 (0.0%) |
| High School Diploma | 207 (92.4%) | 17 (7.6%) |
| College/Associate Degree | 293 (88.8%) | 37 (11.2%) |
| Bachelor's Degree or higher | 244 (88.7%) | 31 (11.3%) |
Occupancy by Age of Householder in Waretown
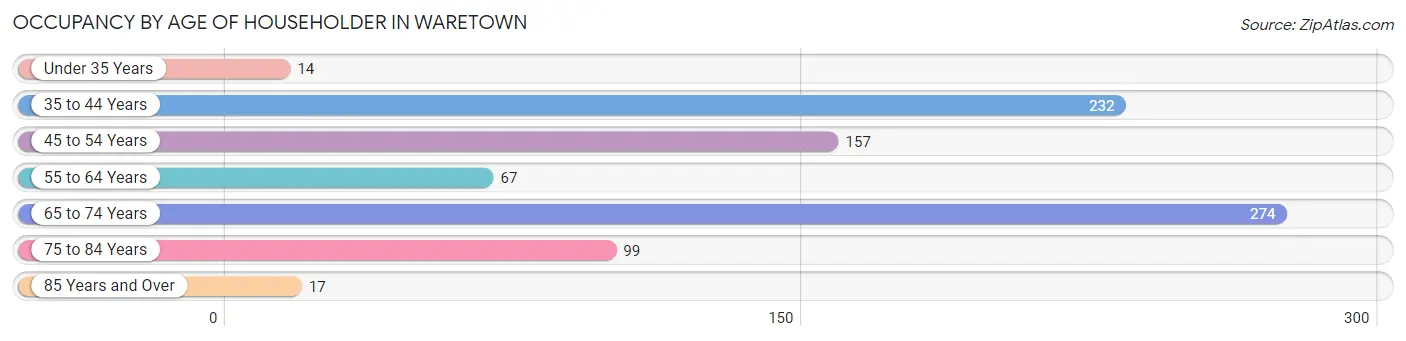
| Age Bracket | # Households | % Households |
| Under 35 Years | 14 | 1.6% |
| 35 to 44 Years | 232 | 27.0% |
| 45 to 54 Years | 157 | 18.3% |
| 55 to 64 Years | 67 | 7.8% |
| 65 to 74 Years | 274 | 31.9% |
| 75 to 84 Years | 99 | 11.5% |
| 85 Years and Over | 17 | 2.0% |
| Total | 860 | 100.0% |
Housing Finances in Waretown
Median Income by Occupancy in Waretown
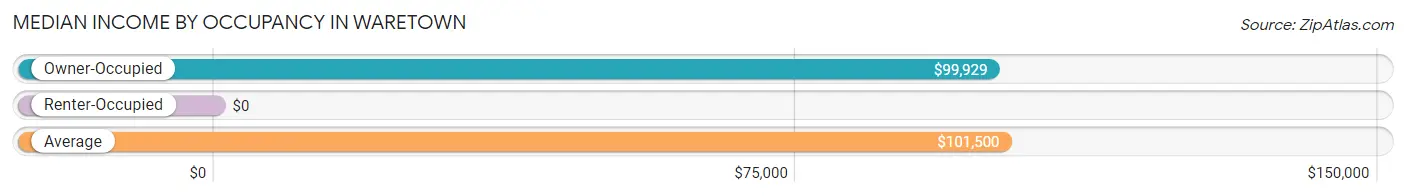
| Occupancy Type | # Households | Median Income |
| Owner-Occupied | 775 (90.1%) | $99,929 |
| Renter-Occupied | 85 (9.9%) | $0 |
| Average | 860 (100.0%) | $101,500 |
Occupancy by Householder Income Bracket in Waretown
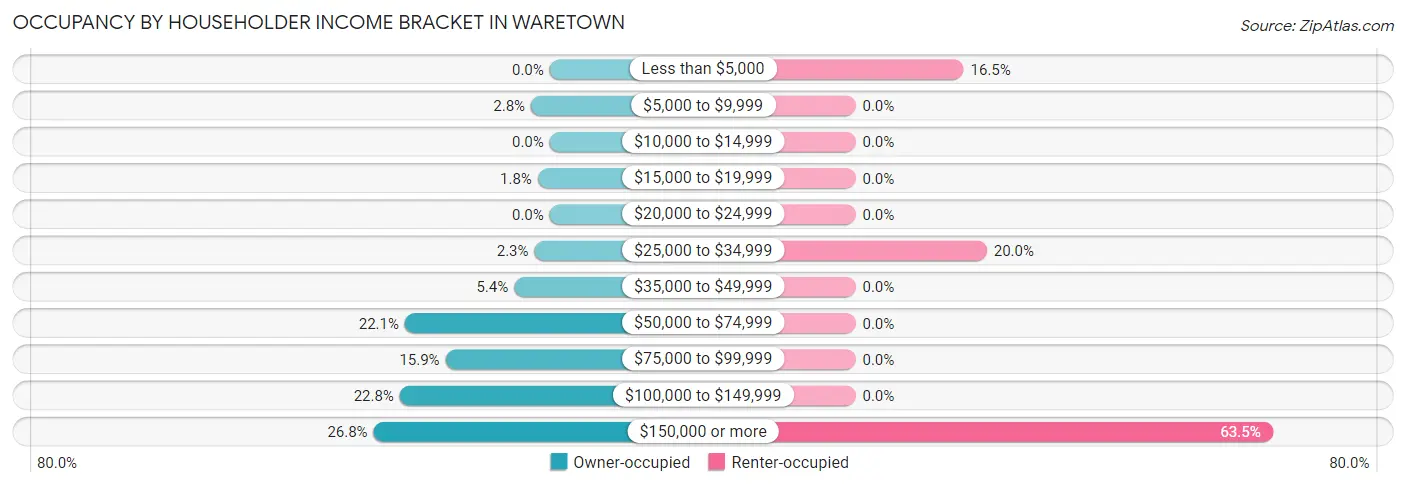
| Income Bracket | Owner-occupied | Renter-occupied |
| Less than $5,000 | 0 (0.0%) | 14 (16.5%) |
| $5,000 to $9,999 | 22 (2.8%) | 0 (0.0%) |
| $10,000 to $14,999 | 0 (0.0%) | 0 (0.0%) |
| $15,000 to $19,999 | 14 (1.8%) | 0 (0.0%) |
| $20,000 to $24,999 | 0 (0.0%) | 0 (0.0%) |
| $25,000 to $34,999 | 18 (2.3%) | 17 (20.0%) |
| $35,000 to $49,999 | 42 (5.4%) | 0 (0.0%) |
| $50,000 to $74,999 | 171 (22.1%) | 0 (0.0%) |
| $75,000 to $99,999 | 123 (15.9%) | 0 (0.0%) |
| $100,000 to $149,999 | 177 (22.8%) | 0 (0.0%) |
| $150,000 or more | 208 (26.8%) | 54 (63.5%) |
| Total | 775 (100.0%) | 85 (100.0%) |
Monthly Housing Cost Tiers in Waretown
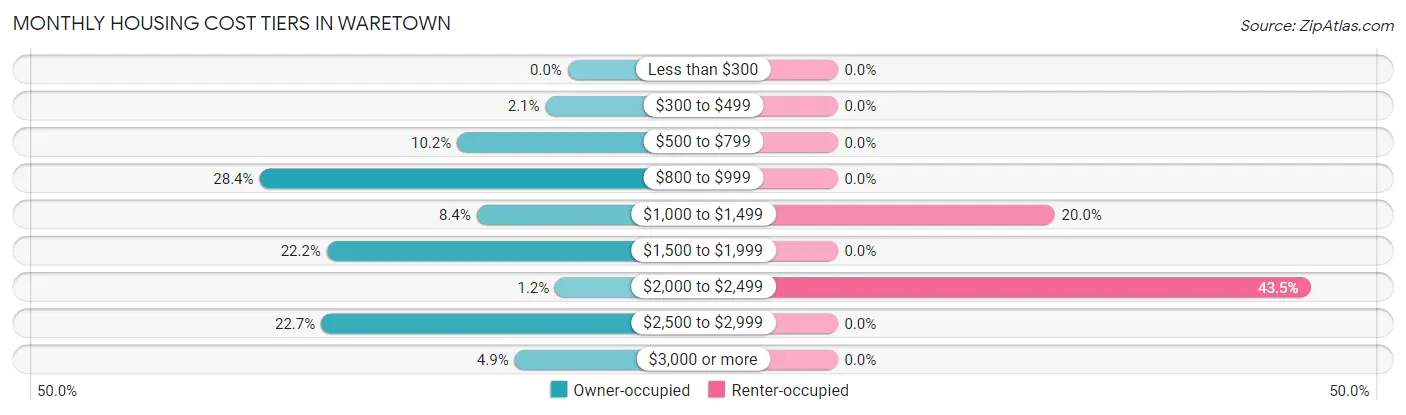
| Monthly Cost | Owner-occupied | Renter-occupied |
| Less than $300 | 0 (0.0%) | 0 (0.0%) |
| $300 to $499 | 16 (2.1%) | 0 (0.0%) |
| $500 to $799 | 79 (10.2%) | 0 (0.0%) |
| $800 to $999 | 220 (28.4%) | 0 (0.0%) |
| $1,000 to $1,499 | 65 (8.4%) | 17 (20.0%) |
| $1,500 to $1,999 | 172 (22.2%) | 0 (0.0%) |
| $2,000 to $2,499 | 9 (1.2%) | 37 (43.5%) |
| $2,500 to $2,999 | 176 (22.7%) | 0 (0.0%) |
| $3,000 or more | 38 (4.9%) | 0 (0.0%) |
| Total | 775 (100.0%) | 85 (100.0%) |
Physical Housing Characteristics in Waretown
Housing Structures in Waretown
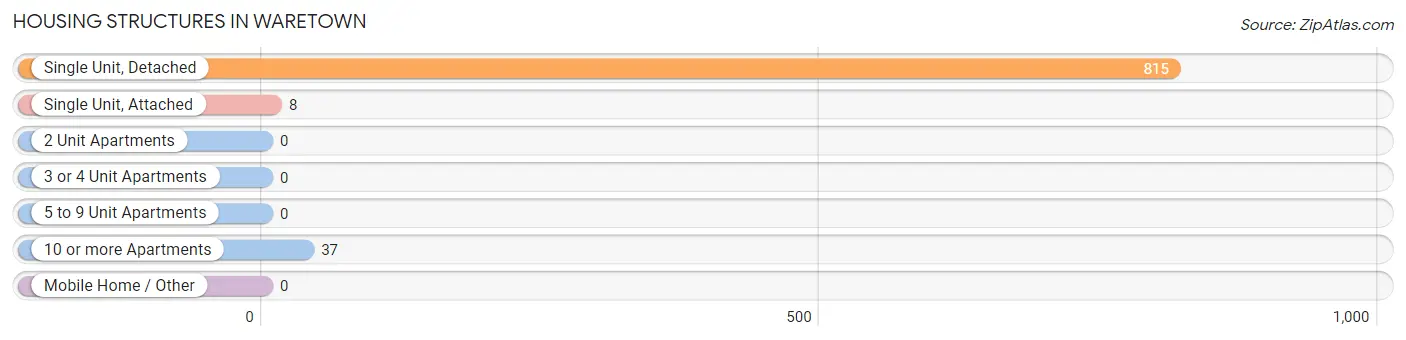
| Structure Type | # Housing Units | % Housing Units |
| Single Unit, Detached | 815 | 94.8% |
| Single Unit, Attached | 8 | 0.9% |
| 2 Unit Apartments | 0 | 0.0% |
| 3 or 4 Unit Apartments | 0 | 0.0% |
| 5 to 9 Unit Apartments | 0 | 0.0% |
| 10 or more Apartments | 37 | 4.3% |
| Mobile Home / Other | 0 | 0.0% |
| Total | 860 | 100.0% |
Housing Structures by Occupancy in Waretown
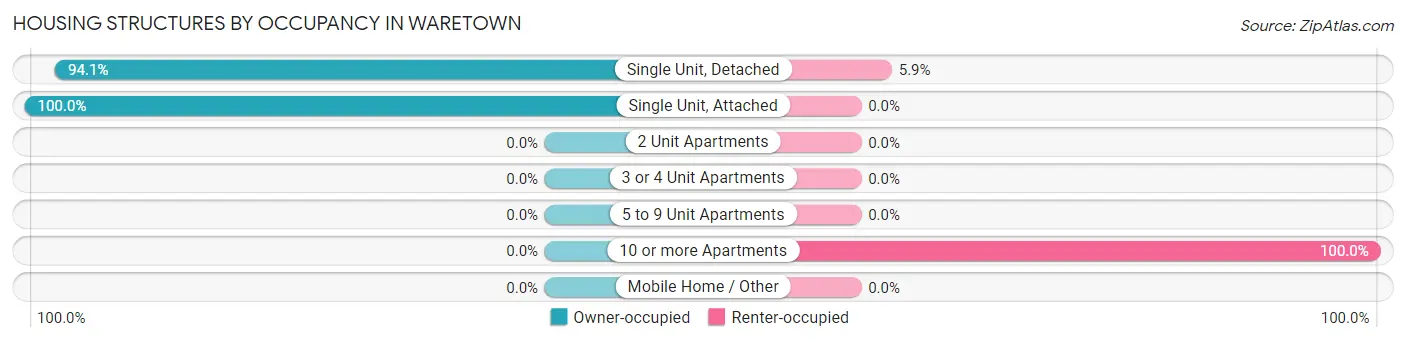
| Structure Type | Owner-occupied | Renter-occupied |
| Single Unit, Detached | 767 (94.1%) | 48 (5.9%) |
| Single Unit, Attached | 8 (100.0%) | 0 (0.0%) |
| 2 Unit Apartments | 0 (0.0%) | 0 (0.0%) |
| 3 or 4 Unit Apartments | 0 (0.0%) | 0 (0.0%) |
| 5 to 9 Unit Apartments | 0 (0.0%) | 0 (0.0%) |
| 10 or more Apartments | 0 (0.0%) | 37 (100.0%) |
| Mobile Home / Other | 0 (0.0%) | 0 (0.0%) |
| Total | 775 (90.1%) | 85 (9.9%) |
Housing Structures by Number of Rooms in Waretown
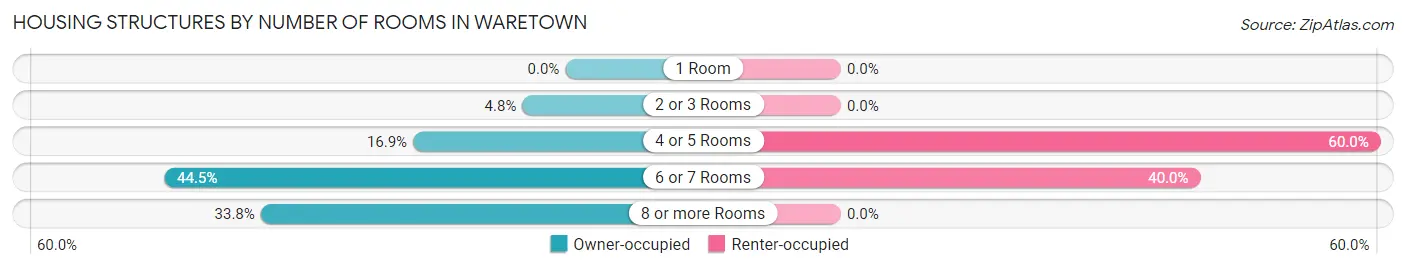
| Number of Rooms | Owner-occupied | Renter-occupied |
| 1 Room | 0 (0.0%) | 0 (0.0%) |
| 2 or 3 Rooms | 37 (4.8%) | 0 (0.0%) |
| 4 or 5 Rooms | 131 (16.9%) | 51 (60.0%) |
| 6 or 7 Rooms | 345 (44.5%) | 34 (40.0%) |
| 8 or more Rooms | 262 (33.8%) | 0 (0.0%) |
| Total | 775 (100.0%) | 85 (100.0%) |
Housing Structure by Heating Type in Waretown
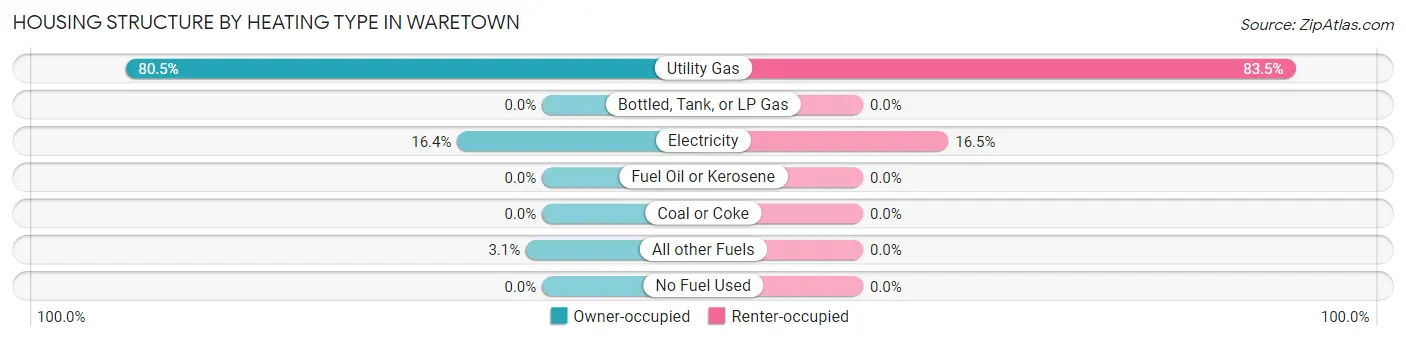
| Heating Type | Owner-occupied | Renter-occupied |
| Utility Gas | 624 (80.5%) | 71 (83.5%) |
| Bottled, Tank, or LP Gas | 0 (0.0%) | 0 (0.0%) |
| Electricity | 127 (16.4%) | 14 (16.5%) |
| Fuel Oil or Kerosene | 0 (0.0%) | 0 (0.0%) |
| Coal or Coke | 0 (0.0%) | 0 (0.0%) |
| All other Fuels | 24 (3.1%) | 0 (0.0%) |
| No Fuel Used | 0 (0.0%) | 0 (0.0%) |
| Total | 775 (100.0%) | 85 (100.0%) |
Household Vehicle Usage in Waretown
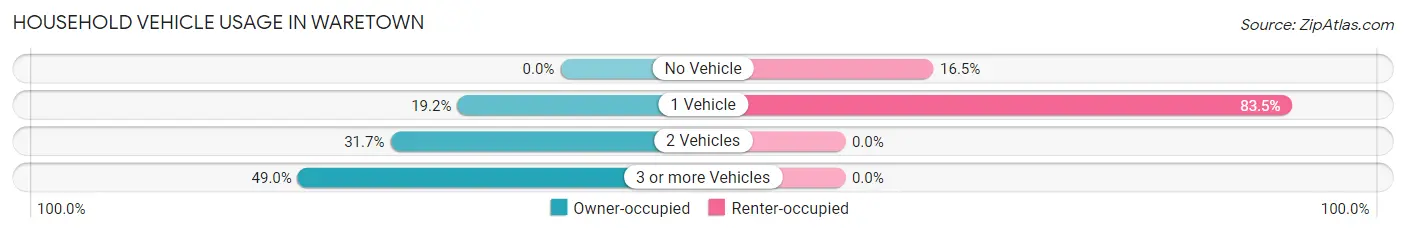
| Vehicles per Household | Owner-occupied | Renter-occupied |
| No Vehicle | 0 (0.0%) | 14 (16.5%) |
| 1 Vehicle | 149 (19.2%) | 71 (83.5%) |
| 2 Vehicles | 246 (31.7%) | 0 (0.0%) |
| 3 or more Vehicles | 380 (49.0%) | 0 (0.0%) |
| Total | 775 (100.0%) | 85 (100.0%) |
Real Estate & Mortgages in Waretown
Real Estate and Mortgage Overview in Waretown
| Characteristic | Without Mortgage | With Mortgage |
| Housing Units | 409 | 366 |
| Median Property Value | $381,800 | $477,400 |
| Median Household Income | $85,288 | $195 |
| Monthly Housing Costs | $907 | $38 |
| Real Estate Taxes | $5,724 | $14 |
Property Value by Mortgage Status in Waretown
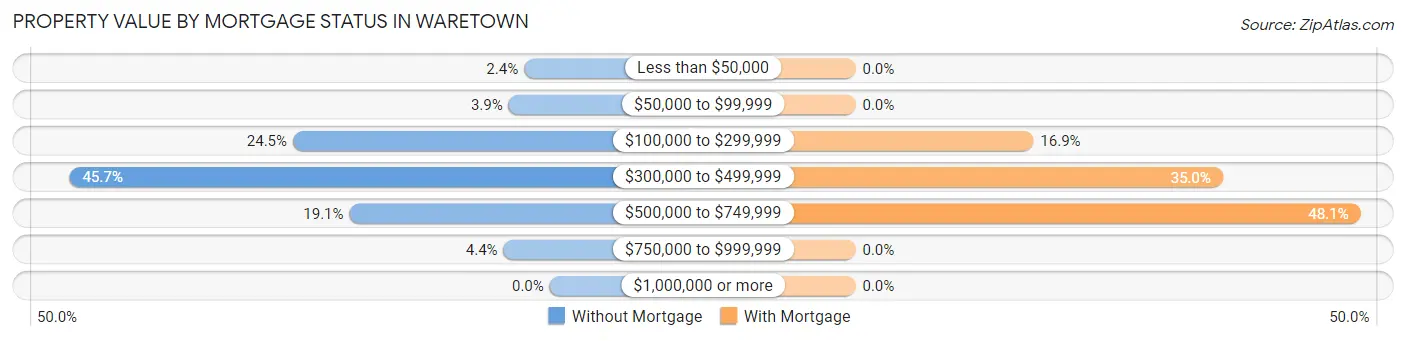
| Property Value | Without Mortgage | With Mortgage |
| Less than $50,000 | 10 (2.4%) | 0 (0.0%) |
| $50,000 to $99,999 | 16 (3.9%) | 0 (0.0%) |
| $100,000 to $299,999 | 100 (24.4%) | 62 (16.9%) |
| $300,000 to $499,999 | 187 (45.7%) | 128 (35.0%) |
| $500,000 to $749,999 | 78 (19.1%) | 176 (48.1%) |
| $750,000 to $999,999 | 18 (4.4%) | 0 (0.0%) |
| $1,000,000 or more | 0 (0.0%) | 0 (0.0%) |
| Total | 409 (100.0%) | 366 (100.0%) |
Household Income by Mortgage Status in Waretown
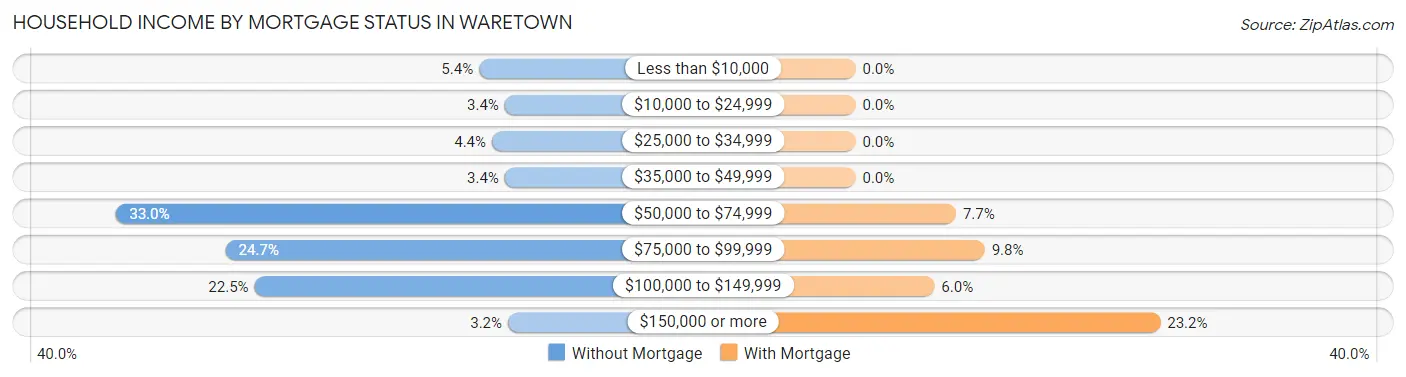
| Household Income | Without Mortgage | With Mortgage |
| Less than $10,000 | 22 (5.4%) | 0 (0.0%) |
| $10,000 to $24,999 | 14 (3.4%) | 0 (0.0%) |
| $25,000 to $34,999 | 18 (4.4%) | 0 (0.0%) |
| $35,000 to $49,999 | 14 (3.4%) | 0 (0.0%) |
| $50,000 to $74,999 | 135 (33.0%) | 28 (7.6%) |
| $75,000 to $99,999 | 101 (24.7%) | 36 (9.8%) |
| $100,000 to $149,999 | 92 (22.5%) | 22 (6.0%) |
| $150,000 or more | 13 (3.2%) | 85 (23.2%) |
| Total | 409 (100.0%) | 366 (100.0%) |
Property Value to Household Income Ratio in Waretown
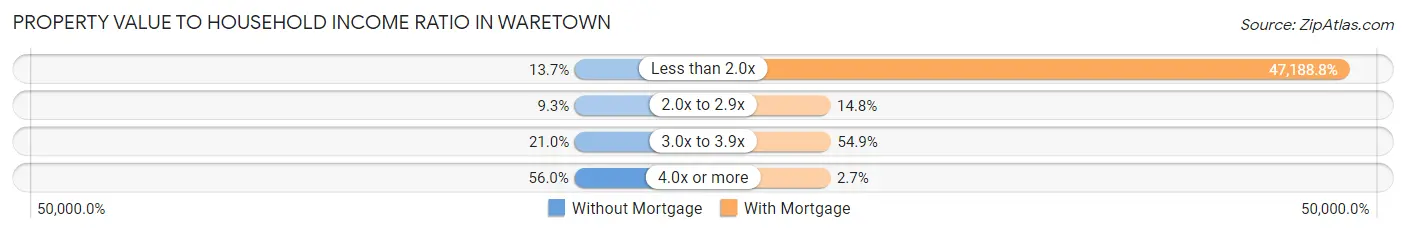
| Value-to-Income Ratio | Without Mortgage | With Mortgage |
| Less than 2.0x | 56 (13.7%) | 172,711 (47,188.8%) |
| 2.0x to 2.9x | 38 (9.3%) | 54 (14.7%) |
| 3.0x to 3.9x | 86 (21.0%) | 201 (54.9%) |
| 4.0x or more | 229 (56.0%) | 10 (2.7%) |
| Total | 409 (100.0%) | 366 (100.0%) |
Real Estate Taxes by Mortgage Status in Waretown
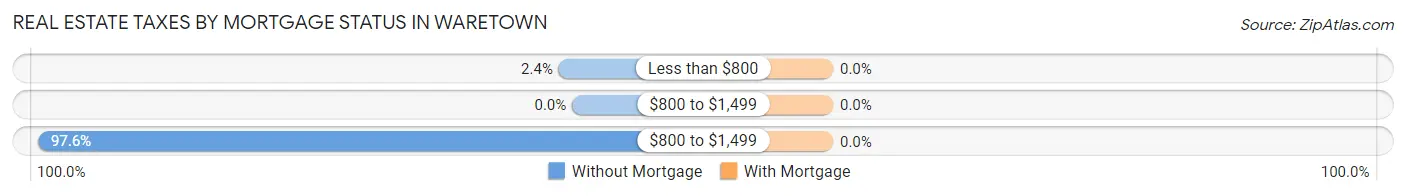
| Property Taxes | Without Mortgage | With Mortgage |
| Less than $800 | 10 (2.4%) | 0 (0.0%) |
| $800 to $1,499 | 0 (0.0%) | 0 (0.0%) |
| $800 to $1,499 | 399 (97.6%) | 0 (0.0%) |
| Total | 409 (100.0%) | 366 (100.0%) |
Health & Disability in Waretown
Health Insurance Coverage by Age in Waretown
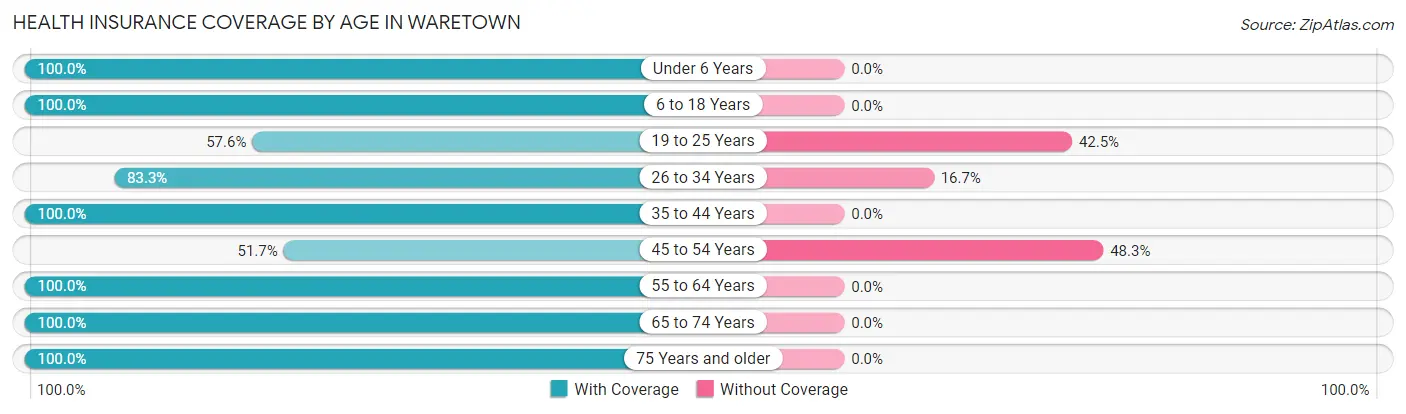
| Age Bracket | With Coverage | Without Coverage |
| Under 6 Years | 34 (100.0%) | 0 (0.0%) |
| 6 to 18 Years | 523 (100.0%) | 0 (0.0%) |
| 19 to 25 Years | 61 (57.6%) | 45 (42.4%) |
| 26 to 34 Years | 105 (83.3%) | 21 (16.7%) |
| 35 to 44 Years | 343 (100.0%) | 0 (0.0%) |
| 45 to 54 Years | 121 (51.7%) | 113 (48.3%) |
| 55 to 64 Years | 281 (100.0%) | 0 (0.0%) |
| 65 to 74 Years | 395 (100.0%) | 0 (0.0%) |
| 75 Years and older | 215 (100.0%) | 0 (0.0%) |
| Total | 2,078 (92.1%) | 179 (7.9%) |
Health Insurance Coverage by Citizenship Status in Waretown
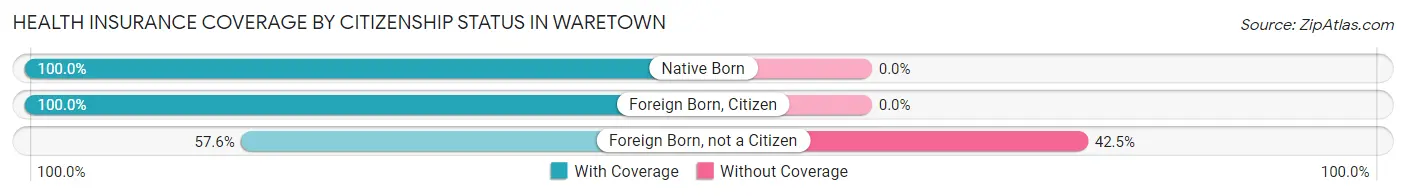
| Citizenship Status | With Coverage | Without Coverage |
| Native Born | 34 (100.0%) | 0 (0.0%) |
| Foreign Born, Citizen | 523 (100.0%) | 0 (0.0%) |
| Foreign Born, not a Citizen | 61 (57.6%) | 45 (42.4%) |
Health Insurance Coverage by Household Income in Waretown
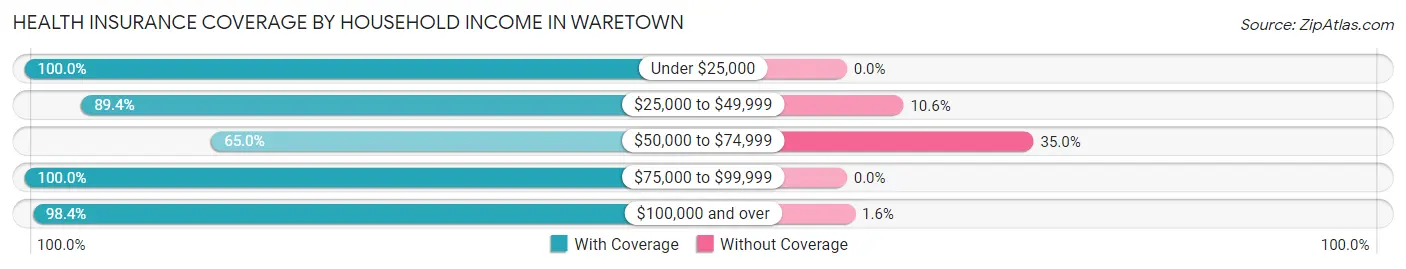
| Household Income | With Coverage | Without Coverage |
| Under $25,000 | 92 (100.0%) | 0 (0.0%) |
| $25,000 to $49,999 | 143 (89.4%) | 17 (10.6%) |
| $50,000 to $74,999 | 262 (65.0%) | 141 (35.0%) |
| $75,000 to $99,999 | 254 (100.0%) | 0 (0.0%) |
| $100,000 and over | 1,327 (98.4%) | 21 (1.6%) |
Public vs Private Health Insurance Coverage by Age in Waretown
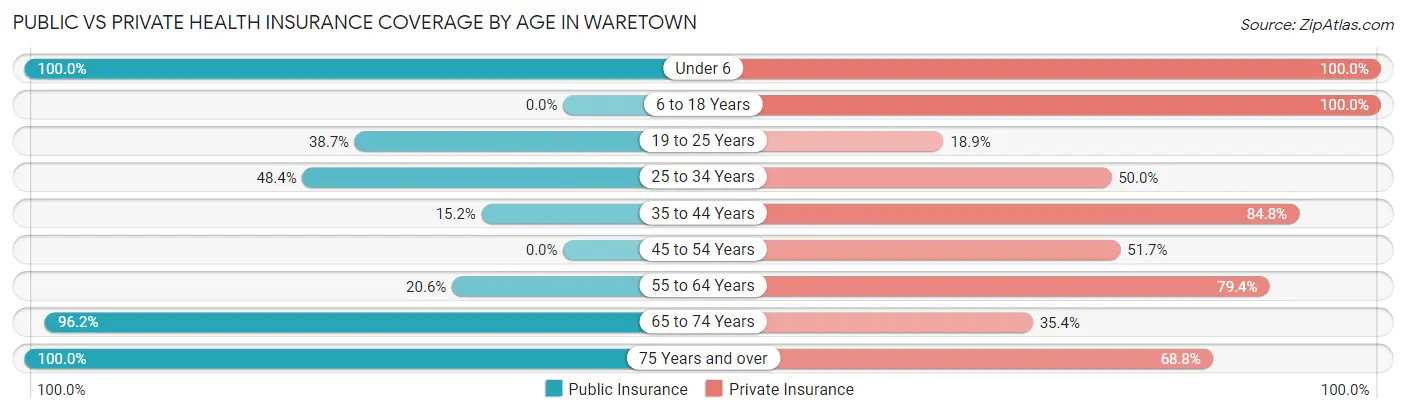
| Age Bracket | Public Insurance | Private Insurance |
| Under 6 | 34 (100.0%) | 34 (100.0%) |
| 6 to 18 Years | 0 (0.0%) | 523 (100.0%) |
| 19 to 25 Years | 41 (38.7%) | 20 (18.9%) |
| 25 to 34 Years | 61 (48.4%) | 63 (50.0%) |
| 35 to 44 Years | 52 (15.2%) | 291 (84.8%) |
| 45 to 54 Years | 0 (0.0%) | 121 (51.7%) |
| 55 to 64 Years | 58 (20.6%) | 223 (79.4%) |
| 65 to 74 Years | 380 (96.2%) | 140 (35.4%) |
| 75 Years and over | 215 (100.0%) | 148 (68.8%) |
| Total | 841 (37.3%) | 1,563 (69.3%) |
Disability Status by Sex by Age in Waretown
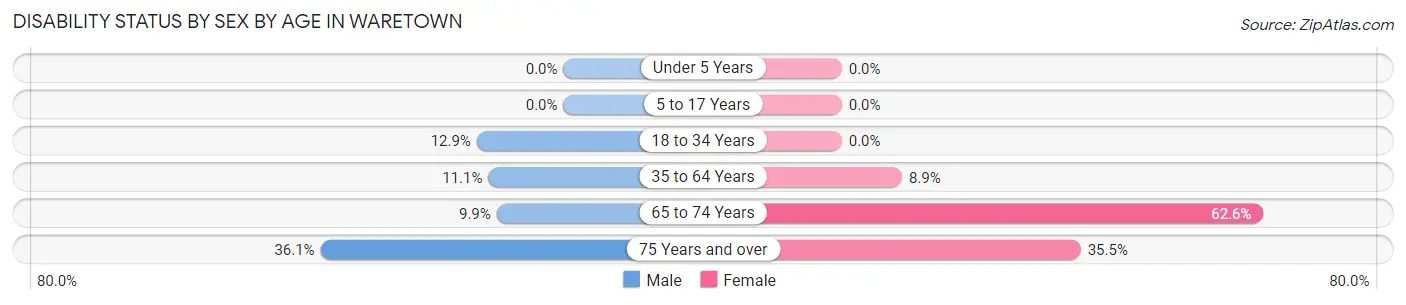
| Age Bracket | Male | Female |
| Under 5 Years | 0 (0.0%) | 0 (0.0%) |
| 5 to 17 Years | 0 (0.0%) | 0 (0.0%) |
| 18 to 34 Years | 22 (12.9%) | 0 (0.0%) |
| 35 to 64 Years | 37 (11.1%) | 47 (8.9%) |
| 65 to 74 Years | 23 (9.9%) | 102 (62.6%) |
| 75 Years and over | 44 (36.1%) | 33 (35.5%) |
Disability Class by Sex by Age in Waretown
Disability Class: Hearing Difficulty
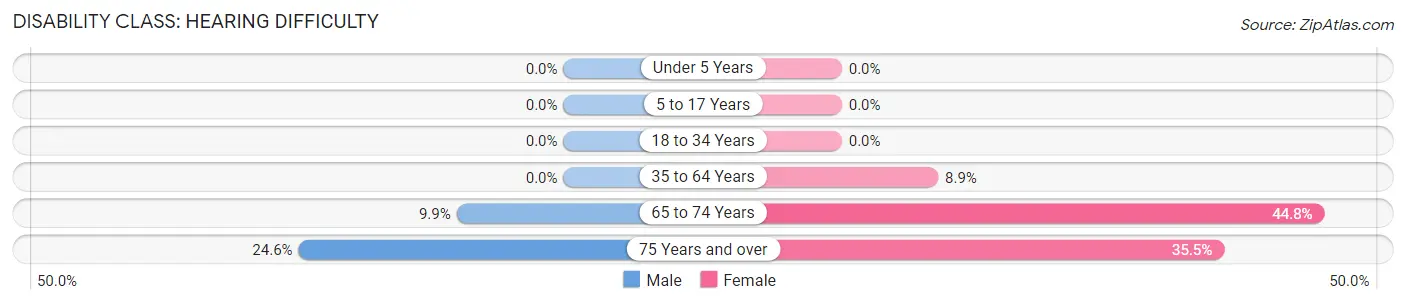
| Age Bracket | Male | Female |
| Under 5 Years | 0 (0.0%) | 0 (0.0%) |
| 5 to 17 Years | 0 (0.0%) | 0 (0.0%) |
| 18 to 34 Years | 0 (0.0%) | 0 (0.0%) |
| 35 to 64 Years | 0 (0.0%) | 47 (8.9%) |
| 65 to 74 Years | 23 (9.9%) | 73 (44.8%) |
| 75 Years and over | 30 (24.6%) | 33 (35.5%) |
Disability Class: Vision Difficulty
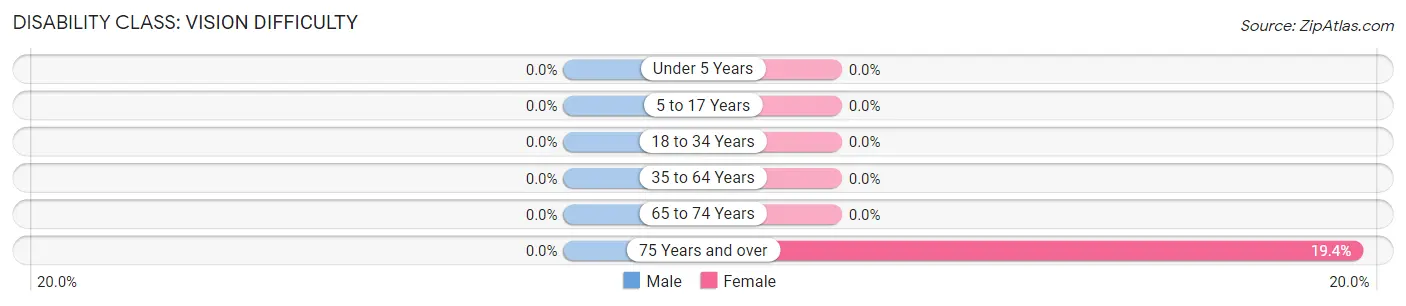
| Age Bracket | Male | Female |
| Under 5 Years | 0 (0.0%) | 0 (0.0%) |
| 5 to 17 Years | 0 (0.0%) | 0 (0.0%) |
| 18 to 34 Years | 0 (0.0%) | 0 (0.0%) |
| 35 to 64 Years | 0 (0.0%) | 0 (0.0%) |
| 65 to 74 Years | 0 (0.0%) | 0 (0.0%) |
| 75 Years and over | 0 (0.0%) | 18 (19.4%) |
Disability Class: Cognitive Difficulty
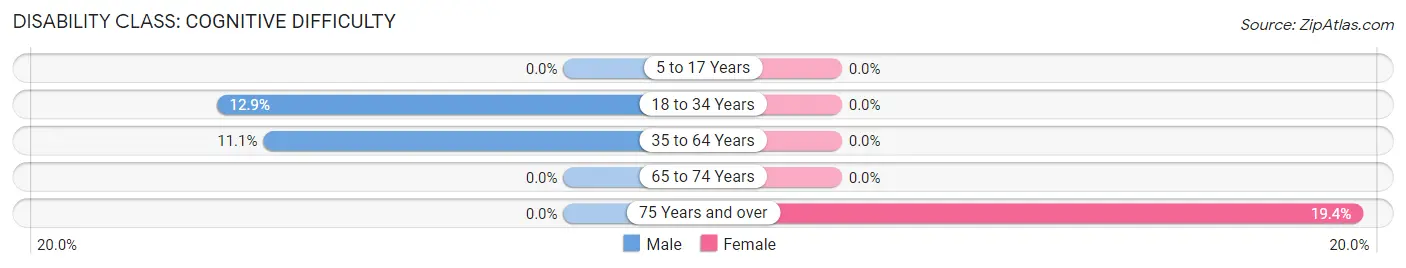
| Age Bracket | Male | Female |
| 5 to 17 Years | 0 (0.0%) | 0 (0.0%) |
| 18 to 34 Years | 22 (12.9%) | 0 (0.0%) |
| 35 to 64 Years | 37 (11.1%) | 0 (0.0%) |
| 65 to 74 Years | 0 (0.0%) | 0 (0.0%) |
| 75 Years and over | 0 (0.0%) | 18 (19.4%) |
Disability Class: Ambulatory Difficulty
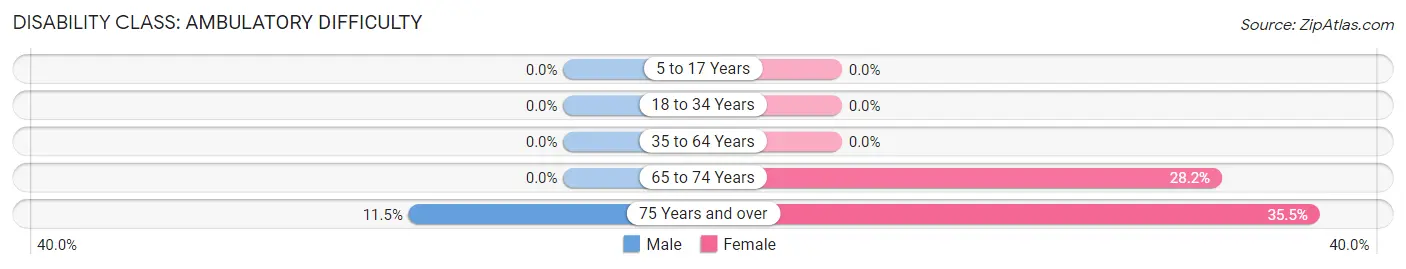
| Age Bracket | Male | Female |
| 5 to 17 Years | 0 (0.0%) | 0 (0.0%) |
| 18 to 34 Years | 0 (0.0%) | 0 (0.0%) |
| 35 to 64 Years | 0 (0.0%) | 0 (0.0%) |
| 65 to 74 Years | 0 (0.0%) | 46 (28.2%) |
| 75 Years and over | 14 (11.5%) | 33 (35.5%) |
Disability Class: Self-Care Difficulty
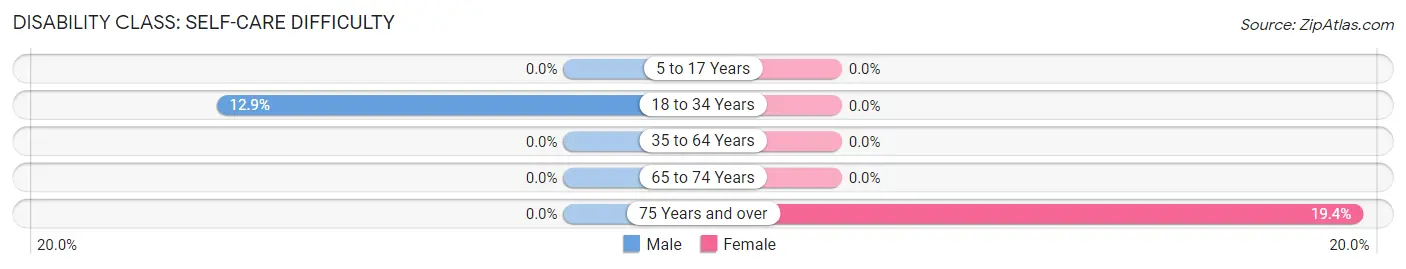
| Age Bracket | Male | Female |
| 5 to 17 Years | 0 (0.0%) | 0 (0.0%) |
| 18 to 34 Years | 22 (12.9%) | 0 (0.0%) |
| 35 to 64 Years | 0 (0.0%) | 0 (0.0%) |
| 65 to 74 Years | 0 (0.0%) | 0 (0.0%) |
| 75 Years and over | 0 (0.0%) | 18 (19.4%) |
Technology Access in Waretown
Computing Device Access in Waretown
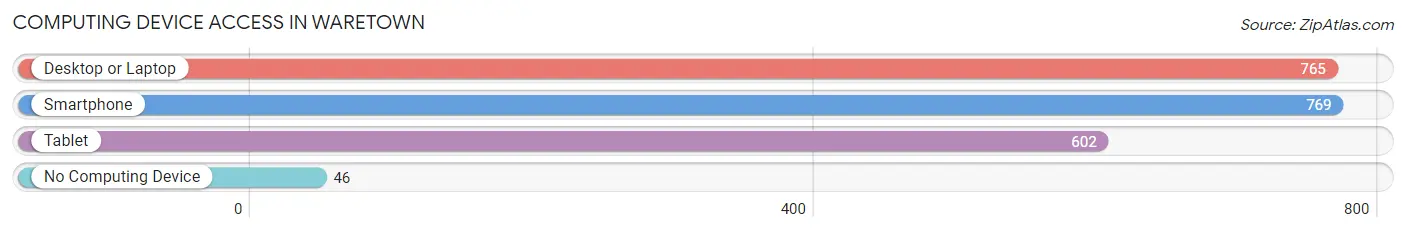
| Device Type | # Households | % Households |
| Desktop or Laptop | 765 | 88.9% |
| Smartphone | 769 | 89.4% |
| Tablet | 602 | 70.0% |
| No Computing Device | 46 | 5.3% |
| Total | 860 | 100.0% |
Internet Access in Waretown
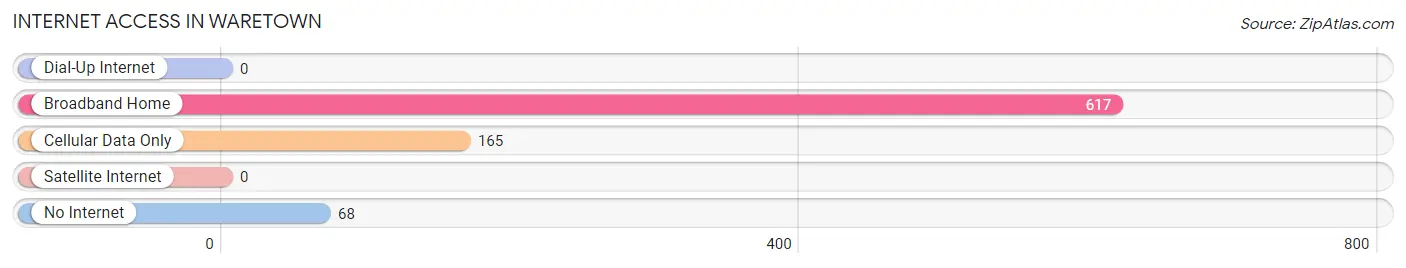
| Internet Type | # Households | % Households |
| Dial-Up Internet | 0 | 0.0% |
| Broadband Home | 617 | 71.7% |
| Cellular Data Only | 165 | 19.2% |
| Satellite Internet | 0 | 0.0% |
| No Internet | 68 | 7.9% |
| Total | 860 | 100.0% |
Waretown Summary
Waretown is a small unincorporated community located in Ocean County, New Jersey. It is situated in the northern part of the county, just south of Barnegat Bay. The town is bordered by Barnegat Township to the north, Little Egg Harbor Township to the south, and Stafford Township to the west. Waretown is home to a population of approximately 4,000 people, and is part of the larger Ocean County region.
History
The area that is now Waretown was originally inhabited by the Lenape Native Americans. The first European settlers arrived in the area in the late 17th century, and the town was officially established in 1798. The town was named after a local landowner, John Ware, who owned a large tract of land in the area.
In the 19th century, Waretown was a thriving agricultural community, with many farms and orchards. The town was also home to several small businesses, including a sawmill, a gristmill, and a blacksmith shop.
In the early 20th century, Waretown began to experience a period of growth and development. The town was connected to the rest of Ocean County by a trolley line, and several new businesses opened in the area. The town also became a popular summer destination for vacationers from nearby cities.
Geography
Waretown is located in northern Ocean County, just south of Barnegat Bay. The town is bordered by Barnegat Township to the north, Little Egg Harbor Township to the south, and Stafford Township to the west. The town is situated on a flat coastal plain, with an average elevation of just 10 feet above sea level.
The town is home to several small lakes and ponds, including Lake Waretown, Lake Barnegat, and Lake Osborn. The town is also home to several small creeks and streams, including Cedar Creek, Osborn Creek, and Waretown Creek.
Economy
The economy of Waretown is largely based on tourism and retail. The town is home to several small businesses, including restaurants, shops, and other retail establishments. The town is also home to several marinas, which provide services to boaters and fishermen.
The town is also home to several light industrial businesses, including a plastics factory and a printing company. The town is also home to a small airport, which provides services to private pilots and small aircraft.
Demographics
As of the 2010 census, Waretown had a population of 4,000 people. The town is predominantly white, with a small Hispanic population. The median household income in the town is $50,000, and the median home value is $200,000.
The town is home to several churches, including the Waretown United Methodist Church, the Waretown Presbyterian Church, and the Waretown Baptist Church. The town is also home to several schools, including the Waretown Elementary School, the Waretown Middle School, and the Waretown High School.
Conclusion
Waretown is a small unincorporated community located in Ocean County, New Jersey. It is situated in the northern part of the county, just south of Barnegat Bay. The town is home to a population of approximately 4,000 people, and is part of the larger Ocean County region. The economy of Waretown is largely based on tourism and retail, and the town is home to several small businesses, marinas, and light industrial businesses. The town is predominantly white, with a small Hispanic population, and the median household income is $50,000. Waretown is home to several churches and schools, and is a popular summer destination for vacationers from nearby cities.
Common Questions
What is Per Capita Income in Waretown?
Per Capita income in Waretown is $41,061.
What is the Median Family Income in Waretown?
Median Family Income in Waretown is $99,588.
What is the Median Household income in Waretown?
Median Household Income in Waretown is $101,500.
What is Income or Wage Gap in Waretown?
Income or Wage Gap in Waretown is 20.7%.
Women in Waretown earn 79.3 cents for every dollar earned by a man.
What is Inequality or Gini Index in Waretown?
Inequality or Gini Index in Waretown is 0.33.
What is the Total Population of Waretown?
Total Population of Waretown is 2,257.
What is the Total Male Population of Waretown?
Total Male Population of Waretown is 1,181.
What is the Total Female Population of Waretown?
Total Female Population of Waretown is 1,076.
What is the Ratio of Males per 100 Females in Waretown?
There are 109.76 Males per 100 Females in Waretown.
What is the Ratio of Females per 100 Males in Waretown?
There are 91.11 Females per 100 Males in Waretown.
What is the Median Population Age in Waretown?
Median Population Age in Waretown is 44.8 Years.
What is the Average Family Size in Waretown
Average Family Size in Waretown is 2.7 People.
What is the Average Household Size in Waretown
Average Household Size in Waretown is 2.6 People.
How Large is the Labor Force in Waretown?
There are 1,098 People in the Labor Forcein in Waretown.
What is the Percentage of People in the Labor Force in Waretown?
57.6% of People are in the Labor Force in Waretown.
What is the Unemployment Rate in Waretown?
Unemployment Rate in Waretown is 9.1%.