Rio Grande, NJ Map & Demographics
Rio Grande Map
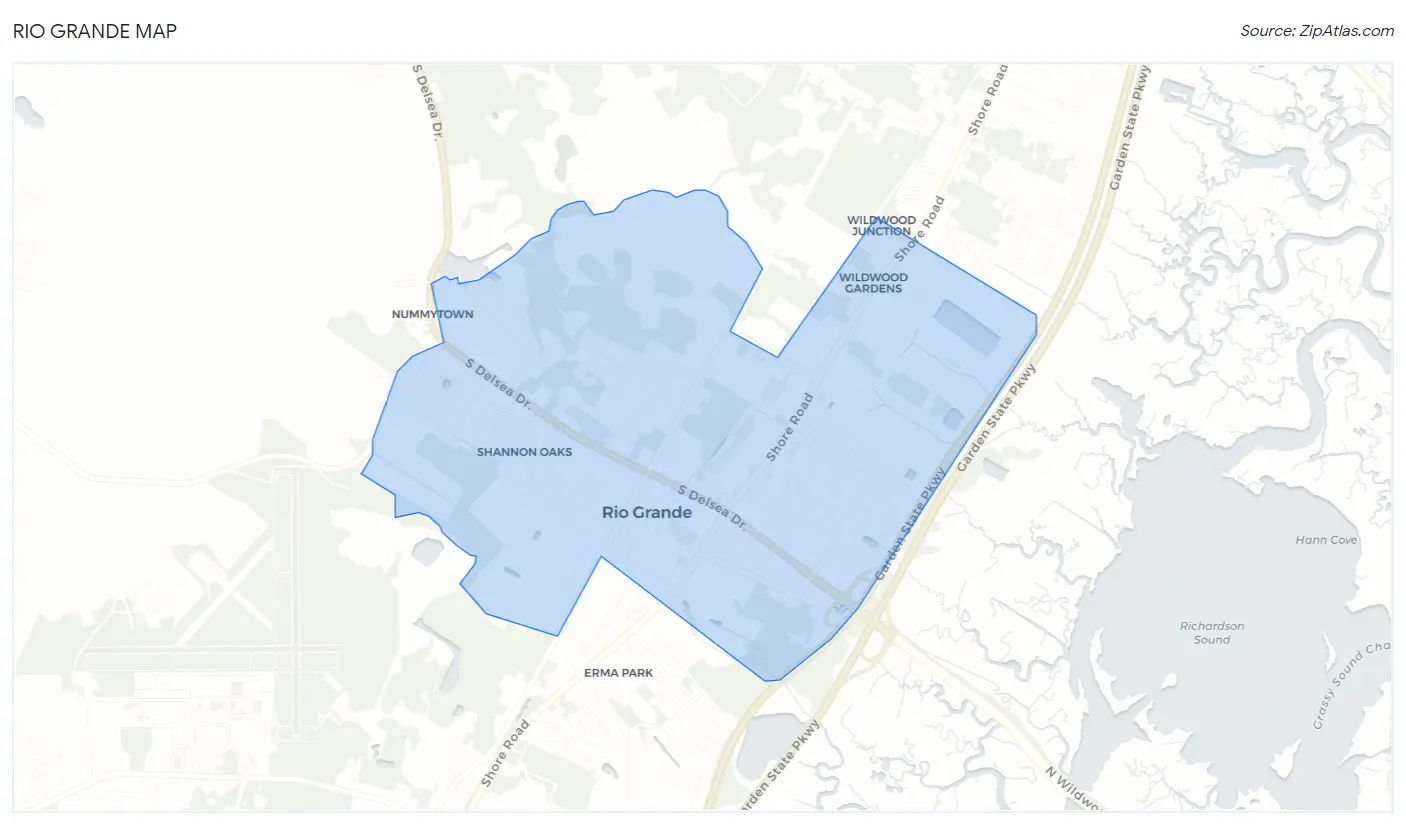
Rio Grande Overview
$47,113
PER CAPITA INCOME
$86,282
AVG FAMILY INCOME
$88,033
AVG HOUSEHOLD INCOME
0.42
INEQUALITY / GINI INDEX
3,364
TOTAL POPULATION
1,630
MALE POPULATION
1,734
FEMALE POPULATION
94.00
MALES / 100 FEMALES
106.38
FEMALES / 100 MALES
53.2
MEDIAN AGE
2.5
AVG FAMILY SIZE
2.0
AVG HOUSEHOLD SIZE
1,435
LABOR FORCE [ PEOPLE ]
50.9%
PERCENT IN LABOR FORCE
20.4%
UNEMPLOYMENT RATE
Rio Grande Zip Codes
Rio Grande Area Codes
Income in Rio Grande
Income Overview in Rio Grande
Per Capita Income in Rio Grande is $47,113, while median incomes of families and households are $86,282 and $88,033 respectively.
| Characteristic | Number | Measure |
| Per Capita Income | 3,364 | $47,113 |
| Median Family Income | 1,014 | $86,282 |
| Mean Family Income | 1,014 | $112,805 |
| Median Household Income | 1,642 | $88,033 |
| Mean Household Income | 1,642 | $95,534 |
| Income Deficit | 1,014 | $0 |
| Wage / Income Gap (%) | 3,364 | 0.00% |
| Wage / Income Gap ($) | 3,364 | 100.00¢ per $1 |
| Gini / Inequality Index | 3,364 | 0.42 |
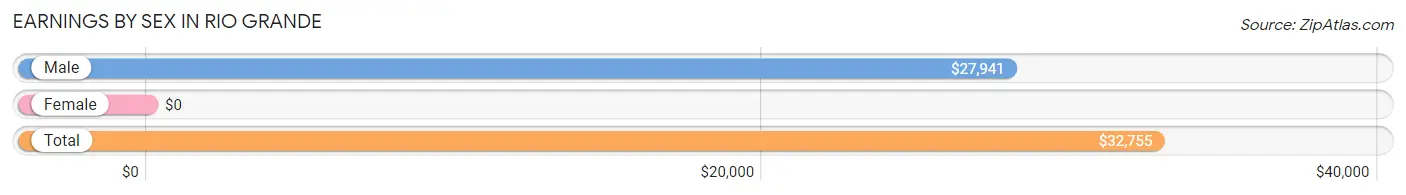
Earnings by Sex in Rio Grande
| Sex | Number | Average Earnings |
| Male | 752 (48.6%) | $27,941 |
| Female | 794 (51.4%) | $0 |
| Total | 1,546 (100.0%) | $32,755 |
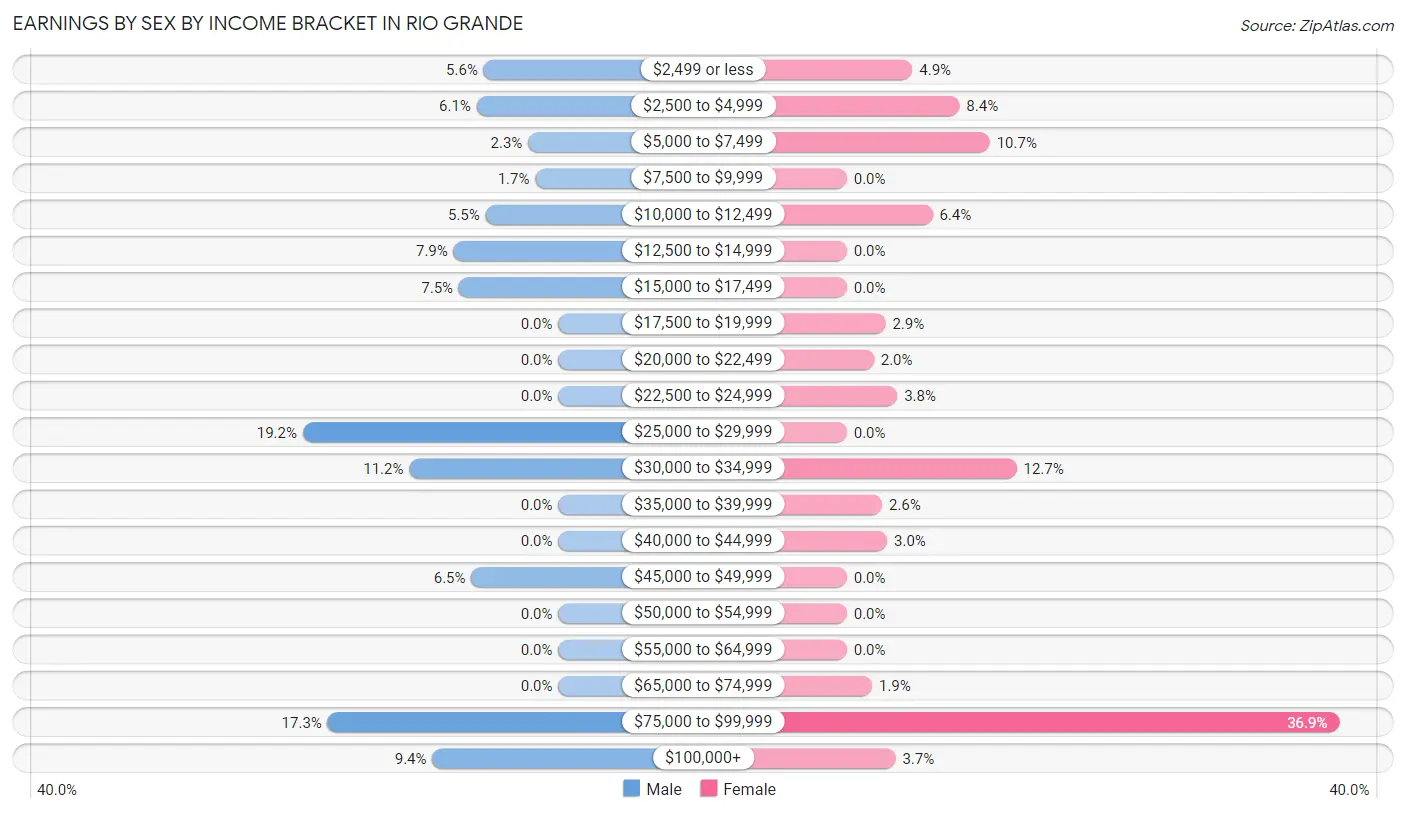
Earnings by Sex by Income Bracket in Rio Grande
The most common earnings brackets in Rio Grande are $25,000 to $29,999 for men (144 | 19.2%) and $75,000 to $99,999 for women (293 | 36.9%).
| Income | Male | Female |
| $2,499 or less | 42 (5.6%) | 39 (4.9%) |
| $2,500 to $4,999 | 46 (6.1%) | 67 (8.4%) |
| $5,000 to $7,499 | 17 (2.3%) | 85 (10.7%) |
| $7,500 to $9,999 | 13 (1.7%) | 0 (0.0%) |
| $10,000 to $12,499 | 41 (5.4%) | 51 (6.4%) |
| $12,500 to $14,999 | 59 (7.9%) | 0 (0.0%) |
| $15,000 to $17,499 | 56 (7.4%) | 0 (0.0%) |
| $17,500 to $19,999 | 0 (0.0%) | 23 (2.9%) |
| $20,000 to $22,499 | 0 (0.0%) | 16 (2.0%) |
| $22,500 to $24,999 | 0 (0.0%) | 30 (3.8%) |
| $25,000 to $29,999 | 144 (19.2%) | 0 (0.0%) |
| $30,000 to $34,999 | 84 (11.2%) | 101 (12.7%) |
| $35,000 to $39,999 | 0 (0.0%) | 21 (2.6%) |
| $40,000 to $44,999 | 0 (0.0%) | 24 (3.0%) |
| $45,000 to $49,999 | 49 (6.5%) | 0 (0.0%) |
| $50,000 to $54,999 | 0 (0.0%) | 0 (0.0%) |
| $55,000 to $64,999 | 0 (0.0%) | 0 (0.0%) |
| $65,000 to $74,999 | 0 (0.0%) | 15 (1.9%) |
| $75,000 to $99,999 | 130 (17.3%) | 293 (36.9%) |
| $100,000+ | 71 (9.4%) | 29 (3.6%) |
| Total | 752 (100.0%) | 794 (100.0%) |
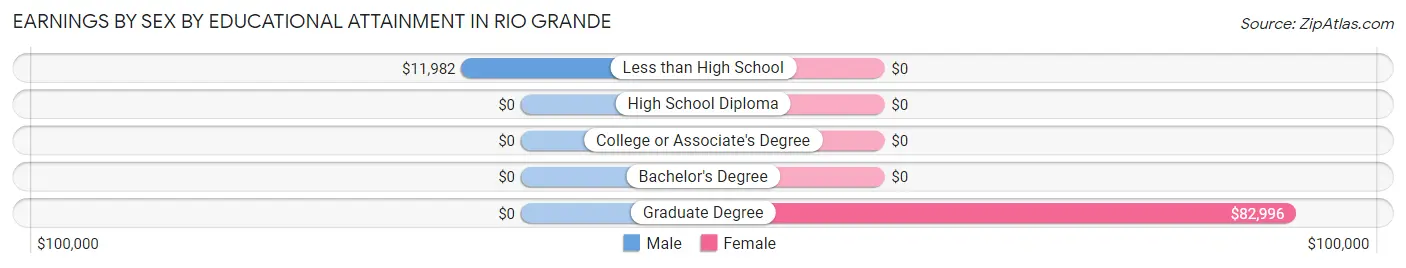
Earnings by Sex by Educational Attainment in Rio Grande
| Educational Attainment | Male Income | Female Income |
| Less than High School | $11,982 | $0 |
| High School Diploma | - | - |
| College or Associate's Degree | - | - |
| Bachelor's Degree | - | - |
| Graduate Degree | - | - |
| Total | $28,922 | $0 |
Family Income in Rio Grande
Family Income Brackets in Rio Grande
According to the Rio Grande family income data, there are 254 families falling into the $75,000 to $99,999 income range, which is the most common income bracket and makes up 25.1% of all families.
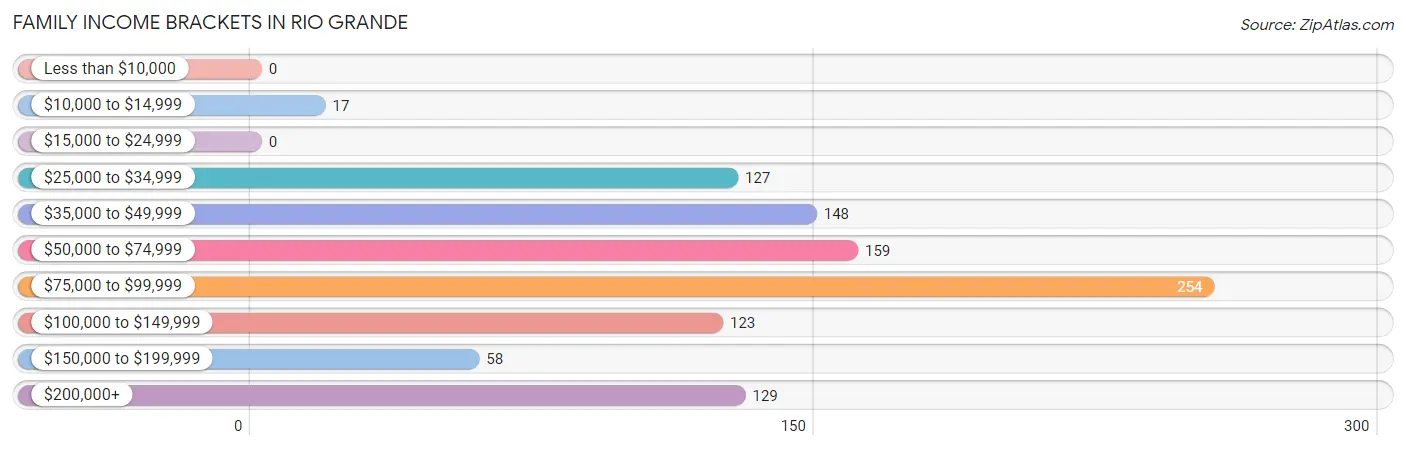
| Income Bracket | # Families | % Families |
| Less than $10,000 | 0 | 0.0% |
| $10,000 to $14,999 | 17 | 1.7% |
| $15,000 to $24,999 | 0 | 0.0% |
| $25,000 to $34,999 | 127 | 12.5% |
| $35,000 to $49,999 | 148 | 14.6% |
| $50,000 to $74,999 | 159 | 15.7% |
| $75,000 to $99,999 | 254 | 25.0% |
| $100,000 to $149,999 | 123 | 12.1% |
| $150,000 to $199,999 | 58 | 5.7% |
| $200,000+ | 129 | 12.7% |
Family Income by Famaliy Size in Rio Grande
2-person families (789 | 77.8%) account for the highest median family income in Rio Grande with $89,283 per family, while 2-person families (789 | 77.8%) have the highest median income of $44,642 per family member.
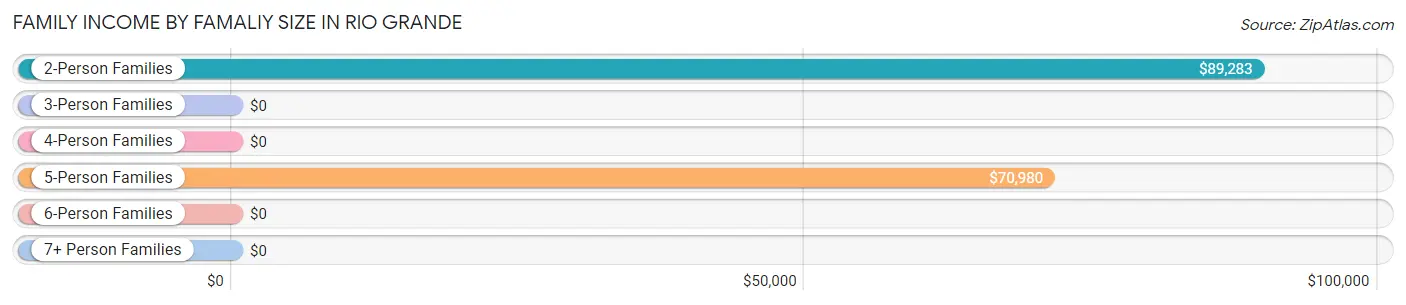
| Income Bracket | # Families | Median Income |
| 2-Person Families | 789 (77.8%) | $89,283 |
| 3-Person Families | 46 (4.5%) | $0 |
| 4-Person Families | 38 (3.7%) | $0 |
| 5-Person Families | 141 (13.9%) | $70,980 |
| 6-Person Families | 0 (0.0%) | $0 |
| 7+ Person Families | 0 (0.0%) | $0 |
| Total | 1,014 (100.0%) | $86,282 |
Family Income by Number of Earners in Rio Grande
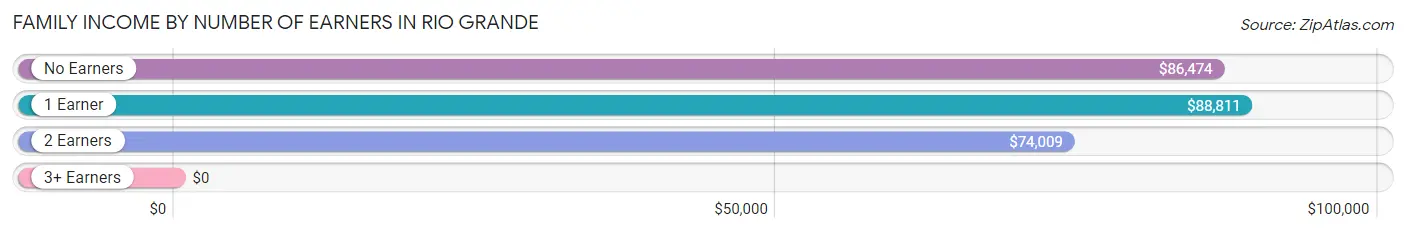
| Number of Earners | # Families | Median Income |
| No Earners | 258 (25.4%) | $86,474 |
| 1 Earner | 448 (44.2%) | $88,811 |
| 2 Earners | 240 (23.7%) | $74,009 |
| 3+ Earners | 68 (6.7%) | $0 |
| Total | 1,014 (100.0%) | $86,282 |
Household Income in Rio Grande
Household Income Brackets in Rio Grande
With 397 households falling in the category, the $75,000 to $99,999 income range is the most frequent in Rio Grande, accounting for 24.2% of all households. In contrast, only 34 households (2.1%) fall into the less than $10,000 income bracket, making it the least populous group.
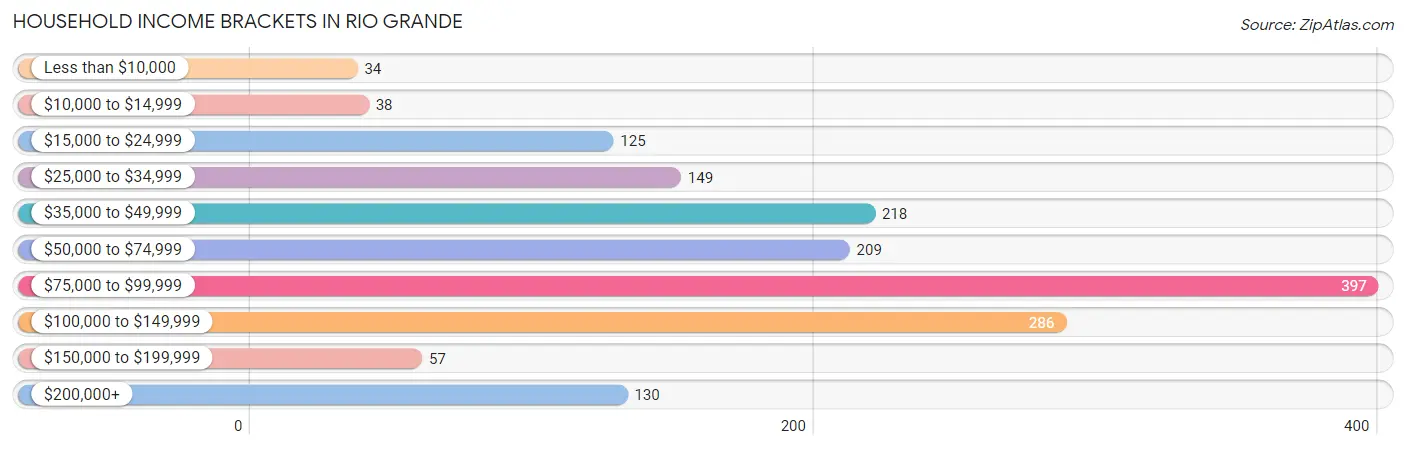
| Income Bracket | # Households | % Households |
| Less than $10,000 | 34 | 2.1% |
| $10,000 to $14,999 | 38 | 2.3% |
| $15,000 to $24,999 | 125 | 7.6% |
| $25,000 to $34,999 | 149 | 9.1% |
| $35,000 to $49,999 | 218 | 13.3% |
| $50,000 to $74,999 | 209 | 12.7% |
| $75,000 to $99,999 | 397 | 24.2% |
| $100,000 to $149,999 | 286 | 17.4% |
| $150,000 to $199,999 | 57 | 3.5% |
| $200,000+ | 130 | 7.9% |
Household Income by Householder Age in Rio Grande
The median household income in Rio Grande is $88,033, with the highest median household income of $92,889 found in the 45 to 64 years age bracket for the primary householder. A total of 691 households (42.1%) fall into this category.
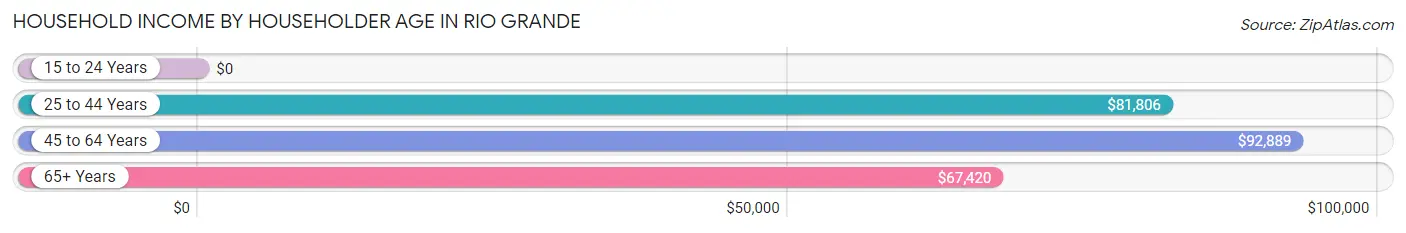
| Income Bracket | # Households | Median Income |
| 15 to 24 Years | 0 (0.0%) | $0 |
| 25 to 44 Years | 238 (14.5%) | $81,806 |
| 45 to 64 Years | 691 (42.1%) | $92,889 |
| 65+ Years | 713 (43.4%) | $67,420 |
| Total | 1,642 (100.0%) | $88,033 |
Poverty in Rio Grande
Income Below Poverty by Sex and Age in Rio Grande
With 6.9% poverty level for males and 3.6% for females among the residents of Rio Grande, 55 to 64 year old males and 55 to 64 year old females are the most vulnerable to poverty, with 41 males (16.7%) and 21 females (11.3%) in their respective age groups living below the poverty level.
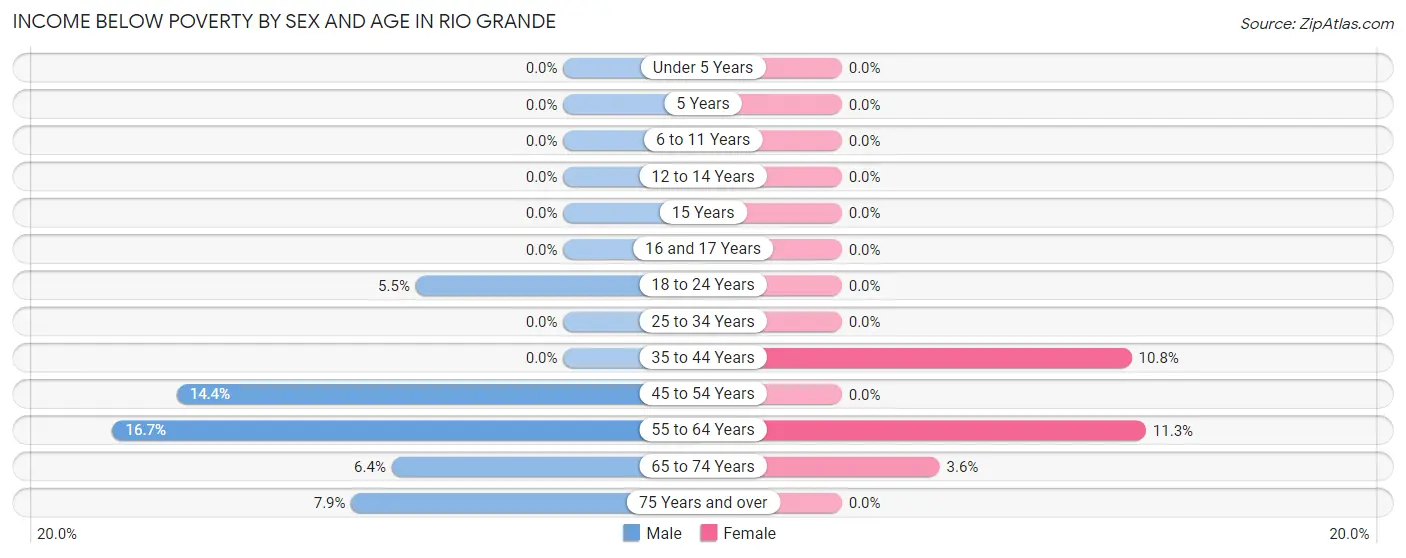
| Age Bracket | Male | Female |
| Under 5 Years | 0 (0.0%) | 0 (0.0%) |
| 5 Years | 0 (0.0%) | 0 (0.0%) |
| 6 to 11 Years | 0 (0.0%) | 0 (0.0%) |
| 12 to 14 Years | 0 (0.0%) | 0 (0.0%) |
| 15 Years | 0 (0.0%) | 0 (0.0%) |
| 16 and 17 Years | 0 (0.0%) | 0 (0.0%) |
| 18 to 24 Years | 8 (5.5%) | 0 (0.0%) |
| 25 to 34 Years | 0 (0.0%) | 0 (0.0%) |
| 35 to 44 Years | 0 (0.0%) | 24 (10.8%) |
| 45 to 54 Years | 34 (14.3%) | 0 (0.0%) |
| 55 to 64 Years | 41 (16.7%) | 21 (11.3%) |
| 65 to 74 Years | 20 (6.4%) | 17 (3.6%) |
| 75 Years and over | 10 (7.9%) | 0 (0.0%) |
| Total | 113 (6.9%) | 62 (3.6%) |
Income Above Poverty by Sex and Age in Rio Grande
According to the poverty statistics in Rio Grande, males aged 6 to 11 years and females aged under 5 years are the age groups that are most secure financially, with 100.0% of males and 100.0% of females in these age groups living above the poverty line.
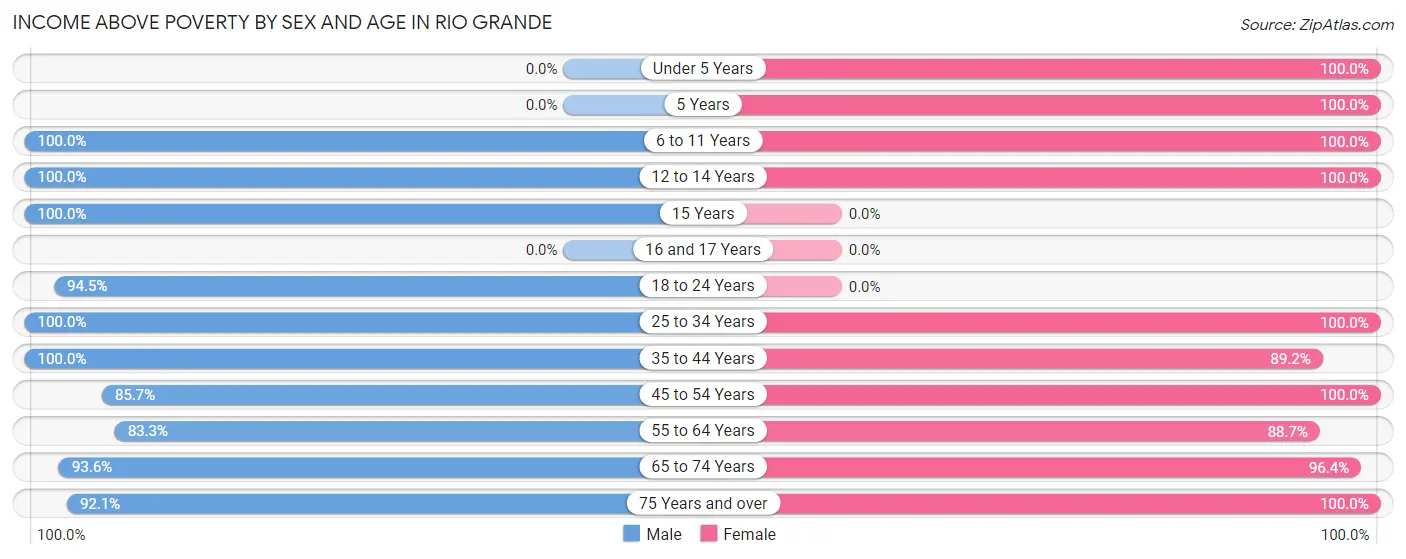
| Age Bracket | Male | Female |
| Under 5 Years | 0 (0.0%) | 101 (100.0%) |
| 5 Years | 0 (0.0%) | 34 (100.0%) |
| 6 to 11 Years | 26 (100.0%) | 92 (100.0%) |
| 12 to 14 Years | 99 (100.0%) | 92 (100.0%) |
| 15 Years | 101 (100.0%) | 0 (0.0%) |
| 16 and 17 Years | 0 (0.0%) | 0 (0.0%) |
| 18 to 24 Years | 138 (94.5%) | 0 (0.0%) |
| 25 to 34 Years | 121 (100.0%) | 58 (100.0%) |
| 35 to 44 Years | 214 (100.0%) | 199 (89.2%) |
| 45 to 54 Years | 203 (85.7%) | 300 (100.0%) |
| 55 to 64 Years | 204 (83.3%) | 165 (88.7%) |
| 65 to 74 Years | 294 (93.6%) | 451 (96.4%) |
| 75 Years and over | 117 (92.1%) | 180 (100.0%) |
| Total | 1,517 (93.1%) | 1,672 (96.4%) |
Income Below Poverty Among Married-Couple Families in Rio Grande
The poverty statistics for married-couple families in Rio Grande show that 2.5% or 17 of the total 693 families live below the poverty line. Families with no children have the highest poverty rate of 3.3%, comprising of 17 families. On the other hand, families with 1 or 2 children have the lowest poverty rate of 0.0%, which includes 0 families.
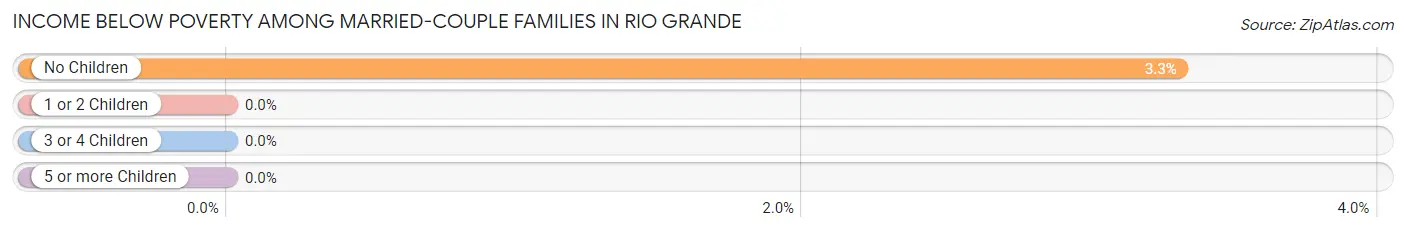
| Children | Above Poverty | Below Poverty |
| No Children | 497 (96.7%) | 17 (3.3%) |
| 1 or 2 Children | 38 (100.0%) | 0 (0.0%) |
| 3 or 4 Children | 141 (100.0%) | 0 (0.0%) |
| 5 or more Children | 0 (0.0%) | 0 (0.0%) |
| Total | 676 (97.6%) | 17 (2.5%) |
Income Below Poverty Among Single-Parent Households in Rio Grande
| Children | Single Father | Single Mother |
| No Children | 0 (0.0%) | 0 (0.0%) |
| 1 or 2 Children | 0 (0.0%) | 0 (0.0%) |
| 3 or 4 Children | 0 (0.0%) | 0 (0.0%) |
| 5 or more Children | 0 (0.0%) | 0 (0.0%) |
| Total | 0 (0.0%) | 0 (0.0%) |
Income Below Poverty Among Married-Couple vs Single-Parent Households in Rio Grande
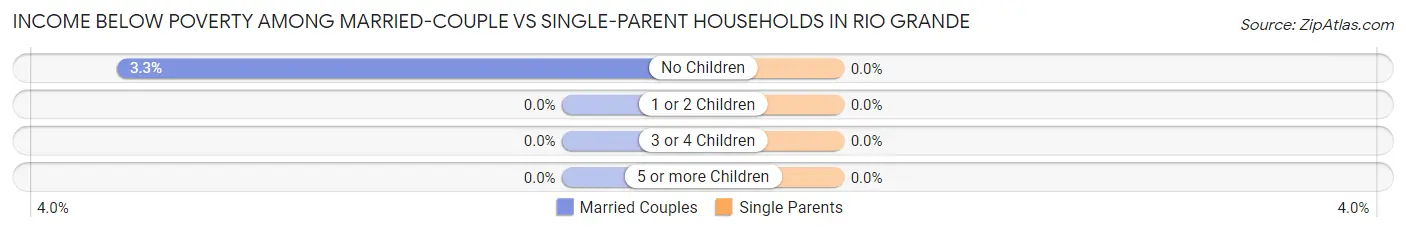
| Children | Married-Couple Families | Single-Parent Households |
| No Children | 17 (3.3%) | 0 (0.0%) |
| 1 or 2 Children | 0 (0.0%) | 0 (0.0%) |
| 3 or 4 Children | 0 (0.0%) | 0 (0.0%) |
| 5 or more Children | 0 (0.0%) | 0 (0.0%) |
| Total | 17 (2.5%) | 0 (0.0%) |
Race in Rio Grande
The most populous races in Rio Grande are White / Caucasian (2,285 | 67.9%), Hispanic or Latino (621 | 18.5%), and Some other Race (391 | 11.6%).
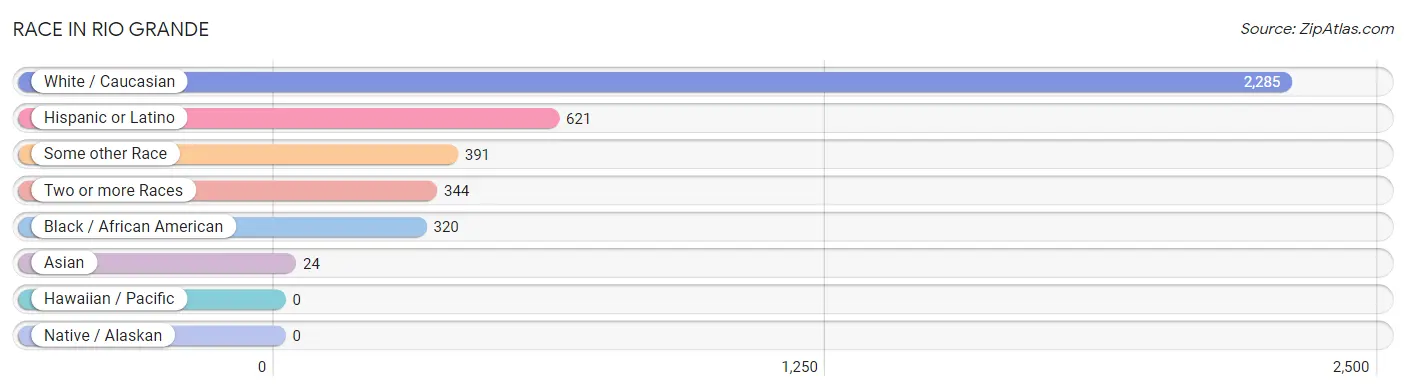
| Race | # Population | % Population |
| Asian | 24 | 0.7% |
| Black / African American | 320 | 9.5% |
| Hawaiian / Pacific | 0 | 0.0% |
| Hispanic or Latino | 621 | 18.5% |
| Native / Alaskan | 0 | 0.0% |
| White / Caucasian | 2,285 | 67.9% |
| Two or more Races | 344 | 10.2% |
| Some other Race | 391 | 11.6% |
| Total | 3,364 | 100.0% |
Ancestry in Rio Grande
The most populous ancestries reported in Rio Grande are Irish (882 | 26.2%), Puerto Rican (507 | 15.1%), English (462 | 13.7%), German (459 | 13.6%), and Italian (449 | 13.4%), together accounting for 82.0% of all Rio Grande residents.
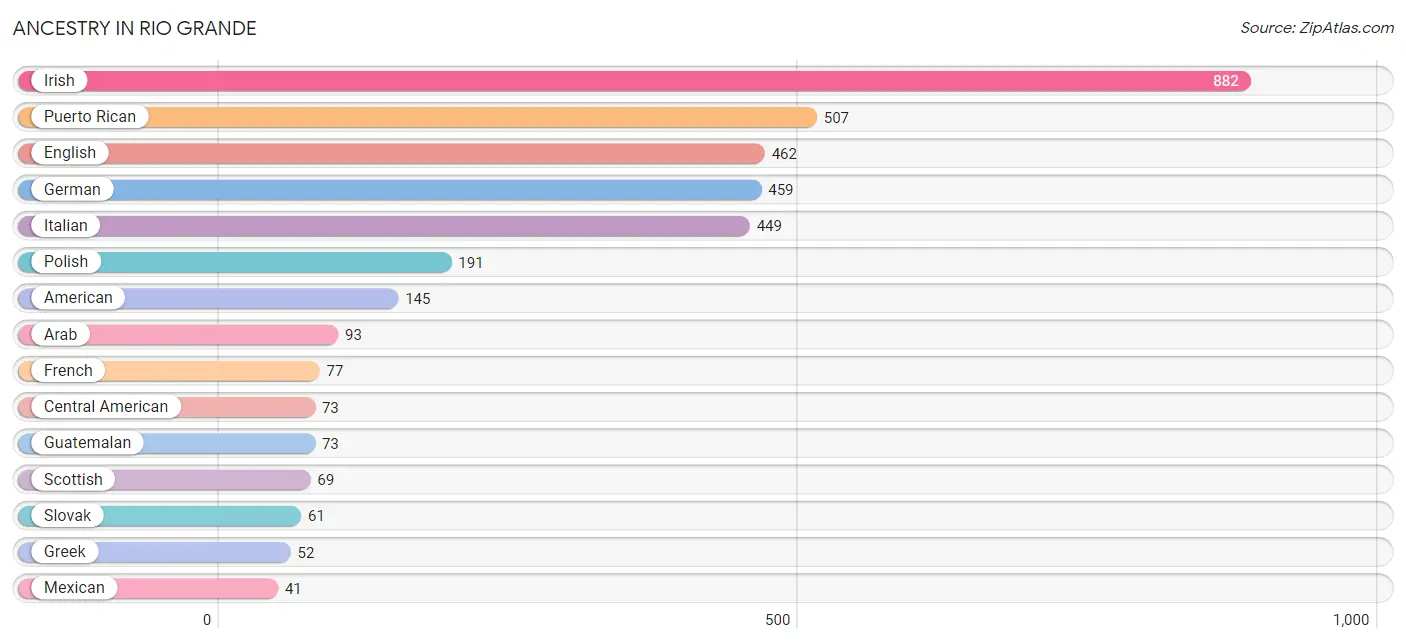
| Ancestry | # Population | % Population |
| American | 145 | 4.3% |
| Arab | 93 | 2.8% |
| Central American | 73 | 2.2% |
| English | 462 | 13.7% |
| French | 77 | 2.3% |
| German | 459 | 13.6% |
| Greek | 52 | 1.5% |
| Guatemalan | 73 | 2.2% |
| Irish | 882 | 26.2% |
| Italian | 449 | 13.4% |
| Korean | 24 | 0.7% |
| Lithuanian | 7 | 0.2% |
| Mexican | 41 | 1.2% |
| Pakistani | 33 | 1.0% |
| Pennsylvania German | 22 | 0.6% |
| Polish | 191 | 5.7% |
| Puerto Rican | 507 | 15.1% |
| Scotch-Irish | 10 | 0.3% |
| Scottish | 69 | 2.1% |
| Slovak | 61 | 1.8% |
| Ukrainian | 18 | 0.5% |
| Welsh | 15 | 0.4% | View All 22 Rows |
Immigrants in Rio Grande
The most numerous immigrant groups reported in Rio Grande came from Central America (73 | 2.2%), Guatemala (73 | 2.2%), Latin America (73 | 2.2%), Asia (24 | 0.7%), and Philippines (24 | 0.7%), together accounting for 7.9% of all Rio Grande residents.
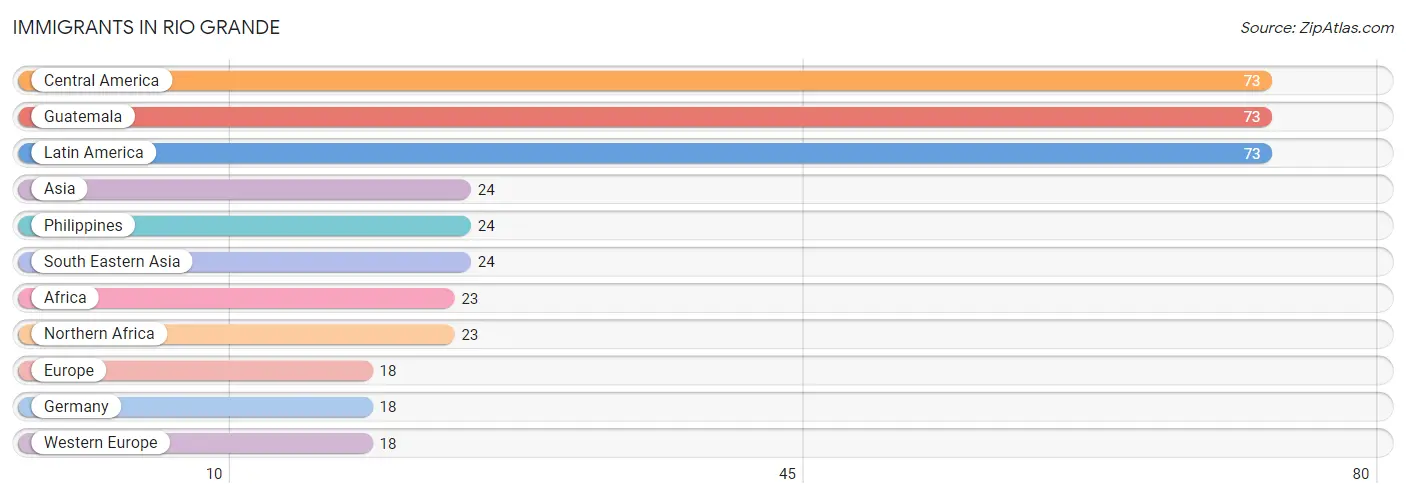
| Immigration Origin | # Population | % Population |
| Africa | 23 | 0.7% |
| Asia | 24 | 0.7% |
| Central America | 73 | 2.2% |
| Europe | 18 | 0.5% |
| Germany | 18 | 0.5% |
| Guatemala | 73 | 2.2% |
| Latin America | 73 | 2.2% |
| Northern Africa | 23 | 0.7% |
| Philippines | 24 | 0.7% |
| South Eastern Asia | 24 | 0.7% |
| Western Europe | 18 | 0.5% | View All 11 Rows |
Sex and Age in Rio Grande
Sex and Age in Rio Grande
The most populous age groups in Rio Grande are 70 to 74 Years (253 | 15.5%) for men and 50 to 54 Years (276 | 15.9%) for women.
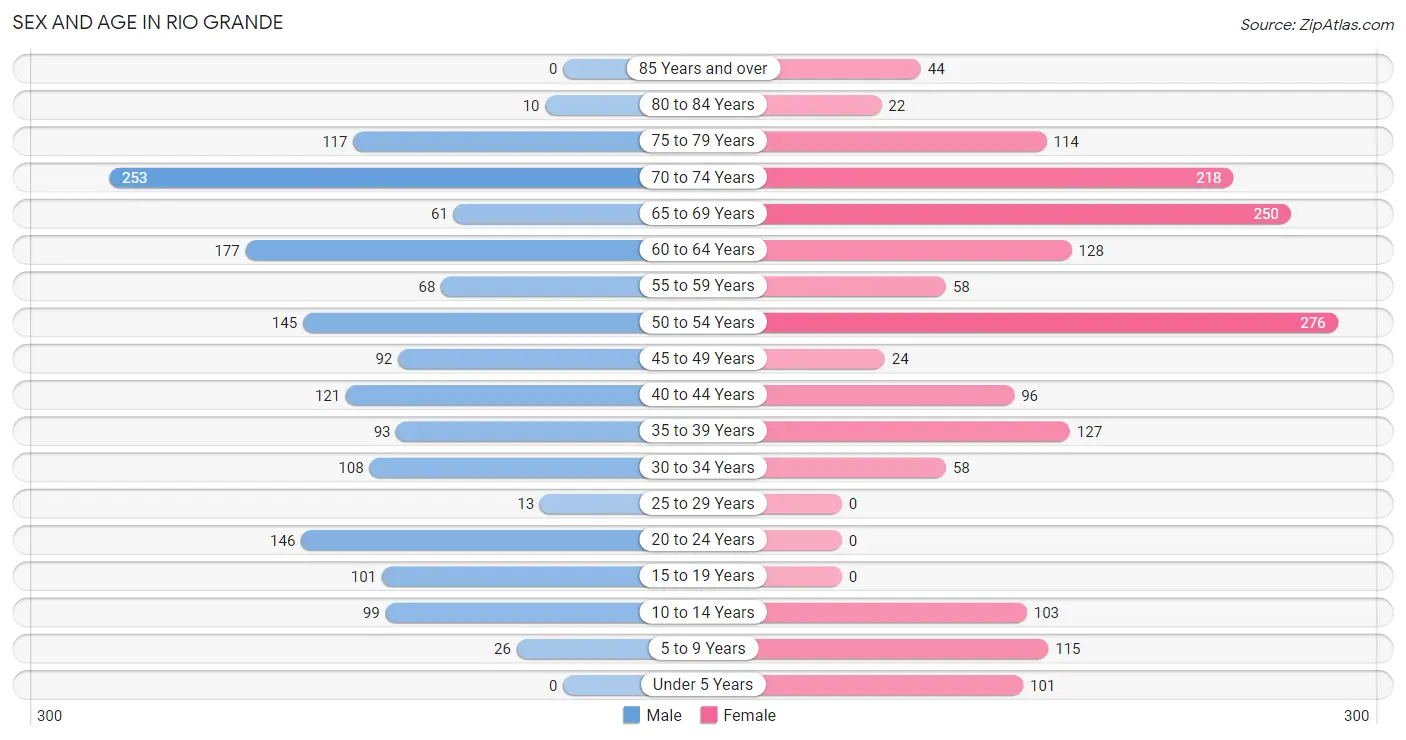
| Age Bracket | Male | Female |
| Under 5 Years | 0 (0.0%) | 101 (5.8%) |
| 5 to 9 Years | 26 (1.6%) | 115 (6.6%) |
| 10 to 14 Years | 99 (6.1%) | 103 (5.9%) |
| 15 to 19 Years | 101 (6.2%) | 0 (0.0%) |
| 20 to 24 Years | 146 (9.0%) | 0 (0.0%) |
| 25 to 29 Years | 13 (0.8%) | 0 (0.0%) |
| 30 to 34 Years | 108 (6.6%) | 58 (3.3%) |
| 35 to 39 Years | 93 (5.7%) | 127 (7.3%) |
| 40 to 44 Years | 121 (7.4%) | 96 (5.5%) |
| 45 to 49 Years | 92 (5.6%) | 24 (1.4%) |
| 50 to 54 Years | 145 (8.9%) | 276 (15.9%) |
| 55 to 59 Years | 68 (4.2%) | 58 (3.3%) |
| 60 to 64 Years | 177 (10.9%) | 128 (7.4%) |
| 65 to 69 Years | 61 (3.7%) | 250 (14.4%) |
| 70 to 74 Years | 253 (15.5%) | 218 (12.6%) |
| 75 to 79 Years | 117 (7.2%) | 114 (6.6%) |
| 80 to 84 Years | 10 (0.6%) | 22 (1.3%) |
| 85 Years and over | 0 (0.0%) | 44 (2.5%) |
| Total | 1,630 (100.0%) | 1,734 (100.0%) |
Families and Households in Rio Grande
Median Family Size in Rio Grande
The median family size in Rio Grande is 2.55 persons per family, with married-couple families (693 | 68.3%) accounting for the largest median family size of 2.82 persons per family. On the other hand, single male/father families (105 | 10.4%) represent the smallest median family size with 1.90 persons per family.
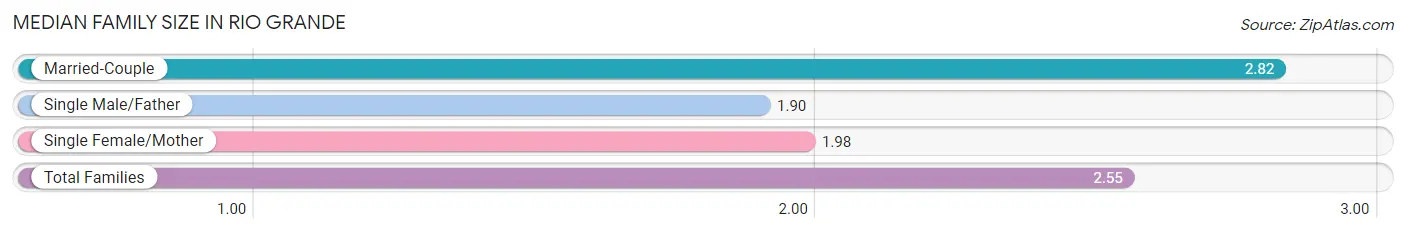
| Family Type | # Families | Family Size |
| Married-Couple | 693 (68.3%) | 2.82 |
| Single Male/Father | 105 (10.4%) | 1.90 |
| Single Female/Mother | 216 (21.3%) | 1.98 |
| Total Families | 1,014 (100.0%) | 2.55 |
Median Household Size in Rio Grande
The median household size in Rio Grande is 2.03 persons per household, with married-couple households (693 | 42.2%) accounting for the largest median household size of 2.82 persons per household. non-family households (628 | 38.3%) represent the smallest median household size with 1.03 persons per household.
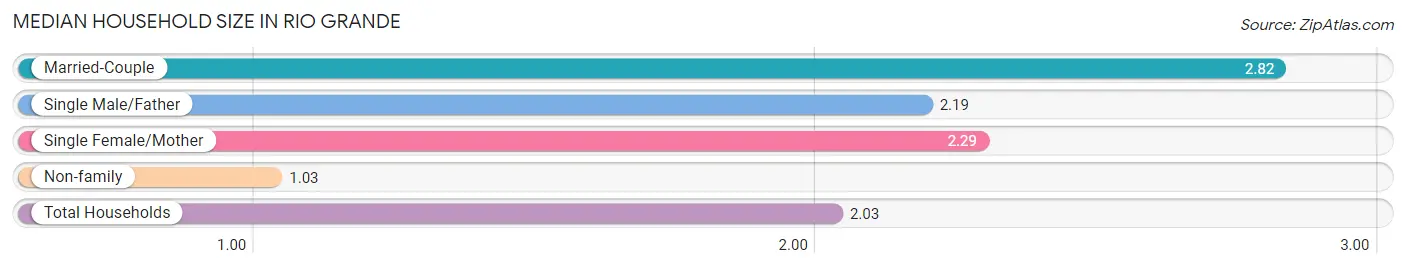
| Household Type | # Households | Household Size |
| Married-Couple | 693 (42.2%) | 2.82 |
| Single Male/Father | 105 (6.4%) | 2.19 |
| Single Female/Mother | 216 (13.2%) | 2.29 |
| Non-family | 628 (38.3%) | 1.03 |
| Total Households | 1,642 (100.0%) | 2.03 |
Household Size by Marriage Status in Rio Grande
Out of a total of 1,642 households in Rio Grande, 1,014 (61.8%) are family households, while 628 (38.3%) are nonfamily households. The most numerous type of family households are 2-person households, comprising 663, and the most common type of nonfamily households are 1-person households, comprising 606.
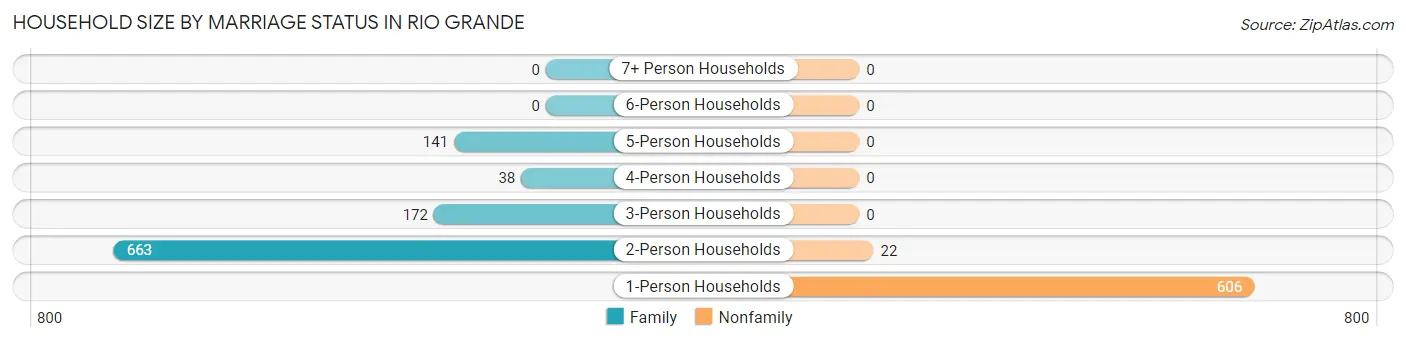
| Household Size | Family Households | Nonfamily Households |
| 1-Person Households | - | 606 (36.9%) |
| 2-Person Households | 663 (40.4%) | 22 (1.3%) |
| 3-Person Households | 172 (10.5%) | 0 (0.0%) |
| 4-Person Households | 38 (2.3%) | 0 (0.0%) |
| 5-Person Households | 141 (8.6%) | 0 (0.0%) |
| 6-Person Households | 0 (0.0%) | 0 (0.0%) |
| 7+ Person Households | 0 (0.0%) | 0 (0.0%) |
| Total | 1,014 (61.8%) | 628 (38.3%) |
Female Fertility in Rio Grande
Fertility by Age in Rio Grande
| Age Bracket | Women with Births | Births / 1,000 Women |
| 15 to 19 years | 0 (0.0%) | 0.0 |
| 20 to 34 years | 0 (0.0%) | 0.0 |
| 35 to 50 years | 0 (0.0%) | 0.0 |
| Total | 0 (0.0%) | 0.0 |
Fertility by Age by Marriage Status in Rio Grande
| Age Bracket | Married | Unmarried |
| 15 to 19 years | 0 (0.0%) | 0 (0.0%) |
| 20 to 34 years | 0 (0.0%) | 0 (0.0%) |
| 35 to 50 years | 0 (0.0%) | 0 (0.0%) |
| Total | 0 (0.0%) | 0 (0.0%) |
Fertility by Education in Rio Grande
| Educational Attainment | Women with Births | Births / 1,000 Women |
| Less than High School | 0 (0.0%) | 0.0 |
| High School Diploma | 0 (0.0%) | 0.0 |
| College or Associate's Degree | 0 (0.0%) | 0.0 |
| Bachelor's Degree | 0 (0.0%) | 0.0 |
| Graduate Degree | 0 (0.0%) | 0.0 |
| Total | 0 (0.0%) | 0.0 |
Fertility by Education by Marriage Status in Rio Grande
| Educational Attainment | Married | Unmarried |
| Less than High School | 0 (0.0%) | 0 (0.0%) |
| High School Diploma | 0 (0.0%) | 0 (0.0%) |
| College or Associate's Degree | 0 (0.0%) | 0 (0.0%) |
| Bachelor's Degree | 0 (0.0%) | 0 (0.0%) |
| Graduate Degree | 0 (0.0%) | 0 (0.0%) |
| Total | 0 (0.0%) | 0 (0.0%) |
Employment Characteristics in Rio Grande
Employment by Class of Employer in Rio Grande
Among the 1,077 employed individuals in Rio Grande, private company employees (453 | 42.1%), local government employees (249 | 23.1%), and federal government employees (184 | 17.1%) make up the most common classes of employment.
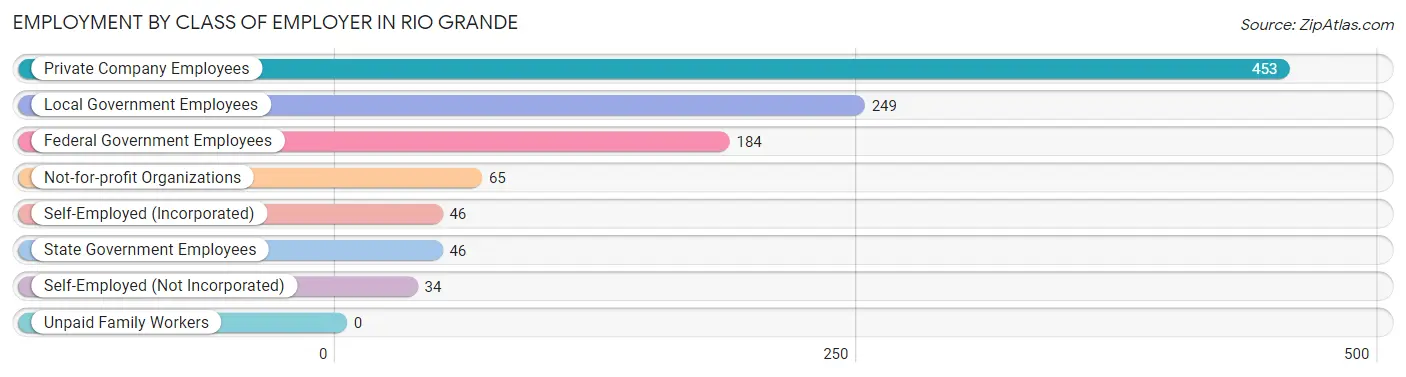
| Employer Class | # Employees | % Employees |
| Private Company Employees | 453 | 42.1% |
| Self-Employed (Incorporated) | 46 | 4.3% |
| Self-Employed (Not Incorporated) | 34 | 3.2% |
| Not-for-profit Organizations | 65 | 6.0% |
| Local Government Employees | 249 | 23.1% |
| State Government Employees | 46 | 4.3% |
| Federal Government Employees | 184 | 17.1% |
| Unpaid Family Workers | 0 | 0.0% |
| Total | 1,077 | 100.0% |
Employment Status by Age in Rio Grande
According to the labor force statistics for Rio Grande, out of the total population over 16 years of age (2,819), 50.9% or 1,435 individuals are in the labor force, with 20.4% or 293 of them unemployed. The age group with the highest labor force participation rate is 20 to 24 years, with 100.0% or 146 individuals in the labor force. Within the labor force, the 20 to 24 years age range has the highest percentage of unemployed individuals, with 72.6% or 106 of them being unemployed.
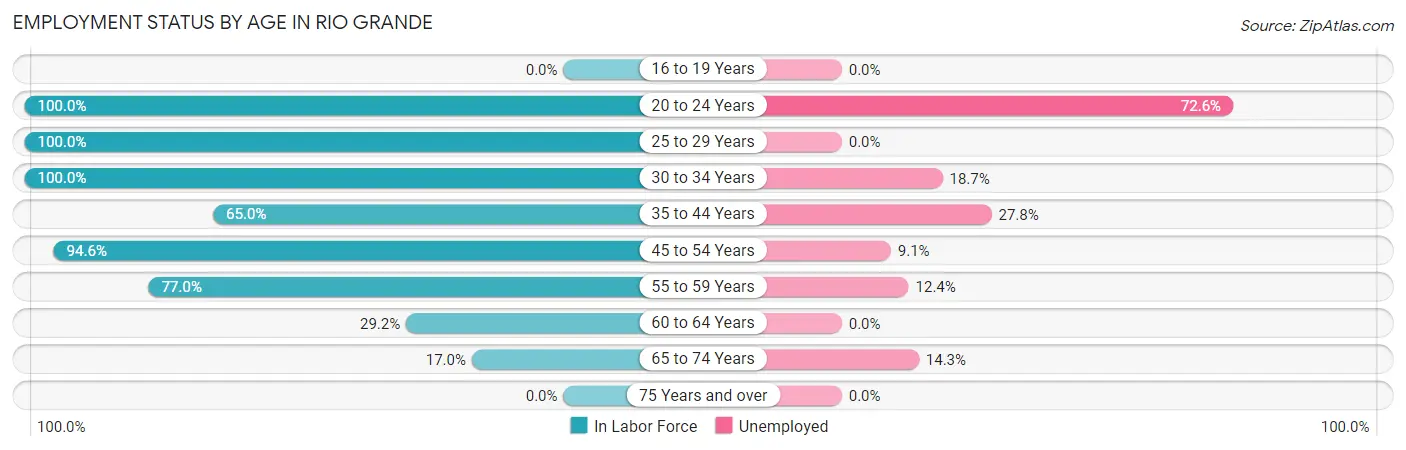
| Age Bracket | In Labor Force | Unemployed |
| 16 to 19 Years | 0 (0.0%) | 0 (0.0%) |
| 20 to 24 Years | 146 (100.0%) | 106 (72.6%) |
| 25 to 29 Years | 13 (100.0%) | 0 (0.0%) |
| 30 to 34 Years | 166 (100.0%) | 31 (18.7%) |
| 35 to 44 Years | 284 (65.0%) | 79 (27.8%) |
| 45 to 54 Years | 508 (94.6%) | 46 (9.1%) |
| 55 to 59 Years | 97 (77.0%) | 12 (12.4%) |
| 60 to 64 Years | 89 (29.2%) | 0 (0.0%) |
| 65 to 74 Years | 133 (17.0%) | 19 (14.3%) |
| 75 Years and over | 0 (0.0%) | 0 (0.0%) |
| Total | 1,435 (50.9%) | 293 (20.4%) |
Employment Status by Educational Attainment in Rio Grande
According to labor force statistics for Rio Grande, 73.0% of individuals (1,156) out of the total population between 25 and 64 years of age (1,584) are in the labor force, with 14.5% or 168 of them being unemployed. The group with the highest labor force participation rate are those with the educational attainment of bachelor's degree or higher, with 84.2% or 363 individuals in the labor force. Within the labor force, individuals with less than high school education have the highest percentage of unemployment, with 29.5% or 46 of them being unemployed.
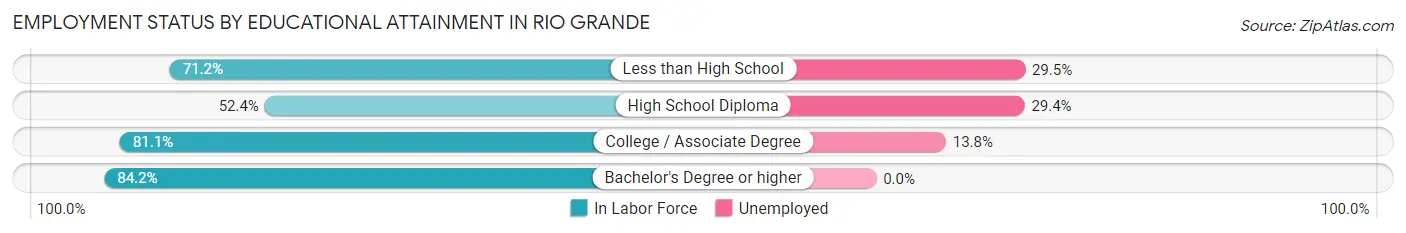
| Educational Attainment | In Labor Force | Unemployed |
| Less than High School | 156 (71.2%) | 65 (29.5%) |
| High School Diploma | 218 (52.4%) | 122 (29.4%) |
| College / Associate Degree | 420 (81.1%) | 71 (13.8%) |
| Bachelor's Degree or higher | 363 (84.2%) | 0 (0.0%) |
| Total | 1,156 (73.0%) | 230 (14.5%) |
Employment Occupations by Sex in Rio Grande
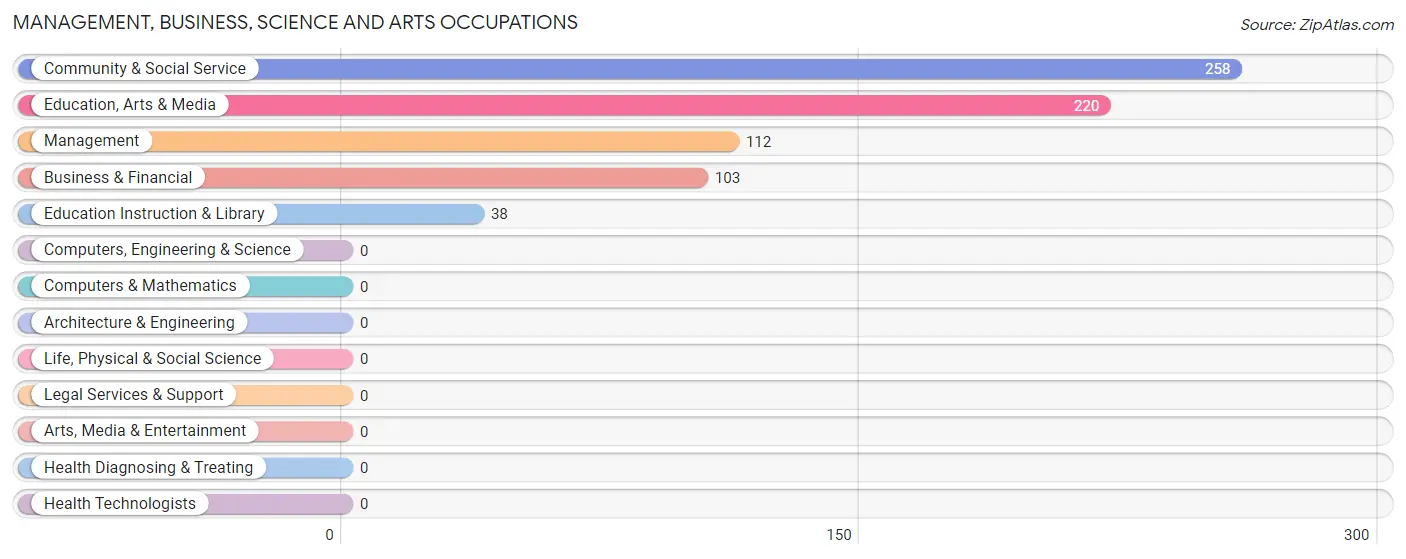
Management, Business, Science and Arts Occupations
The most common Management, Business, Science and Arts occupations in Rio Grande are Community & Social Service (258 | 22.6%), Education, Arts & Media (220 | 19.3%), Management (112 | 9.8%), Business & Financial (103 | 9.0%), and Education Instruction & Library (38 | 3.3%).
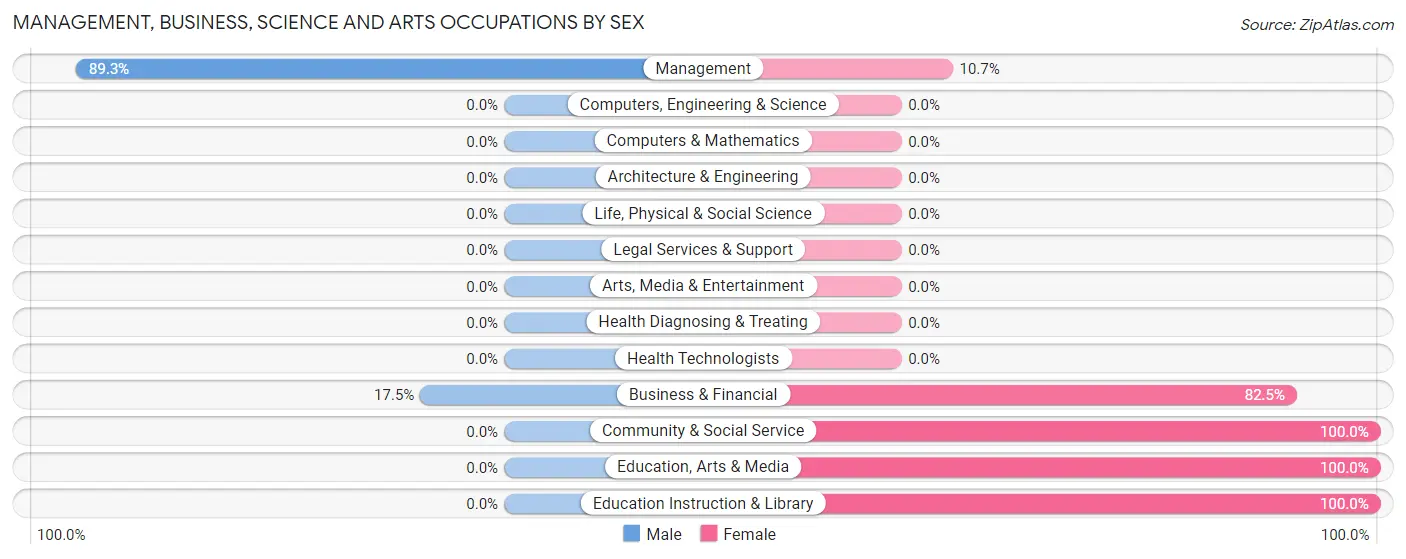
Management, Business, Science and Arts Occupations by Sex
Within the Management, Business, Science and Arts occupations in Rio Grande, the most male-oriented occupations are Management (89.3%), and Business & Financial (17.5%), while the most female-oriented occupations are Community & Social Service (100.0%), Education, Arts & Media (100.0%), and Education Instruction & Library (100.0%).
| Occupation | Male | Female |
| Management | 100 (89.3%) | 12 (10.7%) |
| Business & Financial | 18 (17.5%) | 85 (82.5%) |
| Computers, Engineering & Science | 0 (0.0%) | 0 (0.0%) |
| Computers & Mathematics | 0 (0.0%) | 0 (0.0%) |
| Architecture & Engineering | 0 (0.0%) | 0 (0.0%) |
| Life, Physical & Social Science | 0 (0.0%) | 0 (0.0%) |
| Community & Social Service | 0 (0.0%) | 258 (100.0%) |
| Education, Arts & Media | 0 (0.0%) | 220 (100.0%) |
| Legal Services & Support | 0 (0.0%) | 0 (0.0%) |
| Education Instruction & Library | 0 (0.0%) | 38 (100.0%) |
| Arts, Media & Entertainment | 0 (0.0%) | 0 (0.0%) |
| Health Diagnosing & Treating | 0 (0.0%) | 0 (0.0%) |
| Health Technologists | 0 (0.0%) | 0 (0.0%) |
| Total (Category) | 118 (24.9%) | 355 (75.0%) |
| Total (Overall) | 545 (47.7%) | 598 (52.3%) |
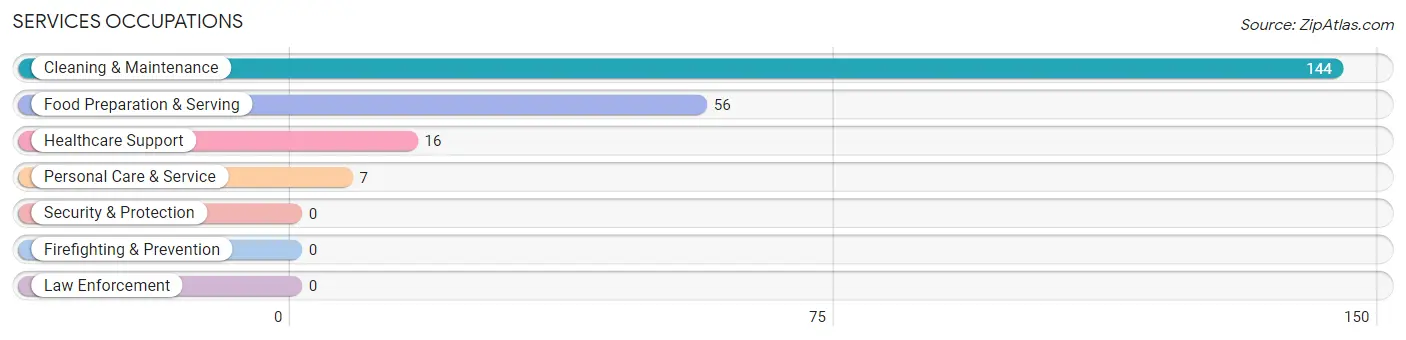
Services Occupations
The most common Services occupations in Rio Grande are Cleaning & Maintenance (144 | 12.6%), Food Preparation & Serving (56 | 4.9%), Healthcare Support (16 | 1.4%), and Personal Care & Service (7 | 0.6%).
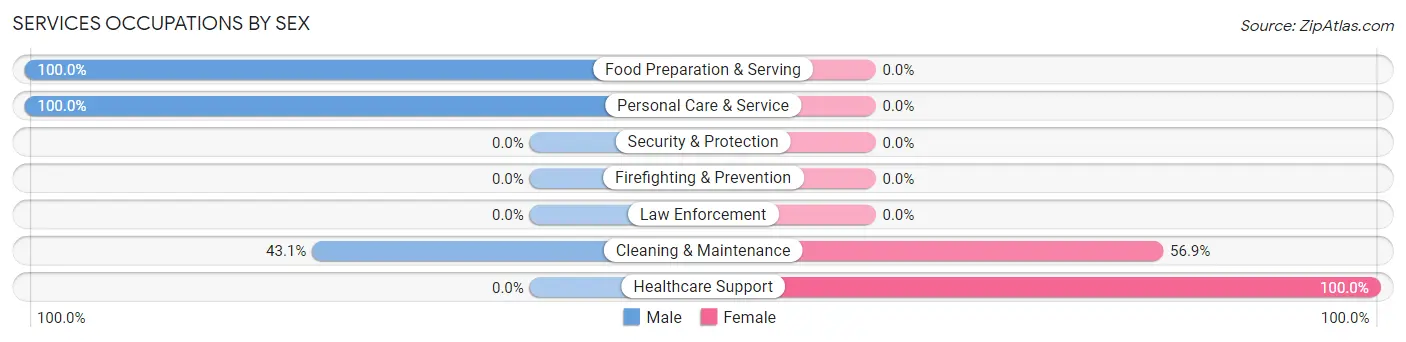
Services Occupations by Sex
Within the Services occupations in Rio Grande, the most male-oriented occupations are Food Preparation & Serving (100.0%), Personal Care & Service (100.0%), and Cleaning & Maintenance (43.1%), while the most female-oriented occupations are Healthcare Support (100.0%), and Cleaning & Maintenance (56.9%).
| Occupation | Male | Female |
| Healthcare Support | 0 (0.0%) | 16 (100.0%) |
| Security & Protection | 0 (0.0%) | 0 (0.0%) |
| Firefighting & Prevention | 0 (0.0%) | 0 (0.0%) |
| Law Enforcement | 0 (0.0%) | 0 (0.0%) |
| Food Preparation & Serving | 56 (100.0%) | 0 (0.0%) |
| Cleaning & Maintenance | 62 (43.1%) | 82 (56.9%) |
| Personal Care & Service | 7 (100.0%) | 0 (0.0%) |
| Total (Category) | 125 (56.0%) | 98 (44.0%) |
| Total (Overall) | 545 (47.7%) | 598 (52.3%) |
Sales and Office Occupations
The most common Sales and Office occupations in Rio Grande are Office & Administration (116 | 10.2%), and Sales & Related (35 | 3.1%).

Sales and Office Occupations by Sex

| Occupation | Male | Female |
| Sales & Related | 0 (0.0%) | 35 (100.0%) |
| Office & Administration | 20 (17.2%) | 96 (82.8%) |
| Total (Category) | 20 (13.3%) | 131 (86.8%) |
| Total (Overall) | 545 (47.7%) | 598 (52.3%) |
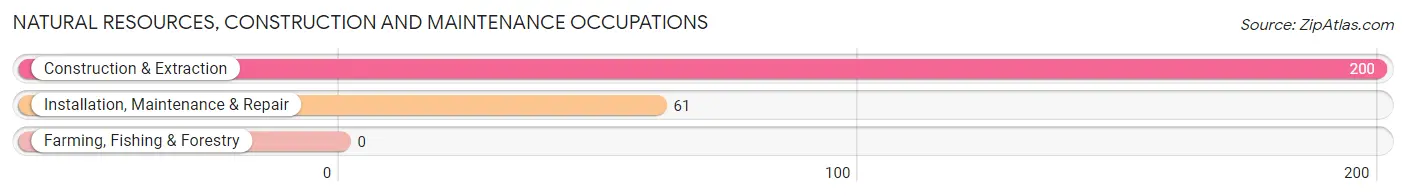
Natural Resources, Construction and Maintenance Occupations
The most common Natural Resources, Construction and Maintenance occupations in Rio Grande are Construction & Extraction (200 | 17.5%), and Installation, Maintenance & Repair (61 | 5.3%).
Natural Resources, Construction and Maintenance Occupations by Sex
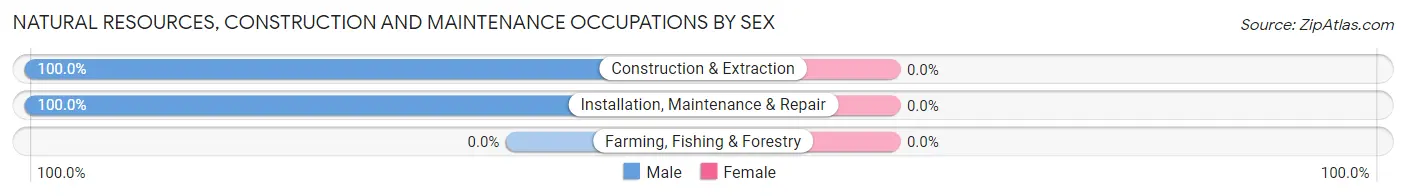
| Occupation | Male | Female |
| Farming, Fishing & Forestry | 0 (0.0%) | 0 (0.0%) |
| Construction & Extraction | 200 (100.0%) | 0 (0.0%) |
| Installation, Maintenance & Repair | 61 (100.0%) | 0 (0.0%) |
| Total (Category) | 261 (100.0%) | 0 (0.0%) |
| Total (Overall) | 545 (47.7%) | 598 (52.3%) |
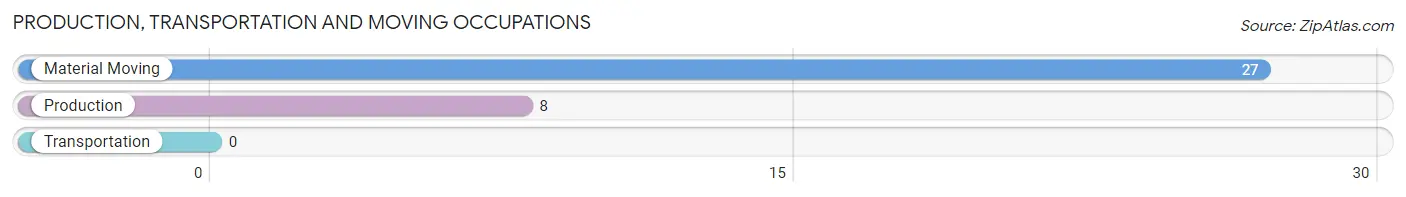
Production, Transportation and Moving Occupations
The most common Production, Transportation and Moving occupations in Rio Grande are Material Moving (27 | 2.4%), and Production (8 | 0.7%).
Production, Transportation and Moving Occupations by Sex
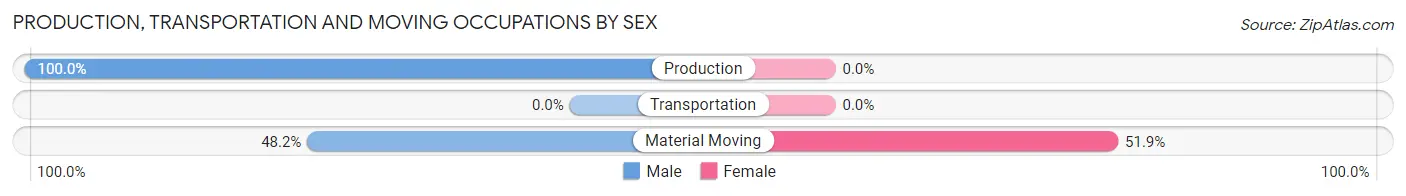
| Occupation | Male | Female |
| Production | 8 (100.0%) | 0 (0.0%) |
| Transportation | 0 (0.0%) | 0 (0.0%) |
| Material Moving | 13 (48.1%) | 14 (51.8%) |
| Total (Category) | 21 (60.0%) | 14 (40.0%) |
| Total (Overall) | 545 (47.7%) | 598 (52.3%) |
Employment Industries by Sex in Rio Grande
Employment Industries in Rio Grande
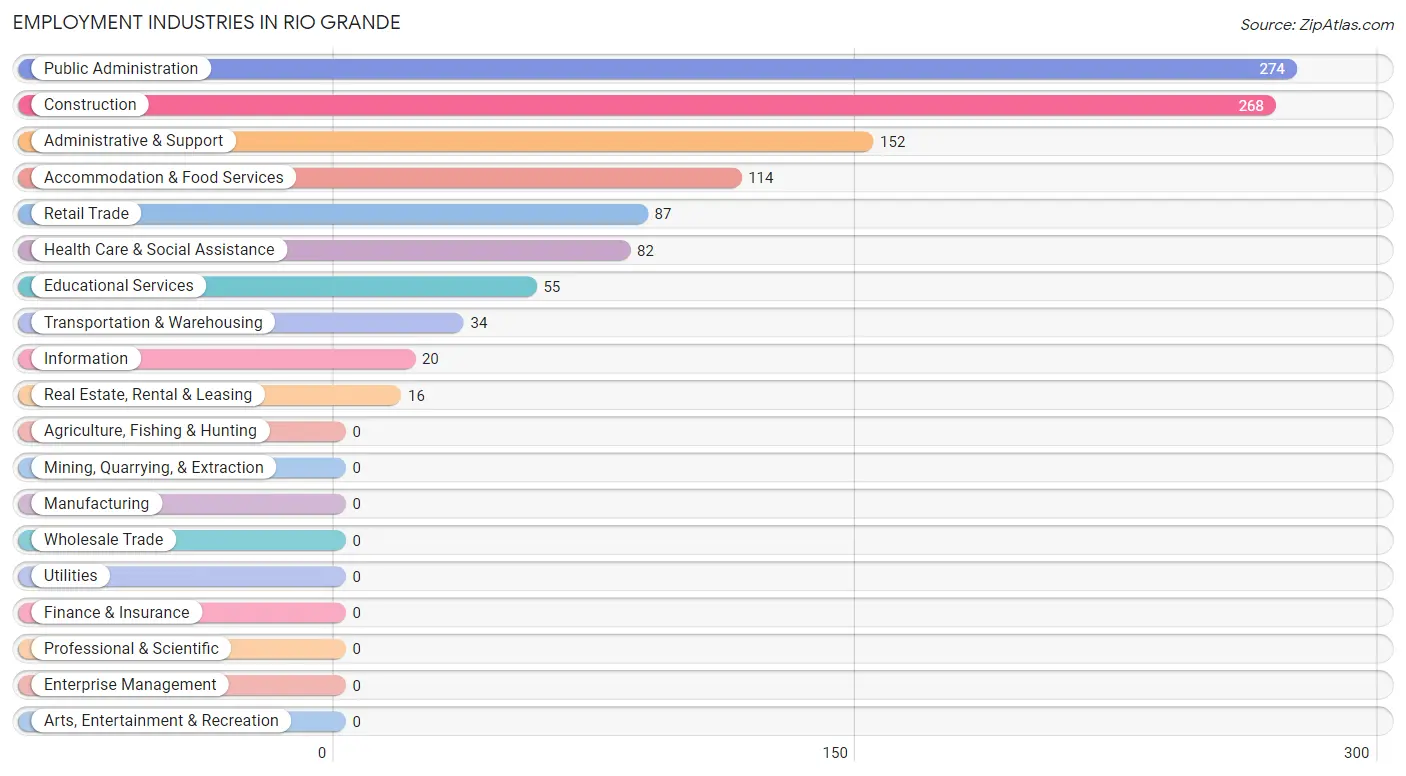
The major employment industries in Rio Grande include Public Administration (274 | 24.0%), Construction (268 | 23.4%), Administrative & Support (152 | 13.3%), Accommodation & Food Services (114 | 10.0%), and Retail Trade (87 | 7.6%).
Employment Industries by Sex in Rio Grande
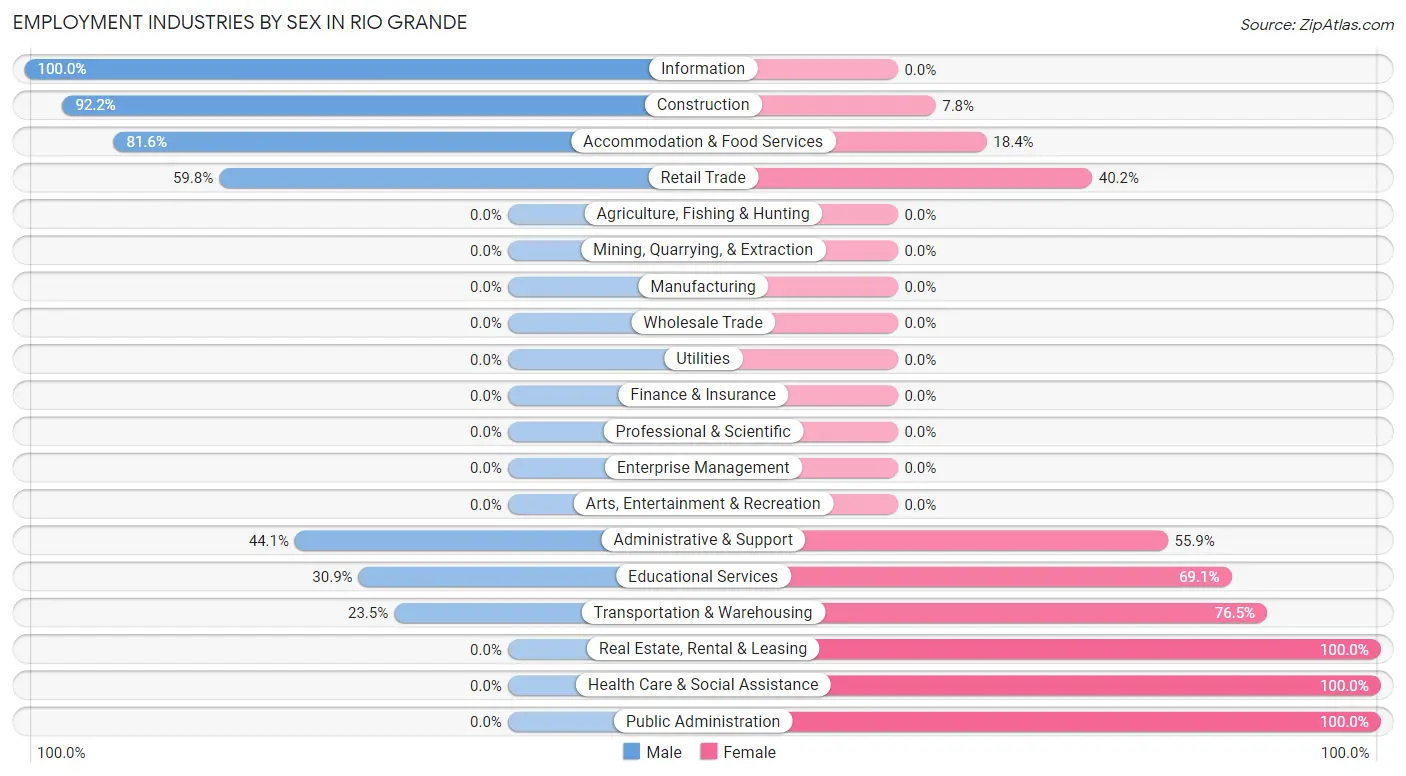
The Rio Grande industries that see more men than women are Information (100.0%), Construction (92.2%), and Accommodation & Food Services (81.6%), whereas the industries that tend to have a higher number of women are Real Estate, Rental & Leasing (100.0%), Health Care & Social Assistance (100.0%), and Public Administration (100.0%).
| Industry | Male | Female |
| Agriculture, Fishing & Hunting | 0 (0.0%) | 0 (0.0%) |
| Mining, Quarrying, & Extraction | 0 (0.0%) | 0 (0.0%) |
| Construction | 247 (92.2%) | 21 (7.8%) |
| Manufacturing | 0 (0.0%) | 0 (0.0%) |
| Wholesale Trade | 0 (0.0%) | 0 (0.0%) |
| Retail Trade | 52 (59.8%) | 35 (40.2%) |
| Transportation & Warehousing | 8 (23.5%) | 26 (76.5%) |
| Utilities | 0 (0.0%) | 0 (0.0%) |
| Information | 20 (100.0%) | 0 (0.0%) |
| Finance & Insurance | 0 (0.0%) | 0 (0.0%) |
| Real Estate, Rental & Leasing | 0 (0.0%) | 16 (100.0%) |
| Professional & Scientific | 0 (0.0%) | 0 (0.0%) |
| Enterprise Management | 0 (0.0%) | 0 (0.0%) |
| Administrative & Support | 67 (44.1%) | 85 (55.9%) |
| Educational Services | 17 (30.9%) | 38 (69.1%) |
| Health Care & Social Assistance | 0 (0.0%) | 82 (100.0%) |
| Arts, Entertainment & Recreation | 0 (0.0%) | 0 (0.0%) |
| Accommodation & Food Services | 93 (81.6%) | 21 (18.4%) |
| Public Administration | 0 (0.0%) | 274 (100.0%) |
| Total | 545 (47.7%) | 598 (52.3%) |
Education in Rio Grande
School Enrollment in Rio Grande
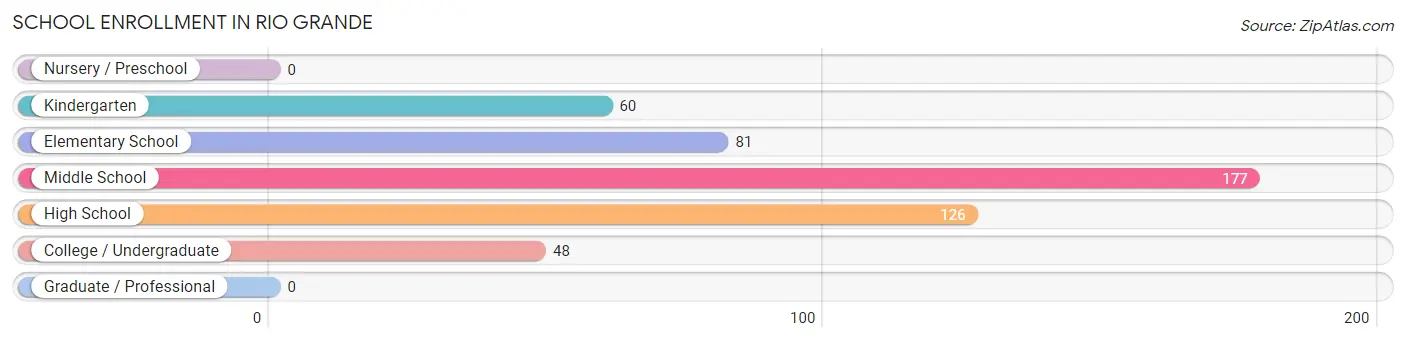
The most common levels of schooling among the 492 students in Rio Grande are middle school (177 | 36.0%), high school (126 | 25.6%), and elementary school (81 | 16.5%).
| School Level | # Students | % Students |
| Nursery / Preschool | 0 | 0.0% |
| Kindergarten | 60 | 12.2% |
| Elementary School | 81 | 16.5% |
| Middle School | 177 | 36.0% |
| High School | 126 | 25.6% |
| College / Undergraduate | 48 | 9.8% |
| Graduate / Professional | 0 | 0.0% |
| Total | 492 | 100.0% |
School Enrollment by Age by Funding Source in Rio Grande
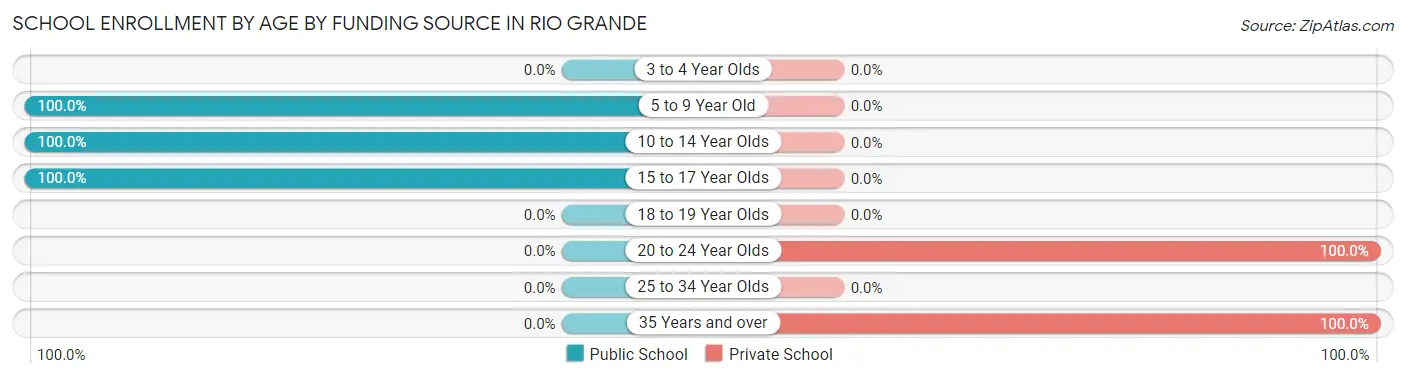
Out of a total of 492 students who are enrolled in schools in Rio Grande, 48 (9.8%) attend a private institution, while the remaining 444 (90.2%) are enrolled in public schools. The age group of 20 to 24 year olds has the highest likelihood of being enrolled in private schools, with 32 (100.0% in the age bracket) enrolled. Conversely, the age group of 5 to 9 year old has the lowest likelihood of being enrolled in a private school, with 141 (100.0% in the age bracket) attending a public institution.
| Age Bracket | Public School | Private School |
| 3 to 4 Year Olds | 0 (0.0%) | 0 (0.0%) |
| 5 to 9 Year Old | 141 (100.0%) | 0 (0.0%) |
| 10 to 14 Year Olds | 202 (100.0%) | 0 (0.0%) |
| 15 to 17 Year Olds | 101 (100.0%) | 0 (0.0%) |
| 18 to 19 Year Olds | 0 (0.0%) | 0 (0.0%) |
| 20 to 24 Year Olds | 0 (0.0%) | 32 (100.0%) |
| 25 to 34 Year Olds | 0 (0.0%) | 0 (0.0%) |
| 35 Years and over | 0 (0.0%) | 16 (100.0%) |
| Total | 444 (90.2%) | 48 (9.8%) |
Educational Attainment by Field of Study in Rio Grande
Social sciences (300 | 35.8%), business (105 | 12.5%), education (98 | 11.7%), psychology (89 | 10.6%), and engineering (82 | 9.8%) are the most common fields of study among 837 individuals in Rio Grande who have obtained a bachelor's degree or higher.
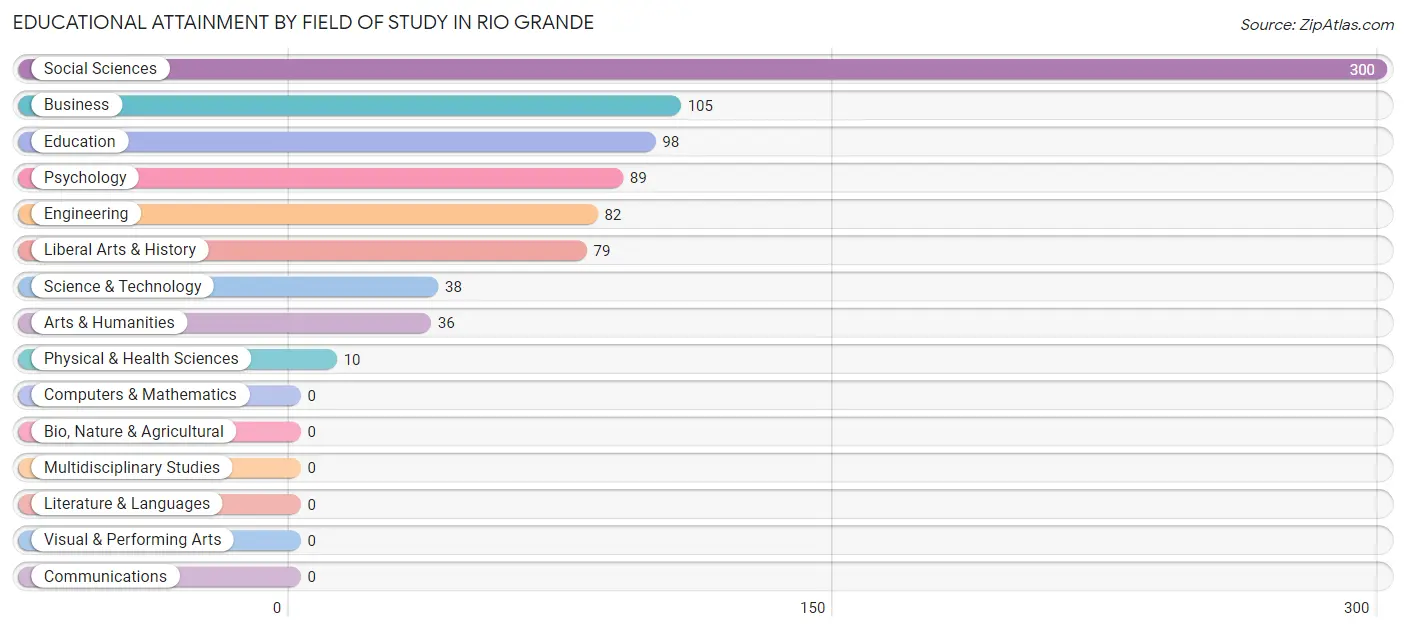
| Field of Study | # Graduates | % Graduates |
| Computers & Mathematics | 0 | 0.0% |
| Bio, Nature & Agricultural | 0 | 0.0% |
| Physical & Health Sciences | 10 | 1.2% |
| Psychology | 89 | 10.6% |
| Social Sciences | 300 | 35.8% |
| Engineering | 82 | 9.8% |
| Multidisciplinary Studies | 0 | 0.0% |
| Science & Technology | 38 | 4.5% |
| Business | 105 | 12.5% |
| Education | 98 | 11.7% |
| Literature & Languages | 0 | 0.0% |
| Liberal Arts & History | 79 | 9.4% |
| Visual & Performing Arts | 0 | 0.0% |
| Communications | 0 | 0.0% |
| Arts & Humanities | 36 | 4.3% |
| Total | 837 | 100.0% |
Transportation & Commute in Rio Grande
Vehicle Availability by Sex in Rio Grande
The most prevalent vehicle ownership categories in Rio Grande are males with 3 vehicles (214, accounting for 43.1%) and females with 3 vehicles (101, making up 37.3%).
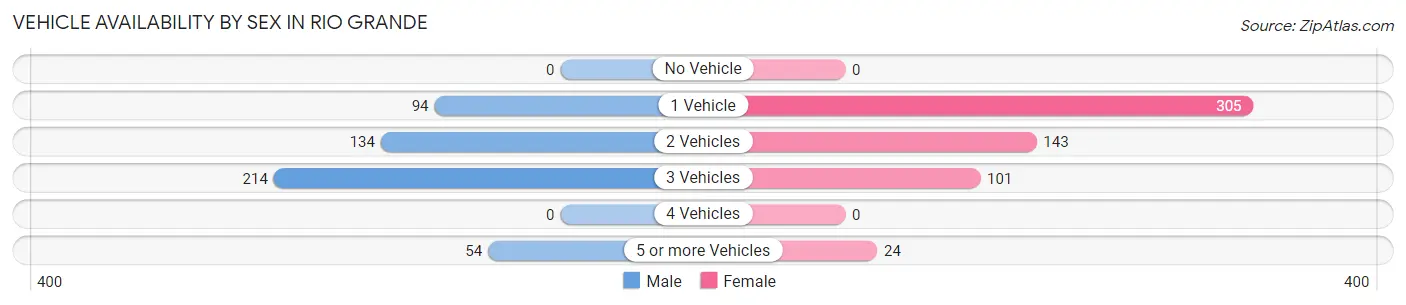
| Vehicles Available | Male | Female |
| No Vehicle | 0 (0.0%) | 0 (0.0%) |
| 1 Vehicle | 94 (19.0%) | 305 (53.2%) |
| 2 Vehicles | 134 (27.0%) | 143 (25.0%) |
| 3 Vehicles | 214 (43.1%) | 101 (17.6%) |
| 4 Vehicles | 0 (0.0%) | 0 (0.0%) |
| 5 or more Vehicles | 54 (10.9%) | 24 (4.2%) |
| Total | 496 (100.0%) | 573 (100.0%) |
Commute Time in Rio Grande
The most frequently occuring commute durations in Rio Grande are 15 to 19 minutes (434 commuters, 40.9%), 5 to 9 minutes (205 commuters, 19.3%), and 10 to 14 minutes (141 commuters, 13.3%).
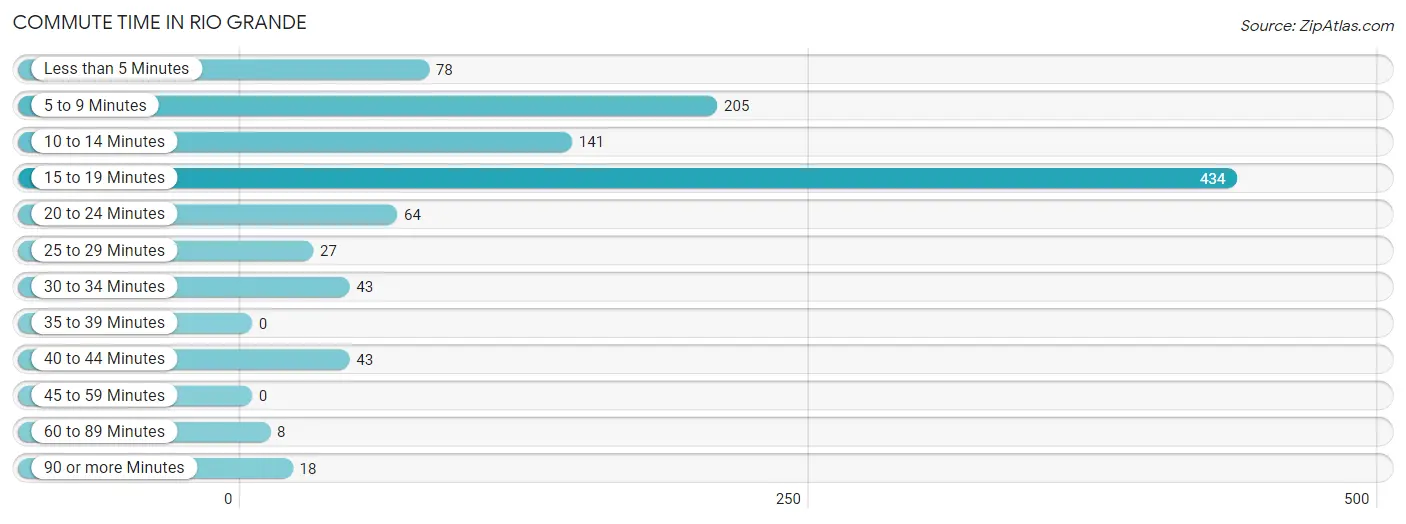
| Commute Time | # Commuters | % Commuters |
| Less than 5 Minutes | 78 | 7.3% |
| 5 to 9 Minutes | 205 | 19.3% |
| 10 to 14 Minutes | 141 | 13.3% |
| 15 to 19 Minutes | 434 | 40.9% |
| 20 to 24 Minutes | 64 | 6.0% |
| 25 to 29 Minutes | 27 | 2.5% |
| 30 to 34 Minutes | 43 | 4.1% |
| 35 to 39 Minutes | 0 | 0.0% |
| 40 to 44 Minutes | 43 | 4.1% |
| 45 to 59 Minutes | 0 | 0.0% |
| 60 to 89 Minutes | 8 | 0.7% |
| 90 or more Minutes | 18 | 1.7% |
Commute Time by Sex in Rio Grande
The most common commute times in Rio Grande are 15 to 19 minutes (154 commuters, 30.6%) for males and 15 to 19 minutes (280 commuters, 50.3%) for females.
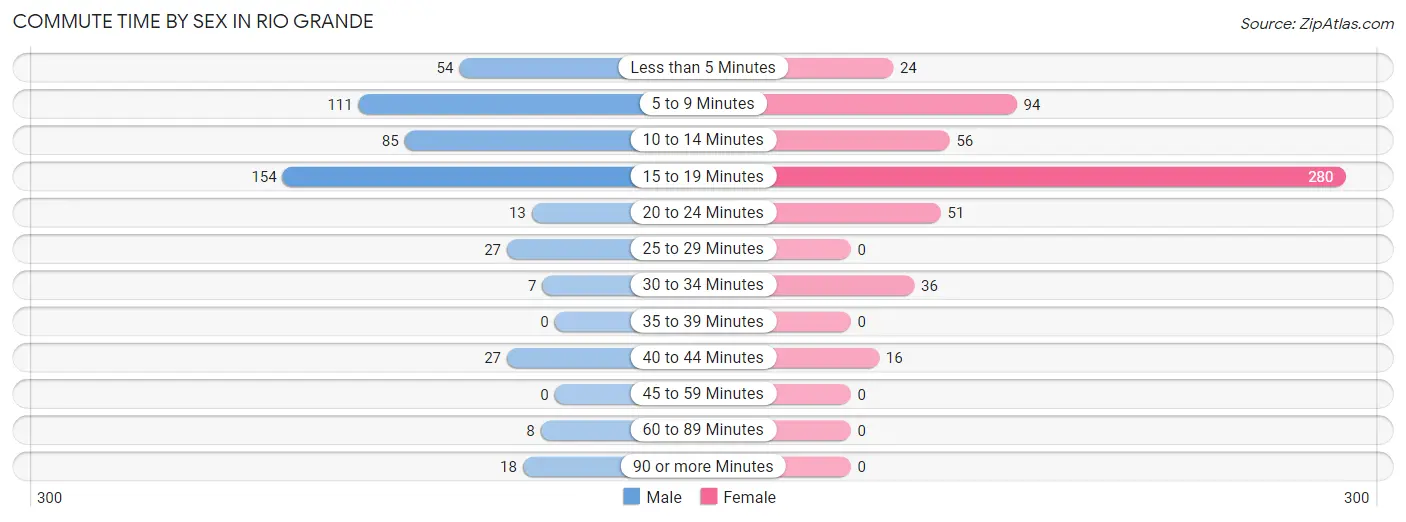
| Commute Time | Male | Female |
| Less than 5 Minutes | 54 (10.7%) | 24 (4.3%) |
| 5 to 9 Minutes | 111 (22.0%) | 94 (16.9%) |
| 10 to 14 Minutes | 85 (16.9%) | 56 (10.1%) |
| 15 to 19 Minutes | 154 (30.6%) | 280 (50.3%) |
| 20 to 24 Minutes | 13 (2.6%) | 51 (9.2%) |
| 25 to 29 Minutes | 27 (5.4%) | 0 (0.0%) |
| 30 to 34 Minutes | 7 (1.4%) | 36 (6.5%) |
| 35 to 39 Minutes | 0 (0.0%) | 0 (0.0%) |
| 40 to 44 Minutes | 27 (5.4%) | 16 (2.9%) |
| 45 to 59 Minutes | 0 (0.0%) | 0 (0.0%) |
| 60 to 89 Minutes | 8 (1.6%) | 0 (0.0%) |
| 90 or more Minutes | 18 (3.6%) | 0 (0.0%) |
Time of Departure to Work by Sex in Rio Grande
The most frequent times of departure to work in Rio Grande are 7:30 AM to 7:59 AM (161, 31.9%) for males and 6:00 AM to 6:29 AM (184, 33.0%) for females.
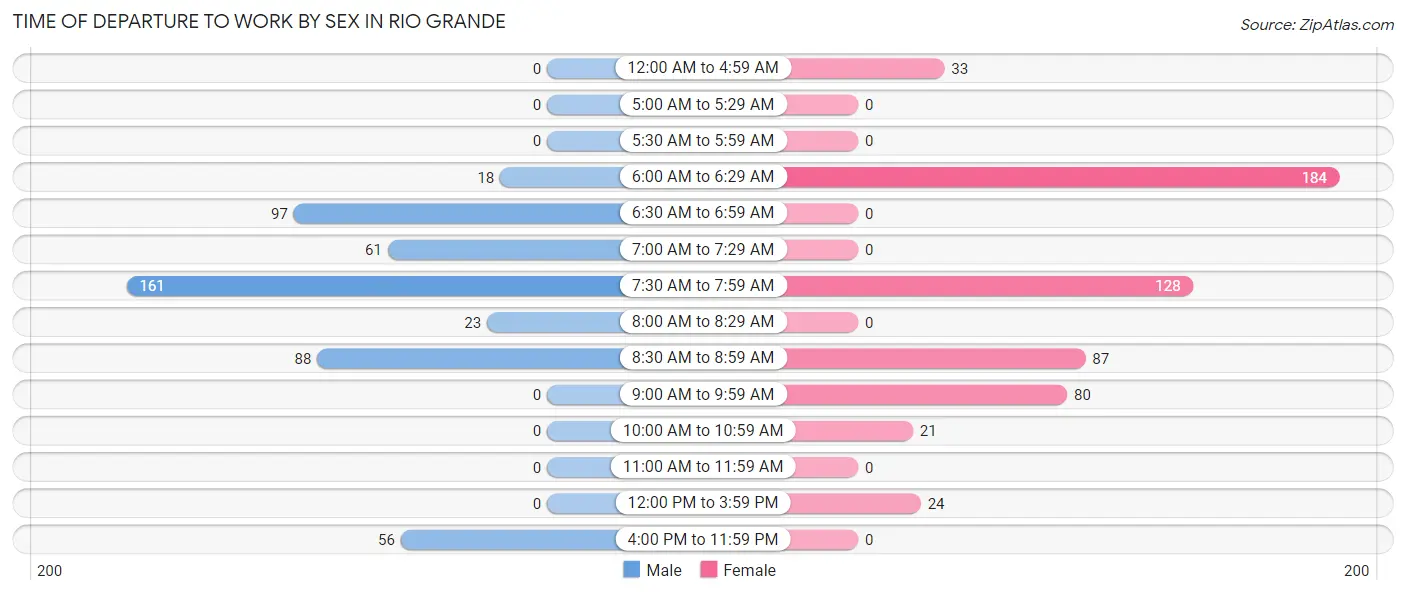
| Time of Departure | Male | Female |
| 12:00 AM to 4:59 AM | 0 (0.0%) | 33 (5.9%) |
| 5:00 AM to 5:29 AM | 0 (0.0%) | 0 (0.0%) |
| 5:30 AM to 5:59 AM | 0 (0.0%) | 0 (0.0%) |
| 6:00 AM to 6:29 AM | 18 (3.6%) | 184 (33.0%) |
| 6:30 AM to 6:59 AM | 97 (19.3%) | 0 (0.0%) |
| 7:00 AM to 7:29 AM | 61 (12.1%) | 0 (0.0%) |
| 7:30 AM to 7:59 AM | 161 (31.9%) | 128 (23.0%) |
| 8:00 AM to 8:29 AM | 23 (4.6%) | 0 (0.0%) |
| 8:30 AM to 8:59 AM | 88 (17.5%) | 87 (15.6%) |
| 9:00 AM to 9:59 AM | 0 (0.0%) | 80 (14.4%) |
| 10:00 AM to 10:59 AM | 0 (0.0%) | 21 (3.8%) |
| 11:00 AM to 11:59 AM | 0 (0.0%) | 0 (0.0%) |
| 12:00 PM to 3:59 PM | 0 (0.0%) | 24 (4.3%) |
| 4:00 PM to 11:59 PM | 56 (11.1%) | 0 (0.0%) |
| Total | 504 (100.0%) | 557 (100.0%) |
Housing Occupancy in Rio Grande
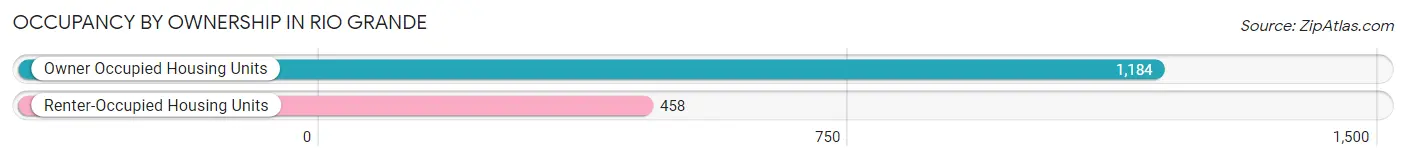
Occupancy by Ownership in Rio Grande
Of the total 1,642 dwellings in Rio Grande, owner-occupied units account for 1,184 (72.1%), while renter-occupied units make up 458 (27.9%).
| Occupancy | # Housing Units | % Housing Units |
| Owner Occupied Housing Units | 1,184 | 72.1% |
| Renter-Occupied Housing Units | 458 | 27.9% |
| Total Occupied Housing Units | 1,642 | 100.0% |
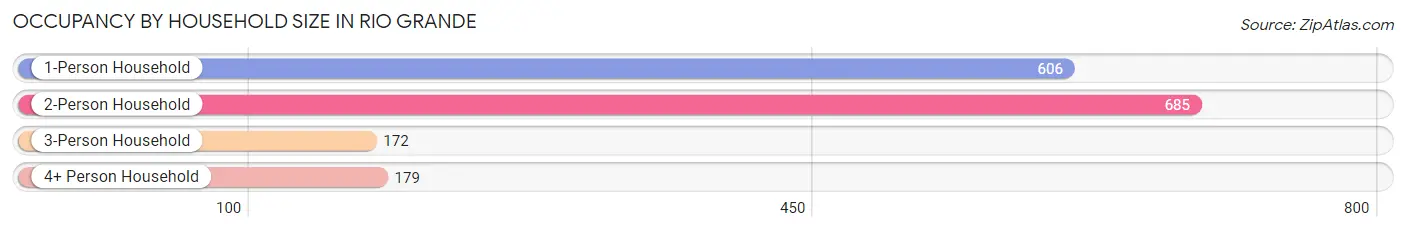
Occupancy by Household Size in Rio Grande
| Household Size | # Housing Units | % Housing Units |
| 1-Person Household | 606 | 36.9% |
| 2-Person Household | 685 | 41.7% |
| 3-Person Household | 172 | 10.5% |
| 4+ Person Household | 179 | 10.9% |
| Total Housing Units | 1,642 | 100.0% |
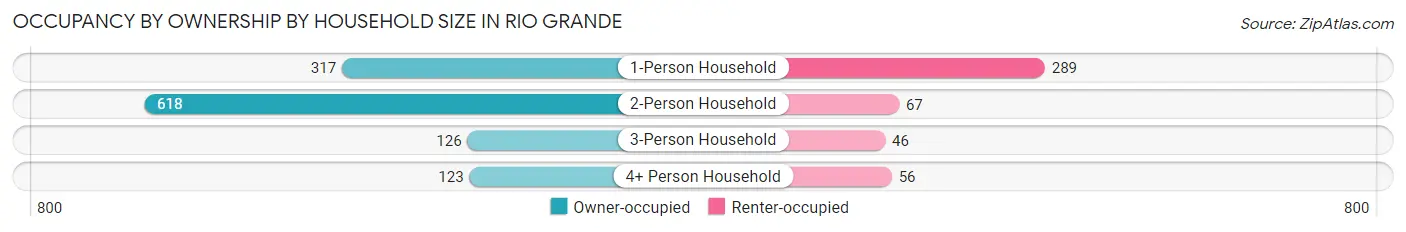
Occupancy by Ownership by Household Size in Rio Grande
| Household Size | Owner-occupied | Renter-occupied |
| 1-Person Household | 317 (52.3%) | 289 (47.7%) |
| 2-Person Household | 618 (90.2%) | 67 (9.8%) |
| 3-Person Household | 126 (73.3%) | 46 (26.7%) |
| 4+ Person Household | 123 (68.7%) | 56 (31.3%) |
| Total Housing Units | 1,184 (72.1%) | 458 (27.9%) |
Occupancy by Educational Attainment in Rio Grande
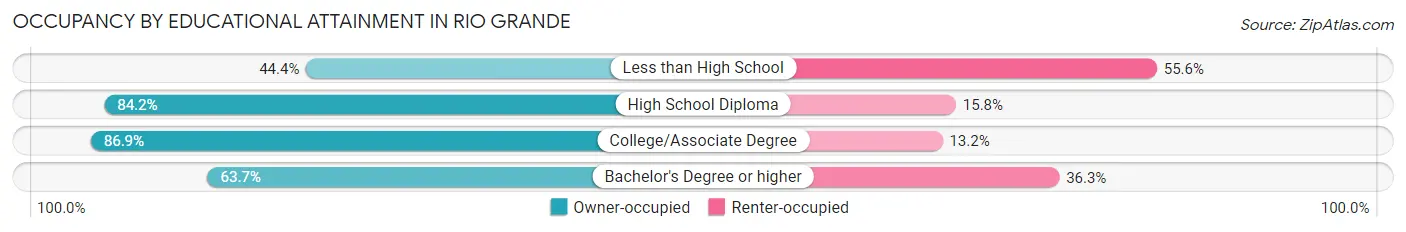
| Household Size | Owner-occupied | Renter-occupied |
| Less than High School | 118 (44.4%) | 148 (55.6%) |
| High School Diploma | 373 (84.2%) | 70 (15.8%) |
| College/Associate Degree | 370 (86.9%) | 56 (13.2%) |
| Bachelor's Degree or higher | 323 (63.7%) | 184 (36.3%) |
Occupancy by Age of Householder in Rio Grande
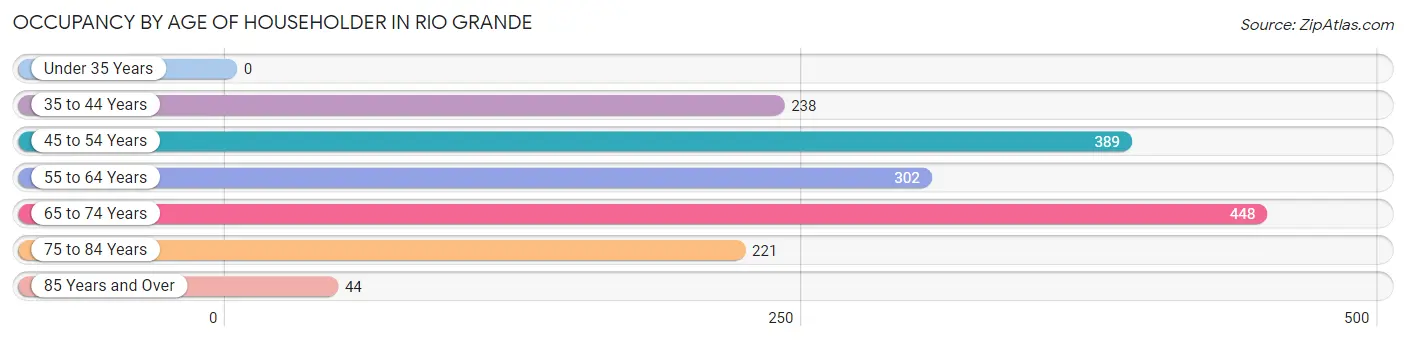
| Age Bracket | # Households | % Households |
| Under 35 Years | 0 | 0.0% |
| 35 to 44 Years | 238 | 14.5% |
| 45 to 54 Years | 389 | 23.7% |
| 55 to 64 Years | 302 | 18.4% |
| 65 to 74 Years | 448 | 27.3% |
| 75 to 84 Years | 221 | 13.5% |
| 85 Years and Over | 44 | 2.7% |
| Total | 1,642 | 100.0% |
Housing Finances in Rio Grande
Median Income by Occupancy in Rio Grande
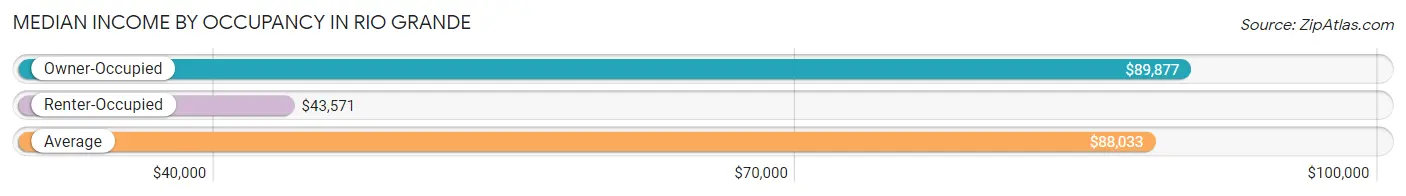
| Occupancy Type | # Households | Median Income |
| Owner-Occupied | 1,184 (72.1%) | $89,877 |
| Renter-Occupied | 458 (27.9%) | $43,571 |
| Average | 1,642 (100.0%) | $88,033 |
Occupancy by Householder Income Bracket in Rio Grande
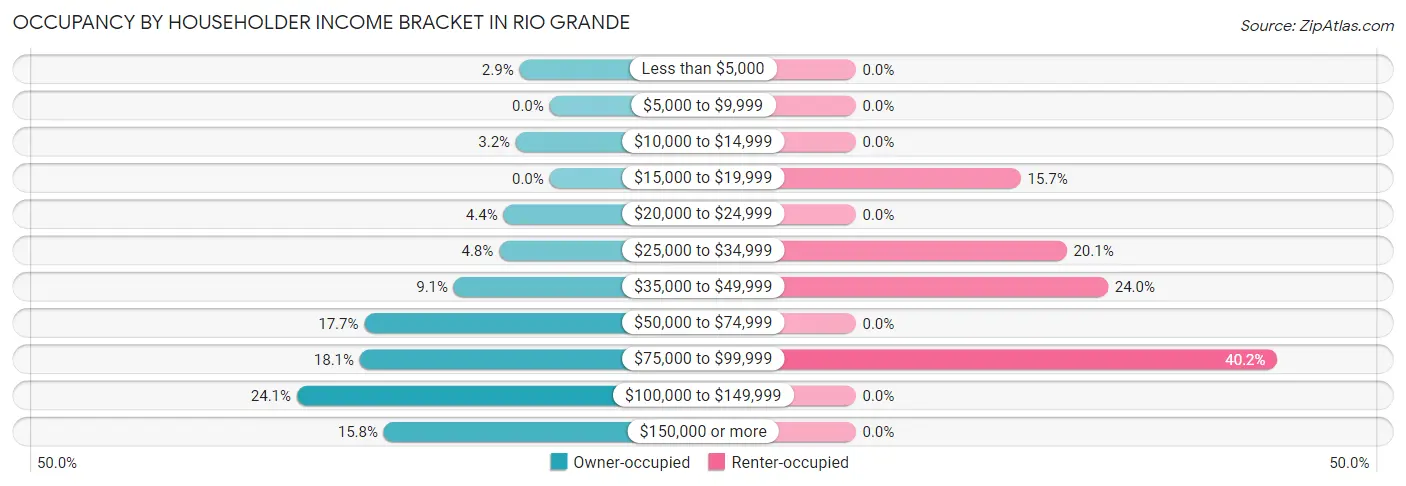
| Income Bracket | Owner-occupied | Renter-occupied |
| Less than $5,000 | 34 (2.9%) | 0 (0.0%) |
| $5,000 to $9,999 | 0 (0.0%) | 0 (0.0%) |
| $10,000 to $14,999 | 38 (3.2%) | 0 (0.0%) |
| $15,000 to $19,999 | 0 (0.0%) | 72 (15.7%) |
| $20,000 to $24,999 | 52 (4.4%) | 0 (0.0%) |
| $25,000 to $34,999 | 57 (4.8%) | 92 (20.1%) |
| $35,000 to $49,999 | 108 (9.1%) | 110 (24.0%) |
| $50,000 to $74,999 | 209 (17.6%) | 0 (0.0%) |
| $75,000 to $99,999 | 214 (18.1%) | 184 (40.2%) |
| $100,000 to $149,999 | 285 (24.1%) | 0 (0.0%) |
| $150,000 or more | 187 (15.8%) | 0 (0.0%) |
| Total | 1,184 (100.0%) | 458 (100.0%) |
Monthly Housing Cost Tiers in Rio Grande
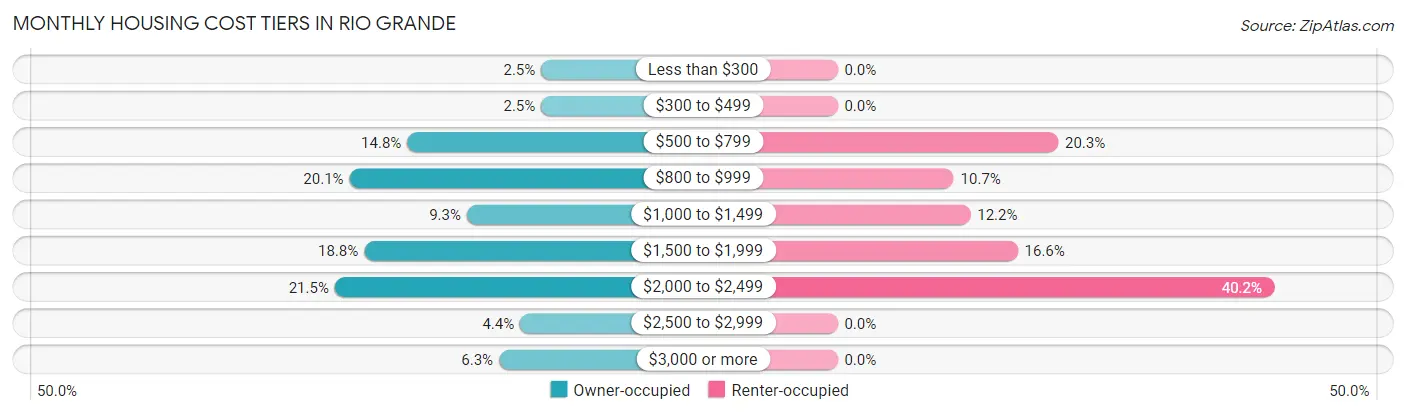
| Monthly Cost | Owner-occupied | Renter-occupied |
| Less than $300 | 29 (2.5%) | 0 (0.0%) |
| $300 to $499 | 29 (2.5%) | 0 (0.0%) |
| $500 to $799 | 175 (14.8%) | 93 (20.3%) |
| $800 to $999 | 238 (20.1%) | 49 (10.7%) |
| $1,000 to $1,499 | 110 (9.3%) | 56 (12.2%) |
| $1,500 to $1,999 | 222 (18.8%) | 76 (16.6%) |
| $2,000 to $2,499 | 254 (21.4%) | 184 (40.2%) |
| $2,500 to $2,999 | 52 (4.4%) | 0 (0.0%) |
| $3,000 or more | 75 (6.3%) | 0 (0.0%) |
| Total | 1,184 (100.0%) | 458 (100.0%) |
Physical Housing Characteristics in Rio Grande
Housing Structures in Rio Grande
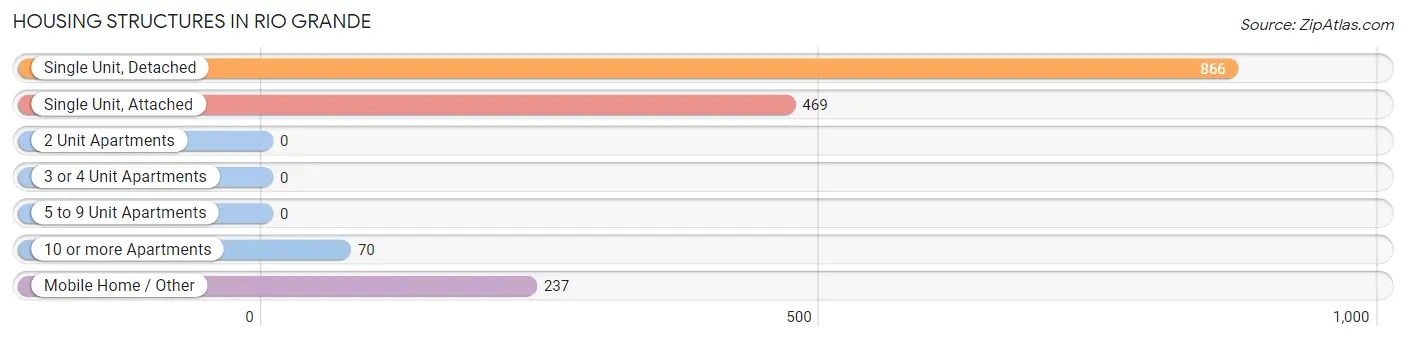
| Structure Type | # Housing Units | % Housing Units |
| Single Unit, Detached | 866 | 52.7% |
| Single Unit, Attached | 469 | 28.6% |
| 2 Unit Apartments | 0 | 0.0% |
| 3 or 4 Unit Apartments | 0 | 0.0% |
| 5 to 9 Unit Apartments | 0 | 0.0% |
| 10 or more Apartments | 70 | 4.3% |
| Mobile Home / Other | 237 | 14.4% |
| Total | 1,642 | 100.0% |
Housing Structures by Occupancy in Rio Grande
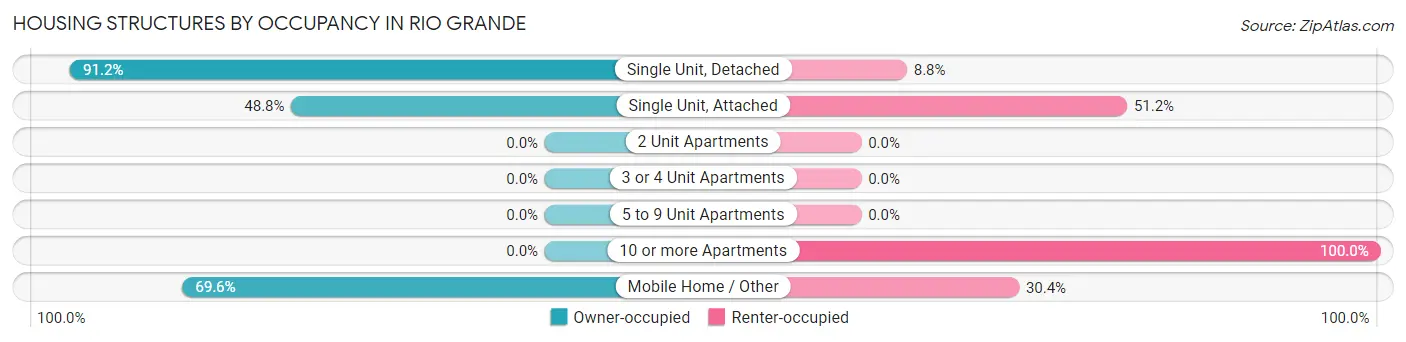
| Structure Type | Owner-occupied | Renter-occupied |
| Single Unit, Detached | 790 (91.2%) | 76 (8.8%) |
| Single Unit, Attached | 229 (48.8%) | 240 (51.2%) |
| 2 Unit Apartments | 0 (0.0%) | 0 (0.0%) |
| 3 or 4 Unit Apartments | 0 (0.0%) | 0 (0.0%) |
| 5 to 9 Unit Apartments | 0 (0.0%) | 0 (0.0%) |
| 10 or more Apartments | 0 (0.0%) | 70 (100.0%) |
| Mobile Home / Other | 165 (69.6%) | 72 (30.4%) |
| Total | 1,184 (72.1%) | 458 (27.9%) |
Housing Structures by Number of Rooms in Rio Grande
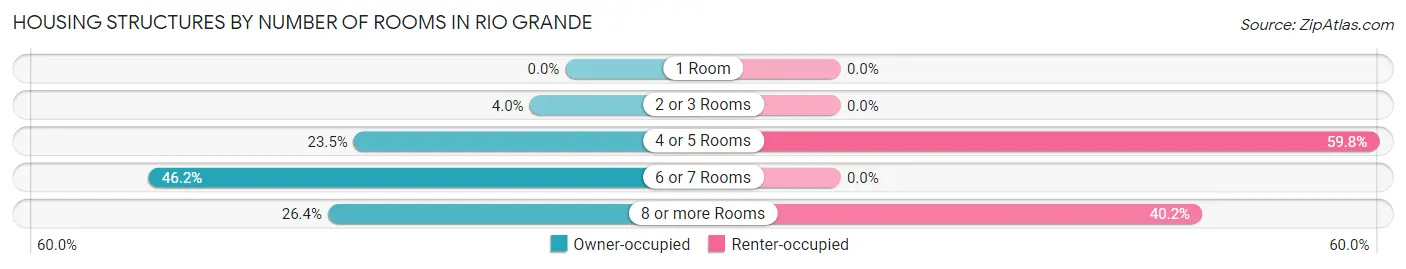
| Number of Rooms | Owner-occupied | Renter-occupied |
| 1 Room | 0 (0.0%) | 0 (0.0%) |
| 2 or 3 Rooms | 47 (4.0%) | 0 (0.0%) |
| 4 or 5 Rooms | 278 (23.5%) | 274 (59.8%) |
| 6 or 7 Rooms | 547 (46.2%) | 0 (0.0%) |
| 8 or more Rooms | 312 (26.4%) | 184 (40.2%) |
| Total | 1,184 (100.0%) | 458 (100.0%) |
Housing Structure by Heating Type in Rio Grande
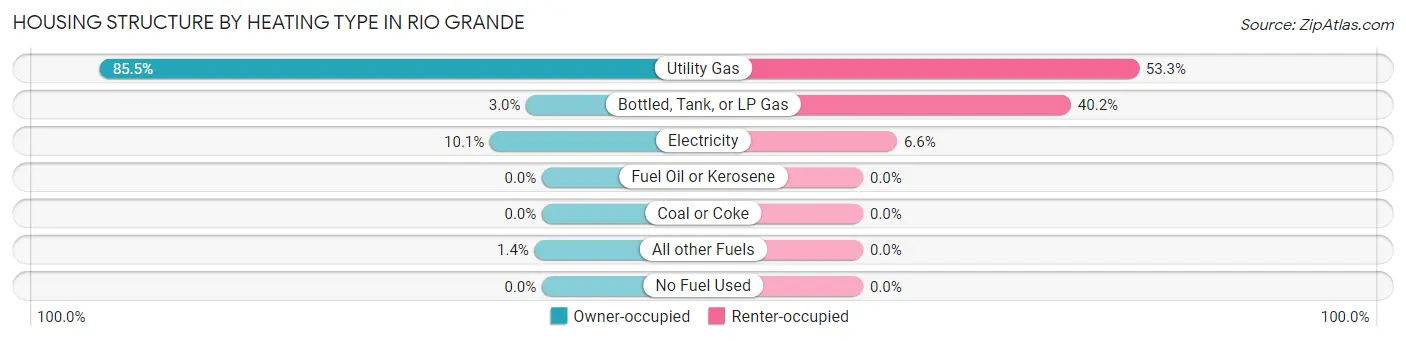
| Heating Type | Owner-occupied | Renter-occupied |
| Utility Gas | 1,012 (85.5%) | 244 (53.3%) |
| Bottled, Tank, or LP Gas | 36 (3.0%) | 184 (40.2%) |
| Electricity | 119 (10.1%) | 30 (6.6%) |
| Fuel Oil or Kerosene | 0 (0.0%) | 0 (0.0%) |
| Coal or Coke | 0 (0.0%) | 0 (0.0%) |
| All other Fuels | 17 (1.4%) | 0 (0.0%) |
| No Fuel Used | 0 (0.0%) | 0 (0.0%) |
| Total | 1,184 (100.0%) | 458 (100.0%) |
Household Vehicle Usage in Rio Grande
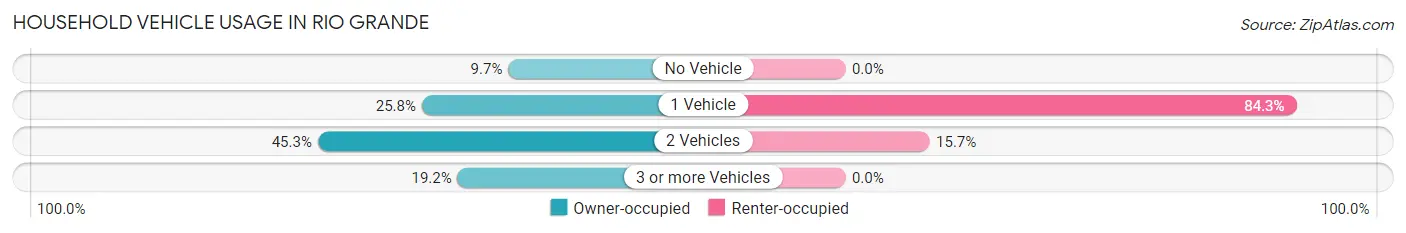
| Vehicles per Household | Owner-occupied | Renter-occupied |
| No Vehicle | 115 (9.7%) | 0 (0.0%) |
| 1 Vehicle | 306 (25.8%) | 386 (84.3%) |
| 2 Vehicles | 536 (45.3%) | 72 (15.7%) |
| 3 or more Vehicles | 227 (19.2%) | 0 (0.0%) |
| Total | 1,184 (100.0%) | 458 (100.0%) |
Real Estate & Mortgages in Rio Grande
Real Estate and Mortgage Overview in Rio Grande
| Characteristic | Without Mortgage | With Mortgage |
| Housing Units | 569 | 615 |
| Median Property Value | $301,800 | $351,200 |
| Median Household Income | $67,420 | $160 |
| Monthly Housing Costs | $908 | $60 |
| Real Estate Taxes | $5,090 | $0 |
Property Value by Mortgage Status in Rio Grande
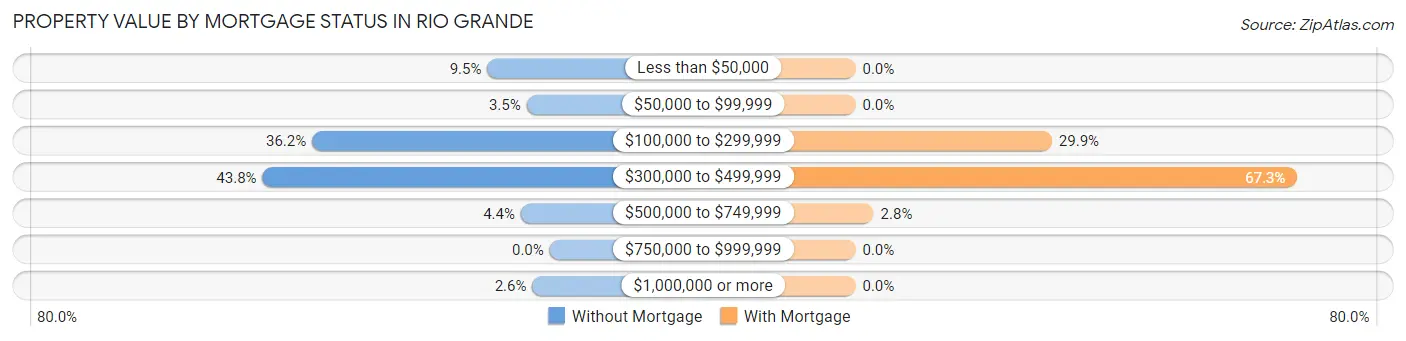
| Property Value | Without Mortgage | With Mortgage |
| Less than $50,000 | 54 (9.5%) | 0 (0.0%) |
| $50,000 to $99,999 | 20 (3.5%) | 0 (0.0%) |
| $100,000 to $299,999 | 206 (36.2%) | 184 (29.9%) |
| $300,000 to $499,999 | 249 (43.8%) | 414 (67.3%) |
| $500,000 to $749,999 | 25 (4.4%) | 17 (2.8%) |
| $750,000 to $999,999 | 0 (0.0%) | 0 (0.0%) |
| $1,000,000 or more | 15 (2.6%) | 0 (0.0%) |
| Total | 569 (100.0%) | 615 (100.0%) |
Household Income by Mortgage Status in Rio Grande
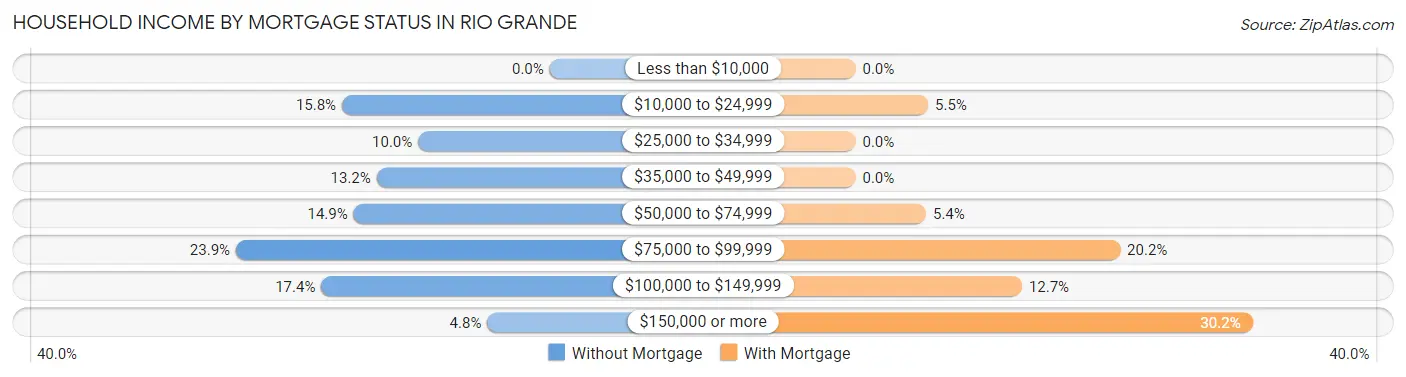
| Household Income | Without Mortgage | With Mortgage |
| Less than $10,000 | 0 (0.0%) | 0 (0.0%) |
| $10,000 to $24,999 | 90 (15.8%) | 34 (5.5%) |
| $25,000 to $34,999 | 57 (10.0%) | 0 (0.0%) |
| $35,000 to $49,999 | 75 (13.2%) | 0 (0.0%) |
| $50,000 to $74,999 | 85 (14.9%) | 33 (5.4%) |
| $75,000 to $99,999 | 136 (23.9%) | 124 (20.2%) |
| $100,000 to $149,999 | 99 (17.4%) | 78 (12.7%) |
| $150,000 or more | 27 (4.8%) | 186 (30.2%) |
| Total | 569 (100.0%) | 615 (100.0%) |
Property Value to Household Income Ratio in Rio Grande
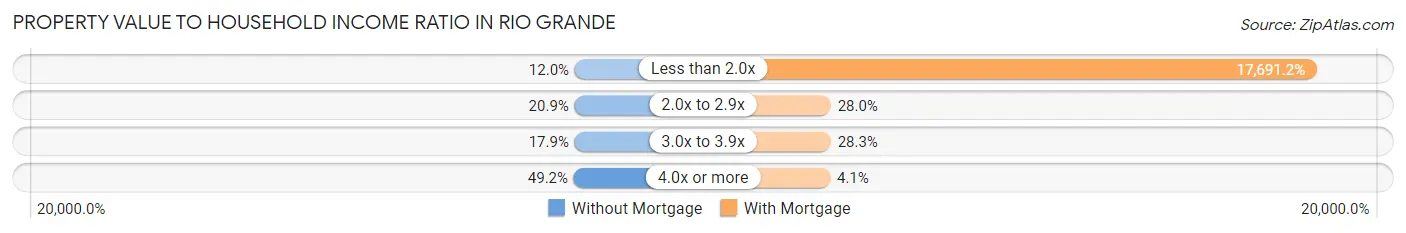
| Value-to-Income Ratio | Without Mortgage | With Mortgage |
| Less than 2.0x | 68 (11.9%) | 108,801 (17,691.2%) |
| 2.0x to 2.9x | 119 (20.9%) | 172 (28.0%) |
| 3.0x to 3.9x | 102 (17.9%) | 174 (28.3%) |
| 4.0x or more | 280 (49.2%) | 25 (4.1%) |
| Total | 569 (100.0%) | 615 (100.0%) |
Real Estate Taxes by Mortgage Status in Rio Grande
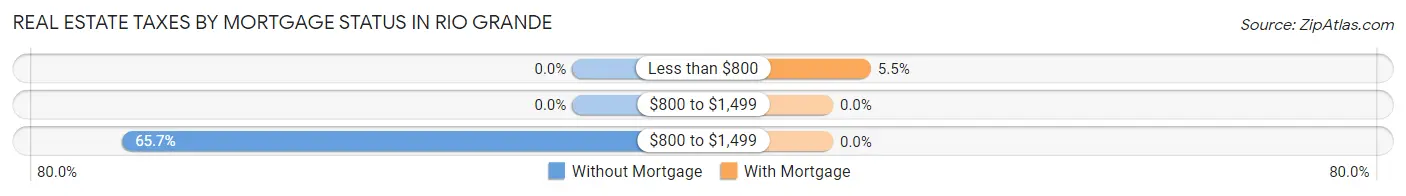
| Property Taxes | Without Mortgage | With Mortgage |
| Less than $800 | 0 (0.0%) | 34 (5.5%) |
| $800 to $1,499 | 0 (0.0%) | 0 (0.0%) |
| $800 to $1,499 | 374 (65.7%) | 0 (0.0%) |
| Total | 569 (100.0%) | 615 (100.0%) |
Health & Disability in Rio Grande
Health Insurance Coverage by Age in Rio Grande
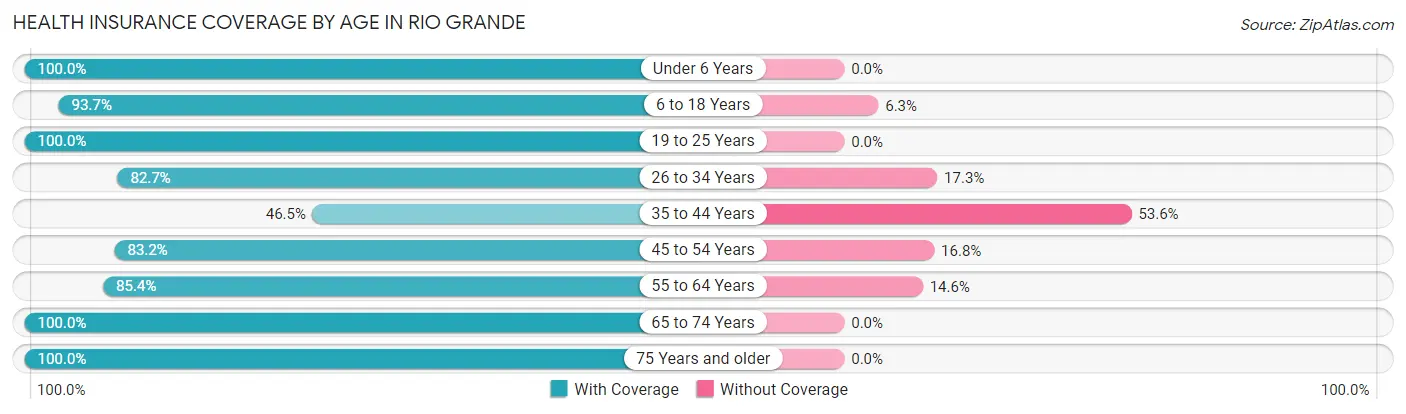
| Age Bracket | With Coverage | Without Coverage |
| Under 6 Years | 135 (100.0%) | 0 (0.0%) |
| 6 to 18 Years | 384 (93.7%) | 26 (6.3%) |
| 19 to 25 Years | 146 (100.0%) | 0 (0.0%) |
| 26 to 34 Years | 148 (82.7%) | 31 (17.3%) |
| 35 to 44 Years | 203 (46.5%) | 234 (53.5%) |
| 45 to 54 Years | 447 (83.2%) | 90 (16.8%) |
| 55 to 64 Years | 368 (85.4%) | 63 (14.6%) |
| 65 to 74 Years | 782 (100.0%) | 0 (0.0%) |
| 75 Years and older | 307 (100.0%) | 0 (0.0%) |
| Total | 2,920 (86.8%) | 444 (13.2%) |
Health Insurance Coverage by Citizenship Status in Rio Grande
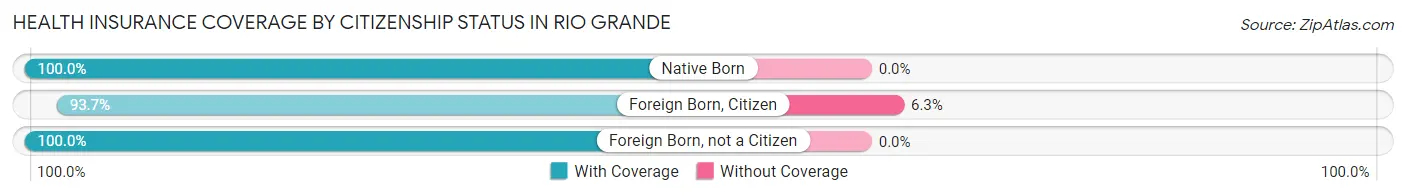
| Citizenship Status | With Coverage | Without Coverage |
| Native Born | 135 (100.0%) | 0 (0.0%) |
| Foreign Born, Citizen | 384 (93.7%) | 26 (6.3%) |
| Foreign Born, not a Citizen | 146 (100.0%) | 0 (0.0%) |
Health Insurance Coverage by Household Income in Rio Grande
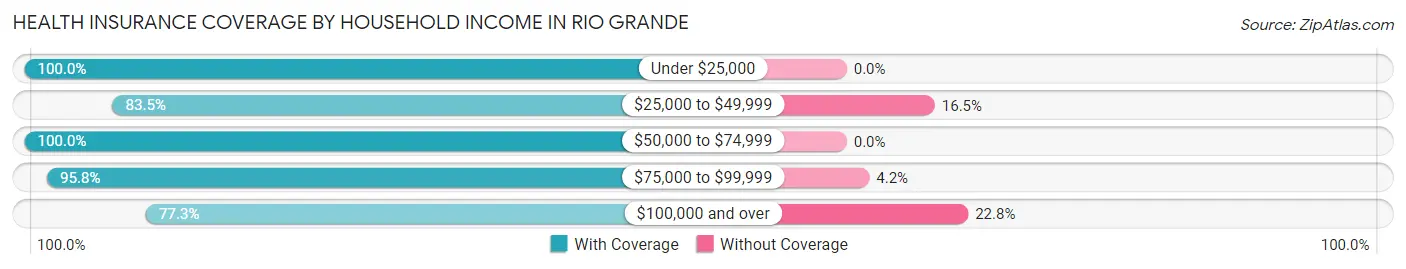
| Household Income | With Coverage | Without Coverage |
| Under $25,000 | 237 (100.0%) | 0 (0.0%) |
| $25,000 to $49,999 | 688 (83.5%) | 136 (16.5%) |
| $50,000 to $74,999 | 362 (100.0%) | 0 (0.0%) |
| $75,000 to $99,999 | 770 (95.8%) | 34 (4.2%) |
| $100,000 and over | 849 (77.2%) | 250 (22.8%) |
Public vs Private Health Insurance Coverage by Age in Rio Grande
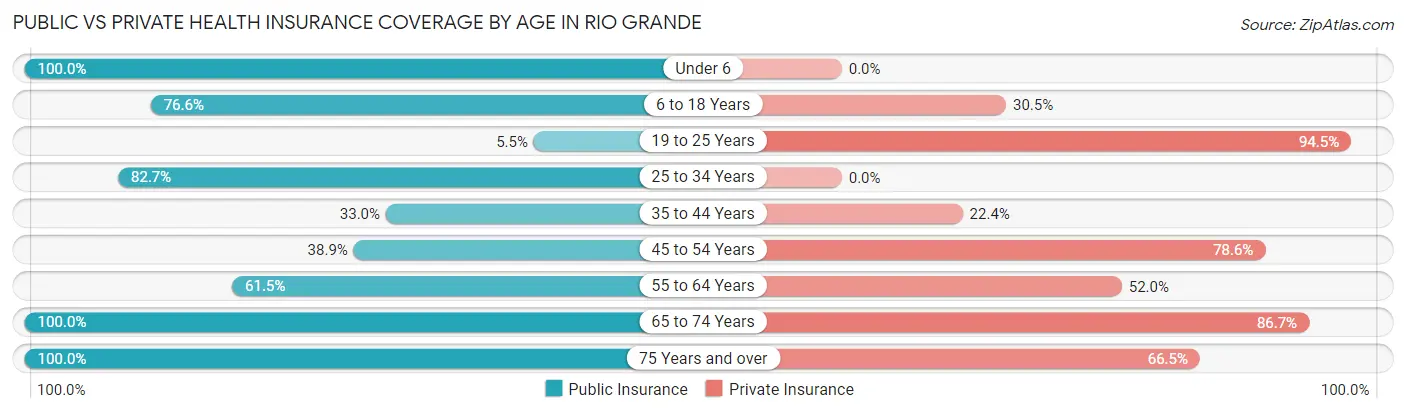
| Age Bracket | Public Insurance | Private Insurance |
| Under 6 | 135 (100.0%) | 0 (0.0%) |
| 6 to 18 Years | 314 (76.6%) | 125 (30.5%) |
| 19 to 25 Years | 8 (5.5%) | 138 (94.5%) |
| 25 to 34 Years | 148 (82.7%) | 0 (0.0%) |
| 35 to 44 Years | 144 (33.0%) | 98 (22.4%) |
| 45 to 54 Years | 209 (38.9%) | 422 (78.6%) |
| 55 to 64 Years | 265 (61.5%) | 224 (52.0%) |
| 65 to 74 Years | 782 (100.0%) | 678 (86.7%) |
| 75 Years and over | 307 (100.0%) | 204 (66.4%) |
| Total | 2,312 (68.7%) | 1,889 (56.1%) |
Disability Status by Sex by Age in Rio Grande
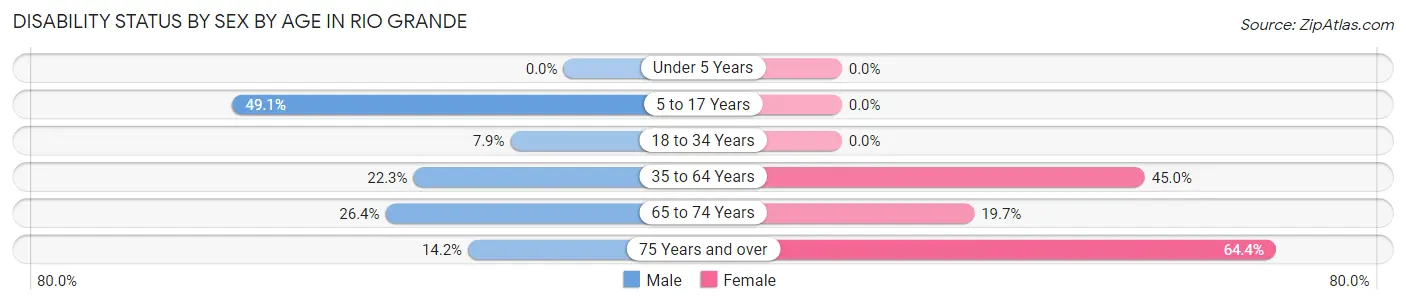
| Age Bracket | Male | Female |
| Under 5 Years | 0 (0.0%) | 0 (0.0%) |
| 5 to 17 Years | 111 (49.1%) | 0 (0.0%) |
| 18 to 34 Years | 21 (7.9%) | 0 (0.0%) |
| 35 to 64 Years | 155 (22.3%) | 319 (45.0%) |
| 65 to 74 Years | 83 (26.4%) | 92 (19.7%) |
| 75 Years and over | 18 (14.2%) | 116 (64.4%) |
Disability Class by Sex by Age in Rio Grande
Disability Class: Hearing Difficulty
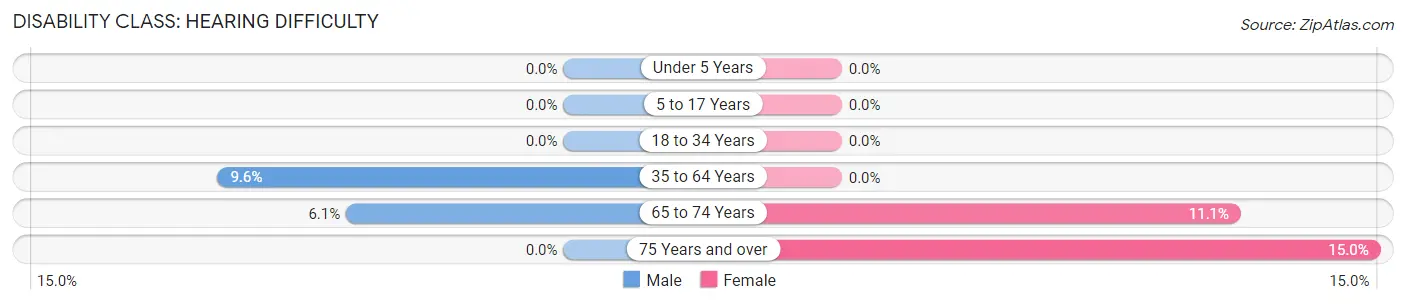
| Age Bracket | Male | Female |
| Under 5 Years | 0 (0.0%) | 0 (0.0%) |
| 5 to 17 Years | 0 (0.0%) | 0 (0.0%) |
| 18 to 34 Years | 0 (0.0%) | 0 (0.0%) |
| 35 to 64 Years | 67 (9.6%) | 0 (0.0%) |
| 65 to 74 Years | 19 (6.0%) | 52 (11.1%) |
| 75 Years and over | 0 (0.0%) | 27 (15.0%) |
Disability Class: Vision Difficulty
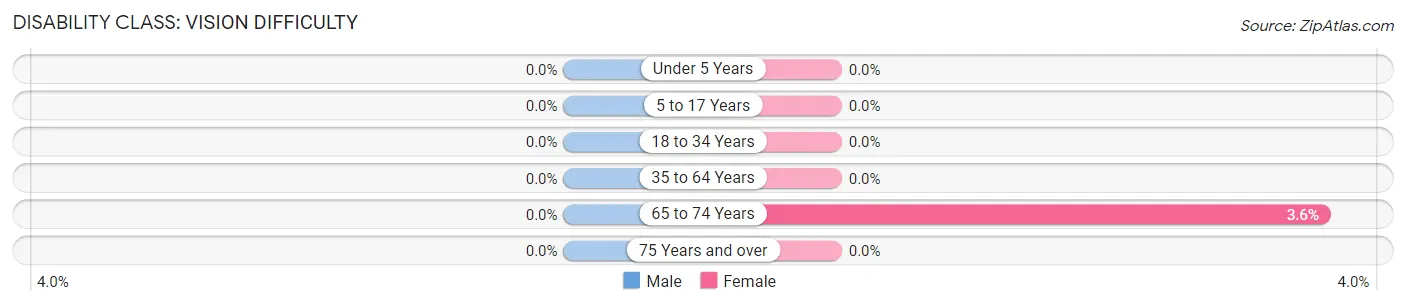
| Age Bracket | Male | Female |
| Under 5 Years | 0 (0.0%) | 0 (0.0%) |
| 5 to 17 Years | 0 (0.0%) | 0 (0.0%) |
| 18 to 34 Years | 0 (0.0%) | 0 (0.0%) |
| 35 to 64 Years | 0 (0.0%) | 0 (0.0%) |
| 65 to 74 Years | 0 (0.0%) | 17 (3.6%) |
| 75 Years and over | 0 (0.0%) | 0 (0.0%) |
Disability Class: Cognitive Difficulty
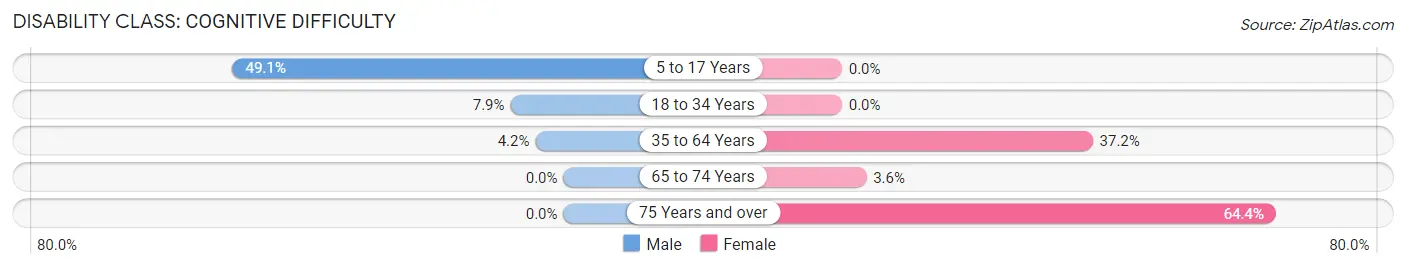
| Age Bracket | Male | Female |
| 5 to 17 Years | 111 (49.1%) | 0 (0.0%) |
| 18 to 34 Years | 21 (7.9%) | 0 (0.0%) |
| 35 to 64 Years | 29 (4.2%) | 264 (37.2%) |
| 65 to 74 Years | 0 (0.0%) | 17 (3.6%) |
| 75 Years and over | 0 (0.0%) | 116 (64.4%) |
Disability Class: Ambulatory Difficulty
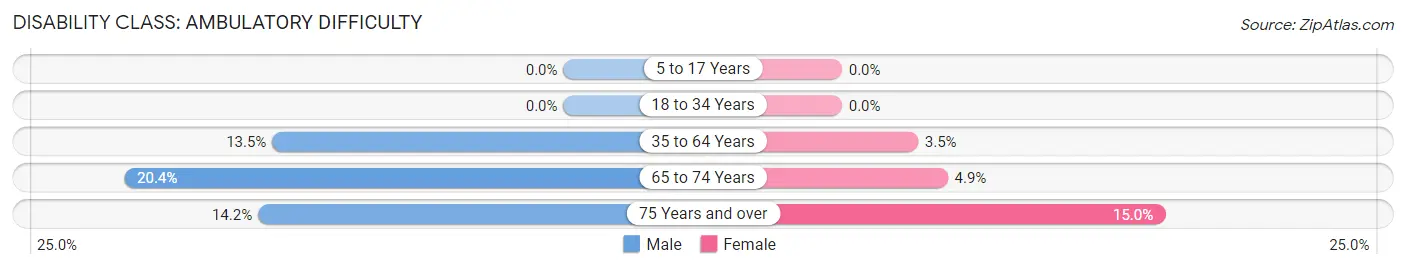
| Age Bracket | Male | Female |
| 5 to 17 Years | 0 (0.0%) | 0 (0.0%) |
| 18 to 34 Years | 0 (0.0%) | 0 (0.0%) |
| 35 to 64 Years | 94 (13.5%) | 25 (3.5%) |
| 65 to 74 Years | 64 (20.4%) | 23 (4.9%) |
| 75 Years and over | 18 (14.2%) | 27 (15.0%) |
Disability Class: Self-Care Difficulty
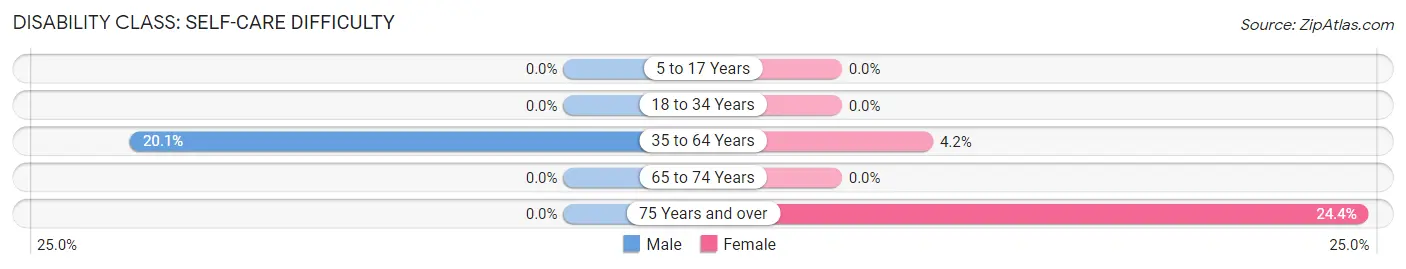
| Age Bracket | Male | Female |
| 5 to 17 Years | 0 (0.0%) | 0 (0.0%) |
| 18 to 34 Years | 0 (0.0%) | 0 (0.0%) |
| 35 to 64 Years | 140 (20.1%) | 30 (4.2%) |
| 65 to 74 Years | 0 (0.0%) | 0 (0.0%) |
| 75 Years and over | 0 (0.0%) | 44 (24.4%) |
Technology Access in Rio Grande
Computing Device Access in Rio Grande
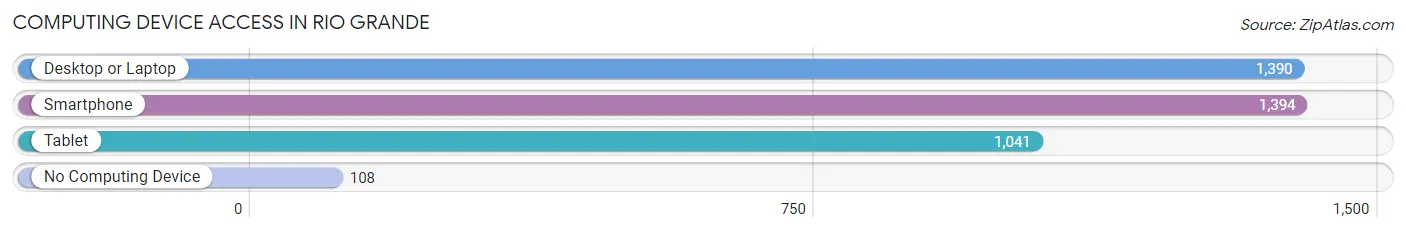
| Device Type | # Households | % Households |
| Desktop or Laptop | 1,390 | 84.7% |
| Smartphone | 1,394 | 84.9% |
| Tablet | 1,041 | 63.4% |
| No Computing Device | 108 | 6.6% |
| Total | 1,642 | 100.0% |
Internet Access in Rio Grande
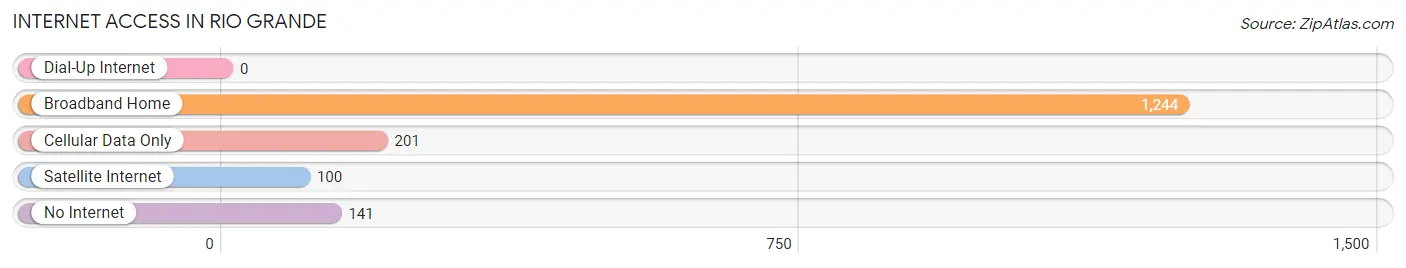
| Internet Type | # Households | % Households |
| Dial-Up Internet | 0 | 0.0% |
| Broadband Home | 1,244 | 75.8% |
| Cellular Data Only | 201 | 12.2% |
| Satellite Internet | 100 | 6.1% |
| No Internet | 141 | 8.6% |
| Total | 1,642 | 100.0% |
Rio Grande Summary
Rio Grande is a borough located in Cape May County, New Jersey, United States. It is part of the Ocean City Metropolitan Statistical Area. As of the 2010 United States Census, the borough's population was 2,831, reflecting an increase of 517 (+22.3%) from the 2,314 counted in the 2000 Census, which had in turn increased by 517 (+28.7%) from the 1,797 counted in the 1990 Census.
Geography
Rio Grande is located at 39°7′17″N 74°51′17″W (39.121400, -74.854700). According to the United States Census Bureau, the borough had a total area of 1.945 square miles (5.033 km2), including 1.944 square miles (5.030 km2) of land and 0.001 square miles (0.003 km2) of water (0.05%).
The borough borders the Cape May County municipalities of Middle Township and Dennis Township
Demographics
As of the 2010 United States Census, there were 2,831 people, 1,093 households, and 745.9 families residing in the borough. The population density was 1,461.3 per square mile (564.2/km2). There were 1,541 housing units at an average density of 793.3 per square mile (306.3/km2). The racial makeup of the borough was 91.45% (2,597) White, 3.45% (97) Black or African American, 0.14% (4) Native American, 1.45% (41) Asian, 0.00% (0) Pacific Islander, 2.17% (61) from other races, and 1.34% (38) from two or more races. Hispanic or Latino of any race were 6.90% (196) of the population.
There were 1,093 households out of which 28.2% had children under the age of 18 living with them, 48.2% were married couples living together, 13.7% had a female householder with no husband present, and 32.2% were non-families. 26.2% of all households were made up of individuals, and 11.2% had someone living alone who was 65 years of age or older. The average household size was 2.59 and the average family size was 3.14.
In the borough, the population was spread out with 22.3% under the age of 18, 8.2% from 18 to 24, 25.7% from 25 to 44, 28.2% from 45 to 64, and 15.6% who were 65 years of age or older. The median age was 40.7 years. For every 100 females there were 95.2 males. For every 100 females ages 18 and older there were 92.2 males.
The Census Bureau's 2006-2010 American Community Survey showed that (in 2010 inflation-adjusted dollars) median household income was $50,917 (with a margin of error of +/- $7,945) and the median family income was $60,000 (+/- $7,945). Males had a median income of $45,000 (+/- $7,945) versus $35,000 (+/- $7,945) for females. The per capita income for the borough was $25,917 (+/- $4,945). About 8.2% of families and 10.2% of the population were below the poverty line, including 15.2% of those under age 18 and 8.2% of those age 65 or over.
Economy
Rio Grande is home to several businesses, including a variety of retail stores, restaurants, and professional services. The borough is also home to the Seaview Square Mall, which is the largest shopping center in Cape May County. The mall features a variety of stores, including Macy's, JCPenney, and Sears.
The borough is also home to several manufacturing companies, including the Rio Grande Glass Company, which produces glass products for the automotive and construction industries. The company has been in business since the early 1900s and is one of the oldest businesses in the borough.
Rio Grande is also home to several medical facilities, including the Cape Regional Medical Center, which is a full-service hospital that provides a wide range of medical services. The hospital is also home to the Cape Regional Medical Center Cancer Center, which provides comprehensive cancer care and treatment.
Rio Grande is also home to several educational institutions, including the Richard Stockton College of New Jersey, which is a public university that offers a variety of undergraduate and graduate degree programs. The college is also home to the Richard Stockton College of New Jersey School of Business, which offers a variety of business-related degree programs.
Conclusion
Rio Grande is a borough located in Cape May County, New Jersey, United States. It is part of the Ocean City Metropolitan Statistical Area. As of the 2010 United States Census, the borough's population was 2,831, reflecting an increase of 517 (+22.3%) from the 2,314 counted in the 2000 Census. The borough is home to a variety of businesses, including retail stores, restaurants, and professional services. It is also home to the Seaview Square Mall, which is the largest shopping center in Cape May County. The borough is also home to several manufacturing companies, medical facilities, and educational institutions.
Common Questions
What is Per Capita Income in Rio Grande?
Per Capita income in Rio Grande is $47,113.
What is the Median Family Income in Rio Grande?
Median Family Income in Rio Grande is $86,282.
What is the Median Household income in Rio Grande?
Median Household Income in Rio Grande is $88,033.
What is Inequality or Gini Index in Rio Grande?
Inequality or Gini Index in Rio Grande is 0.42.
What is the Total Population of Rio Grande?
Total Population of Rio Grande is 3,364.
What is the Total Male Population of Rio Grande?
Total Male Population of Rio Grande is 1,630.
What is the Total Female Population of Rio Grande?
Total Female Population of Rio Grande is 1,734.
What is the Ratio of Males per 100 Females in Rio Grande?
There are 94.00 Males per 100 Females in Rio Grande.
What is the Ratio of Females per 100 Males in Rio Grande?
There are 106.38 Females per 100 Males in Rio Grande.
What is the Median Population Age in Rio Grande?
Median Population Age in Rio Grande is 53.2 Years.
What is the Average Family Size in Rio Grande
Average Family Size in Rio Grande is 2.5 People.
What is the Average Household Size in Rio Grande
Average Household Size in Rio Grande is 2.0 People.
How Large is the Labor Force in Rio Grande?
There are 1,435 People in the Labor Forcein in Rio Grande.
What is the Percentage of People in the Labor Force in Rio Grande?
50.9% of People are in the Labor Force in Rio Grande.
What is the Unemployment Rate in Rio Grande?
Unemployment Rate in Rio Grande is 20.4%.