Florence, NJ Map & Demographics
Florence Map
Florence Overview
$40,395
PER CAPITA INCOME
$110,202
AVG FAMILY INCOME
$95,096
AVG HOUSEHOLD INCOME
19.1%
WAGE / INCOME GAP [ % ]
80.9¢/ $1
WAGE / INCOME GAP [ $ ]
0.39
INEQUALITY / GINI INDEX
4,815
TOTAL POPULATION
2,349
MALE POPULATION
2,466
FEMALE POPULATION
95.26
MALES / 100 FEMALES
104.98
FEMALES / 100 MALES
39.3
MEDIAN AGE
3.4
AVG FAMILY SIZE
2.7
AVG HOUSEHOLD SIZE
3,015
LABOR FORCE [ PEOPLE ]
81.3%
PERCENT IN LABOR FORCE
6.0%
UNEMPLOYMENT RATE
Florence Zip Codes
Florence Area Codes
Income in Florence
Income Overview in Florence
Per Capita Income in Florence is $40,395, while median incomes of families and households are $110,202 and $95,096 respectively.
| Characteristic | Number | Measure |
| Per Capita Income | 4,815 | $40,395 |
| Median Family Income | 1,121 | $110,202 |
| Mean Family Income | 1,121 | $122,501 |
| Median Household Income | 1,758 | $95,096 |
| Mean Household Income | 1,758 | $105,319 |
| Income Deficit | 1,121 | $0 |
| Wage / Income Gap (%) | 4,815 | 19.09% |
| Wage / Income Gap ($) | 4,815 | 80.91¢ per $1 |
| Gini / Inequality Index | 4,815 | 0.39 |
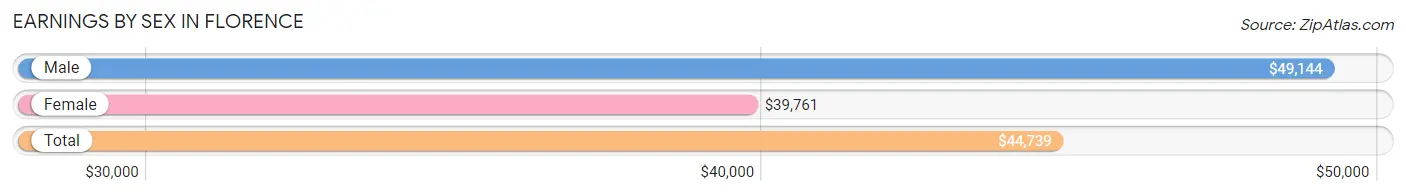
Earnings by Sex in Florence
Average Earnings in Florence are $44,739, $49,144 for men and $39,761 for women, a difference of 19.1%.
| Sex | Number | Average Earnings |
| Male | 1,462 (48.0%) | $49,144 |
| Female | 1,581 (52.0%) | $39,761 |
| Total | 3,043 (100.0%) | $44,739 |
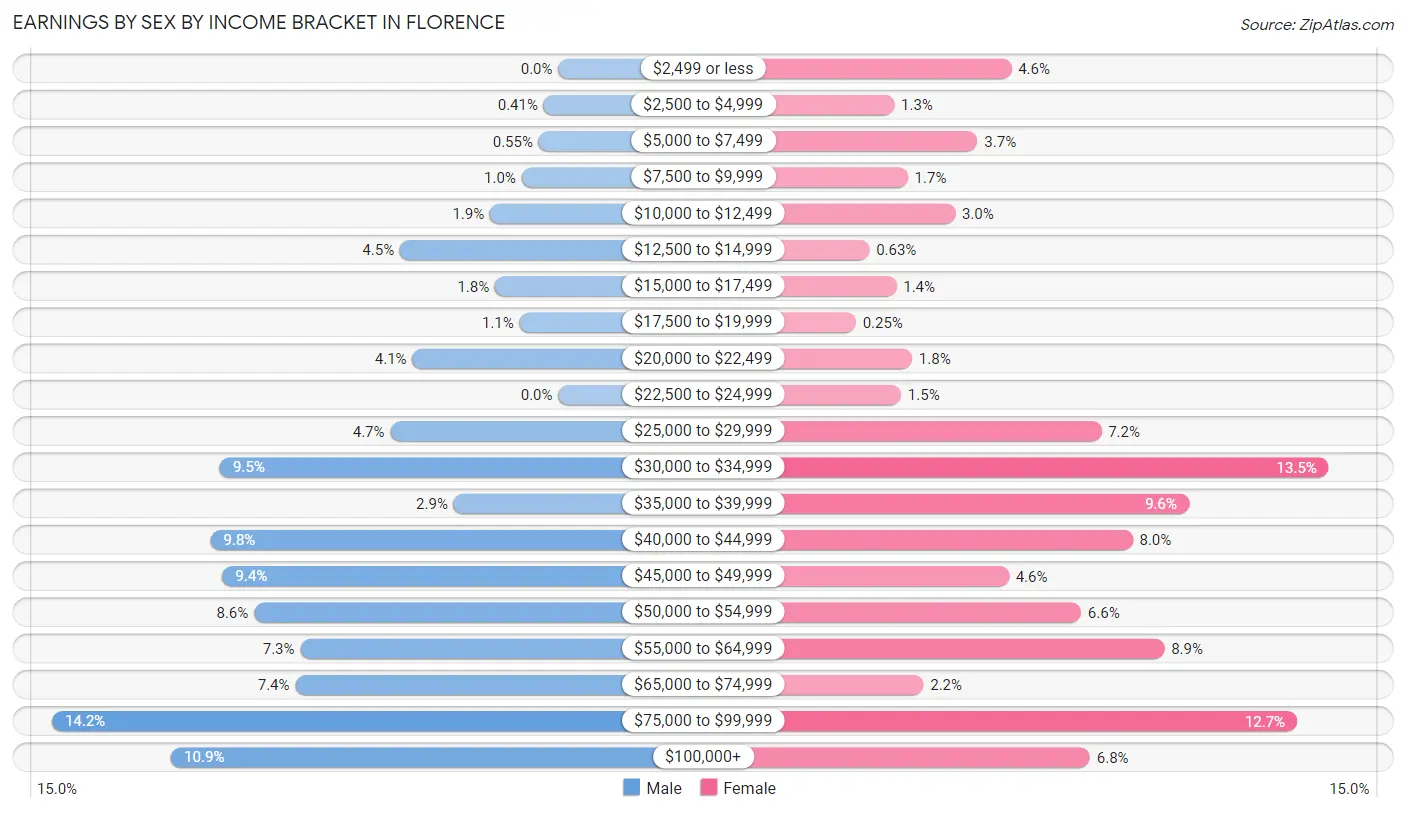
Earnings by Sex by Income Bracket in Florence
The most common earnings brackets in Florence are $75,000 to $99,999 for men (208 | 14.2%) and $30,000 to $34,999 for women (214 | 13.5%).
| Income | Male | Female |
| $2,499 or less | 0 (0.0%) | 73 (4.6%) |
| $2,500 to $4,999 | 6 (0.4%) | 21 (1.3%) |
| $5,000 to $7,499 | 8 (0.5%) | 58 (3.7%) |
| $7,500 to $9,999 | 15 (1.0%) | 27 (1.7%) |
| $10,000 to $12,499 | 28 (1.9%) | 48 (3.0%) |
| $12,500 to $14,999 | 65 (4.4%) | 10 (0.6%) |
| $15,000 to $17,499 | 26 (1.8%) | 22 (1.4%) |
| $17,500 to $19,999 | 16 (1.1%) | 4 (0.3%) |
| $20,000 to $22,499 | 60 (4.1%) | 29 (1.8%) |
| $22,500 to $24,999 | 0 (0.0%) | 24 (1.5%) |
| $25,000 to $29,999 | 69 (4.7%) | 113 (7.1%) |
| $30,000 to $34,999 | 139 (9.5%) | 214 (13.5%) |
| $35,000 to $39,999 | 43 (2.9%) | 152 (9.6%) |
| $40,000 to $44,999 | 143 (9.8%) | 127 (8.0%) |
| $45,000 to $49,999 | 138 (9.4%) | 72 (4.5%) |
| $50,000 to $54,999 | 125 (8.6%) | 104 (6.6%) |
| $55,000 to $64,999 | 106 (7.2%) | 141 (8.9%) |
| $65,000 to $74,999 | 108 (7.4%) | 34 (2.1%) |
| $75,000 to $99,999 | 208 (14.2%) | 200 (12.7%) |
| $100,000+ | 159 (10.9%) | 108 (6.8%) |
| Total | 1,462 (100.0%) | 1,581 (100.0%) |
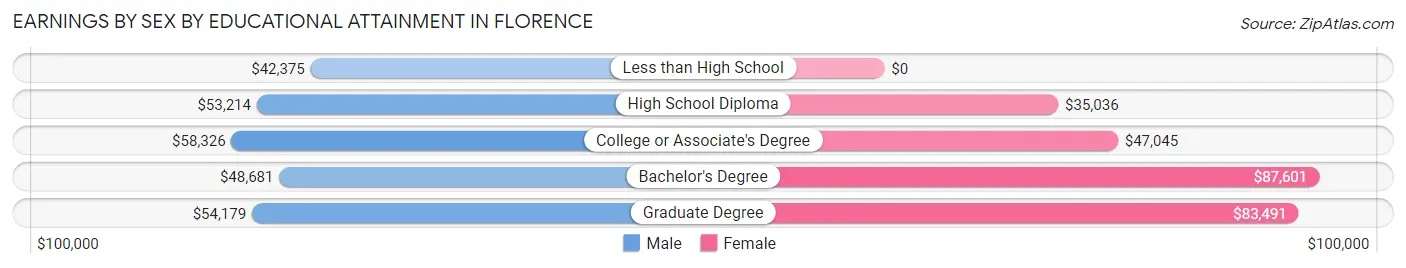
Earnings by Sex by Educational Attainment in Florence
Average earnings in Florence are $52,289 for men and $43,903 for women, a difference of 16.0%. Men with an educational attainment of college or associate's degree enjoy the highest average annual earnings of $58,326, while those with less than high school education earn the least with $42,375. Women with an educational attainment of bachelor's degree earn the most with the average annual earnings of $87,601, while those with high school diploma education have the smallest earnings of $35,036.
| Educational Attainment | Male Income | Female Income |
| Less than High School | $42,375 | $0 |
| High School Diploma | $53,214 | $35,036 |
| College or Associate's Degree | $58,326 | $47,045 |
| Bachelor's Degree | $48,681 | $87,601 |
| Graduate Degree | $54,179 | $83,491 |
| Total | $52,289 | $43,903 |
Family Income in Florence
Family Income Brackets in Florence
According to the Florence family income data, there are 425 families falling into the $100,000 to $149,999 income range, which is the most common income bracket and makes up 37.9% of all families.
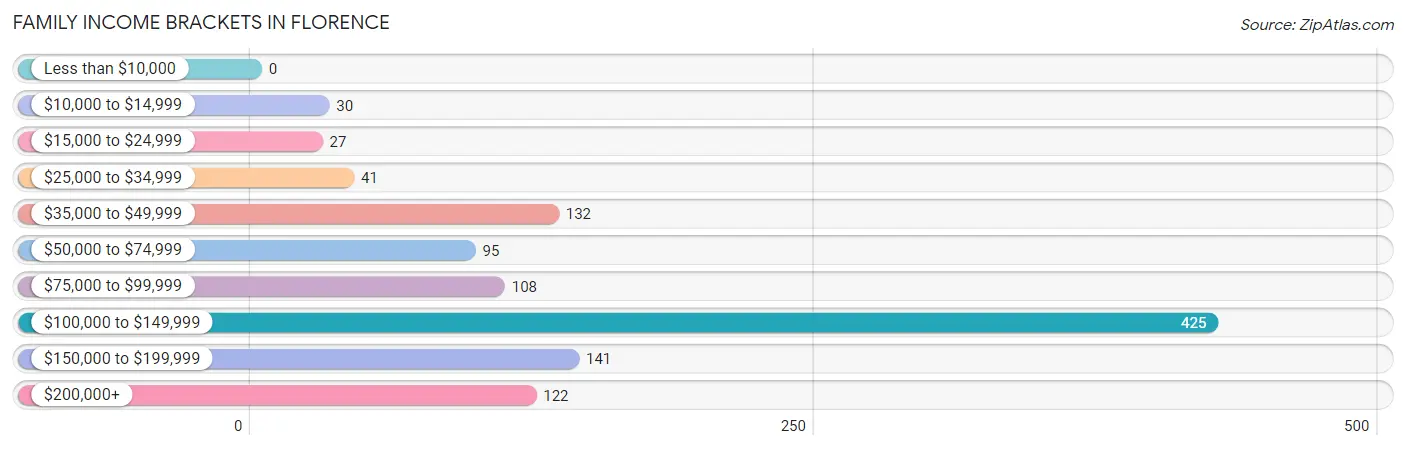
| Income Bracket | # Families | % Families |
| Less than $10,000 | 0 | 0.0% |
| $10,000 to $14,999 | 30 | 2.7% |
| $15,000 to $24,999 | 27 | 2.4% |
| $25,000 to $34,999 | 41 | 3.7% |
| $35,000 to $49,999 | 132 | 11.8% |
| $50,000 to $74,999 | 95 | 8.5% |
| $75,000 to $99,999 | 108 | 9.6% |
| $100,000 to $149,999 | 425 | 37.9% |
| $150,000 to $199,999 | 141 | 12.6% |
| $200,000+ | 122 | 10.9% |
Family Income by Famaliy Size in Florence
4-person families (289 | 25.8%) account for the highest median family income in Florence with $192,978 per family, while 2-person families (385 | 34.3%) have the highest median income of $52,242 per family member.
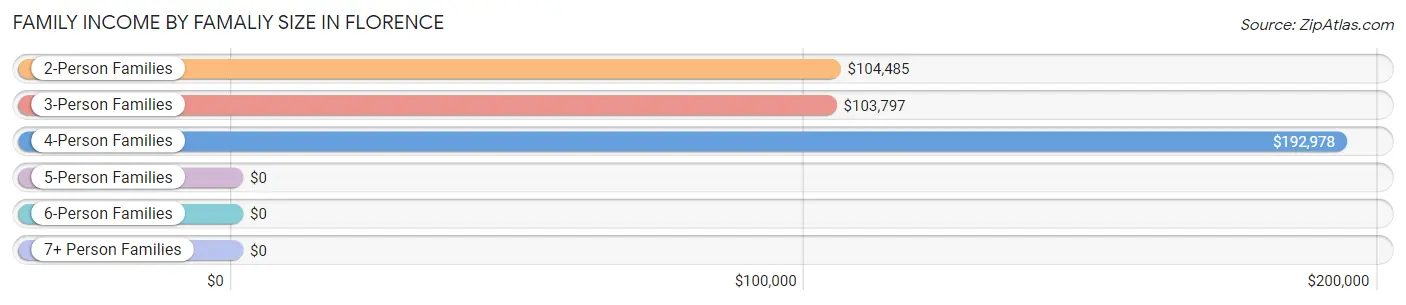
| Income Bracket | # Families | Median Income |
| 2-Person Families | 385 (34.3%) | $104,485 |
| 3-Person Families | 323 (28.8%) | $103,797 |
| 4-Person Families | 289 (25.8%) | $192,978 |
| 5-Person Families | 62 (5.5%) | $0 |
| 6-Person Families | 47 (4.2%) | $0 |
| 7+ Person Families | 15 (1.3%) | $0 |
| Total | 1,121 (100.0%) | $110,202 |
Family Income by Number of Earners in Florence
The median family income in Florence is $110,202, with families comprising 3+ earners (194) having the highest median family income of $138,889, while families with 1 earner (261) have the lowest median family income of $45,612, accounting for 17.3% and 23.3% of families, respectively.
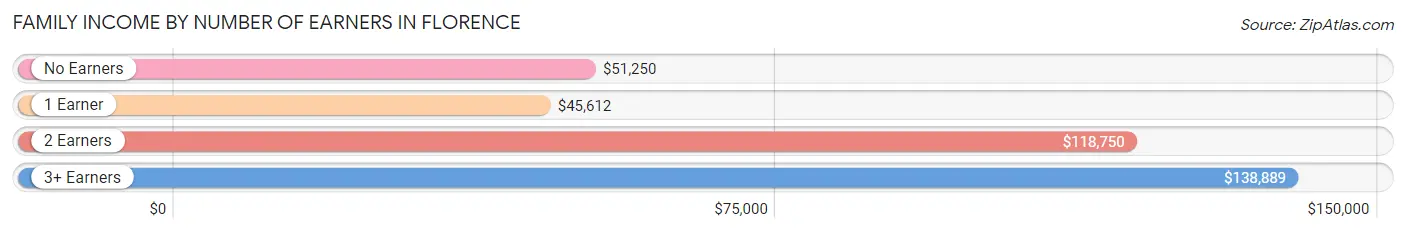
| Number of Earners | # Families | Median Income |
| No Earners | 56 (5.0%) | $51,250 |
| 1 Earner | 261 (23.3%) | $45,612 |
| 2 Earners | 610 (54.4%) | $118,750 |
| 3+ Earners | 194 (17.3%) | $138,889 |
| Total | 1,121 (100.0%) | $110,202 |
Household Income in Florence
Household Income Brackets in Florence
With 485 households falling in the category, the $100,000 to $149,999 income range is the most frequent in Florence, accounting for 27.6% of all households. In contrast, only 39 households (2.2%) fall into the $10,000 to $14,999 income bracket, making it the least populous group.
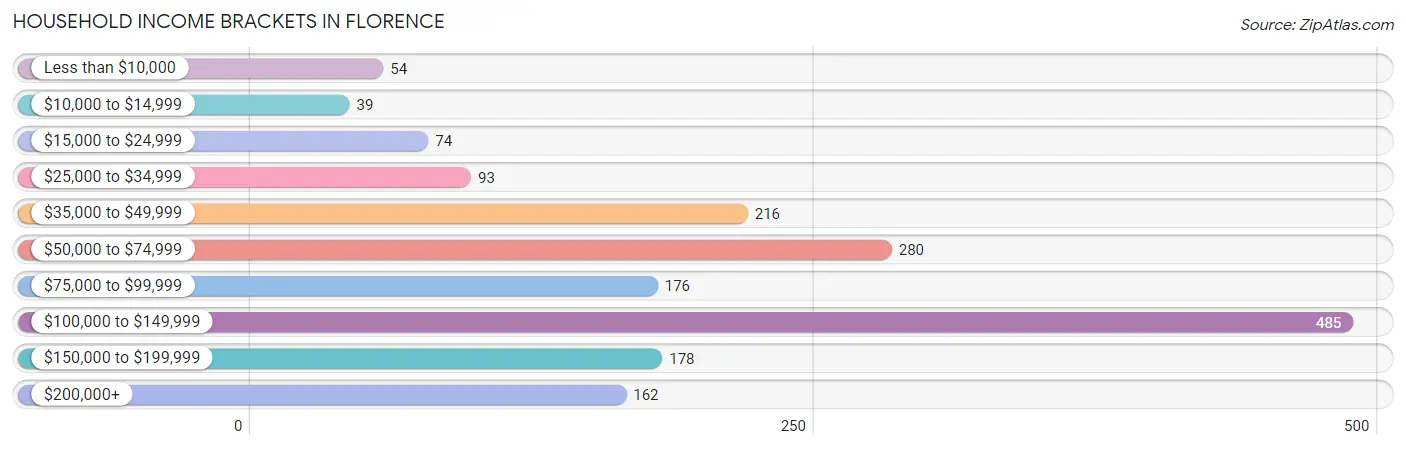
| Income Bracket | # Households | % Households |
| Less than $10,000 | 54 | 3.1% |
| $10,000 to $14,999 | 39 | 2.2% |
| $15,000 to $24,999 | 74 | 4.2% |
| $25,000 to $34,999 | 93 | 5.3% |
| $35,000 to $49,999 | 216 | 12.3% |
| $50,000 to $74,999 | 280 | 15.9% |
| $75,000 to $99,999 | 176 | 10.0% |
| $100,000 to $149,999 | 485 | 27.6% |
| $150,000 to $199,999 | 178 | 10.1% |
| $200,000+ | 162 | 9.2% |
Household Income by Householder Age in Florence
The median household income in Florence is $95,096, with the highest median household income of $104,500 found in the 45 to 64 years age bracket for the primary householder. A total of 650 households (37.0%) fall into this category. Meanwhile, the 15 to 24 years age bracket for the primary householder has the lowest median household income of $0, with 33 households (1.9%) in this group.
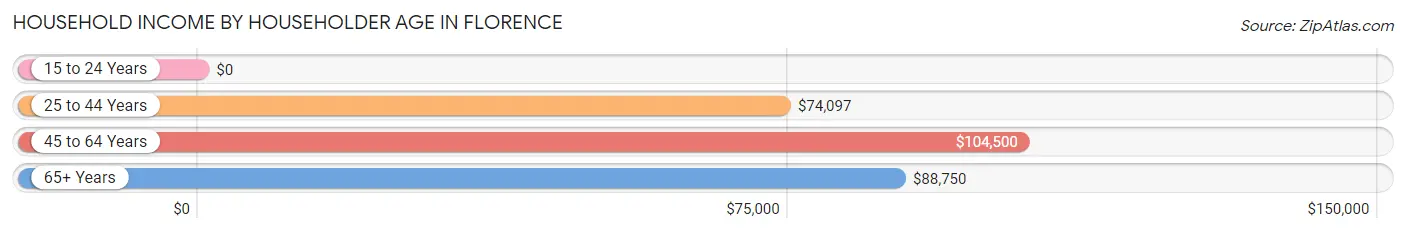
| Income Bracket | # Households | Median Income |
| 15 to 24 Years | 33 (1.9%) | $0 |
| 25 to 44 Years | 674 (38.3%) | $74,097 |
| 45 to 64 Years | 650 (37.0%) | $104,500 |
| 65+ Years | 401 (22.8%) | $88,750 |
| Total | 1,758 (100.0%) | $95,096 |
Poverty in Florence
Income Below Poverty by Sex and Age in Florence
With 3.8% poverty level for males and 8.7% for females among the residents of Florence, 16 and 17 year old males and under 5 year old females are the most vulnerable to poverty, with 13 males (100.0%) and 28 females (43.8%) in their respective age groups living below the poverty level.
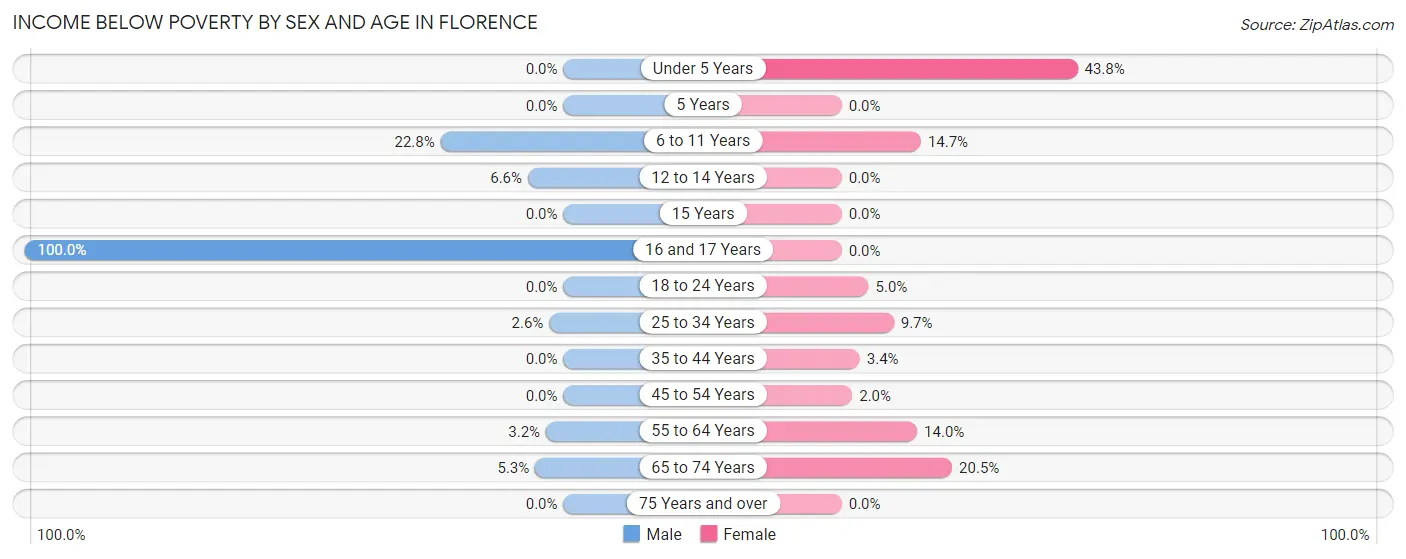
| Age Bracket | Male | Female |
| Under 5 Years | 0 (0.0%) | 28 (43.8%) |
| 5 Years | 0 (0.0%) | 0 (0.0%) |
| 6 to 11 Years | 31 (22.8%) | 31 (14.7%) |
| 12 to 14 Years | 16 (6.6%) | 0 (0.0%) |
| 15 Years | 0 (0.0%) | 0 (0.0%) |
| 16 and 17 Years | 13 (100.0%) | 0 (0.0%) |
| 18 to 24 Years | 0 (0.0%) | 9 (5.0%) |
| 25 to 34 Years | 8 (2.6%) | 33 (9.7%) |
| 35 to 44 Years | 0 (0.0%) | 16 (3.4%) |
| 45 to 54 Years | 0 (0.0%) | 6 (1.9%) |
| 55 to 64 Years | 11 (3.2%) | 40 (14.0%) |
| 65 to 74 Years | 9 (5.3%) | 51 (20.5%) |
| 75 Years and over | 0 (0.0%) | 0 (0.0%) |
| Total | 88 (3.8%) | 214 (8.7%) |
Income Above Poverty by Sex and Age in Florence
According to the poverty statistics in Florence, males aged under 5 years and females aged 12 to 14 years are the age groups that are most secure financially, with 100.0% of males and 100.0% of females in these age groups living above the poverty line.
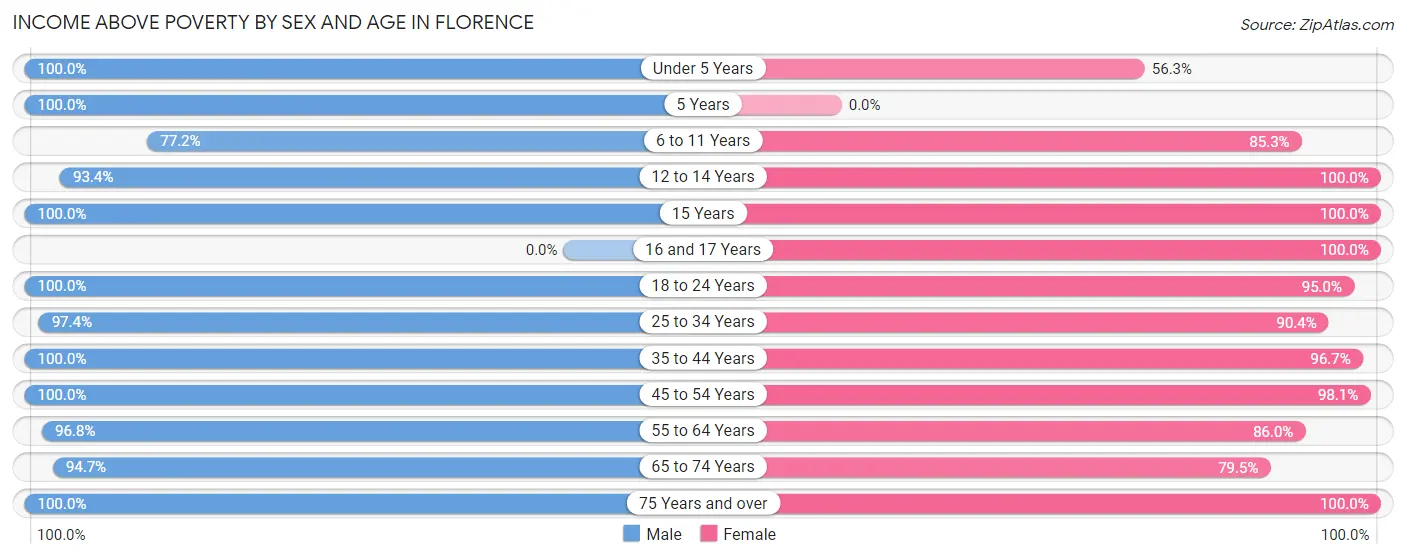
| Age Bracket | Male | Female |
| Under 5 Years | 103 (100.0%) | 36 (56.2%) |
| 5 Years | 70 (100.0%) | 0 (0.0%) |
| 6 to 11 Years | 105 (77.2%) | 180 (85.3%) |
| 12 to 14 Years | 227 (93.4%) | 50 (100.0%) |
| 15 Years | 57 (100.0%) | 149 (100.0%) |
| 16 and 17 Years | 0 (0.0%) | 21 (100.0%) |
| 18 to 24 Years | 196 (100.0%) | 172 (95.0%) |
| 25 to 34 Years | 296 (97.4%) | 309 (90.3%) |
| 35 to 44 Years | 310 (100.0%) | 462 (96.7%) |
| 45 to 54 Years | 351 (100.0%) | 302 (98.1%) |
| 55 to 64 Years | 328 (96.8%) | 246 (86.0%) |
| 65 to 74 Years | 162 (94.7%) | 198 (79.5%) |
| 75 Years and over | 49 (100.0%) | 110 (100.0%) |
| Total | 2,254 (96.2%) | 2,235 (91.3%) |
Income Below Poverty Among Married-Couple Families in Florence
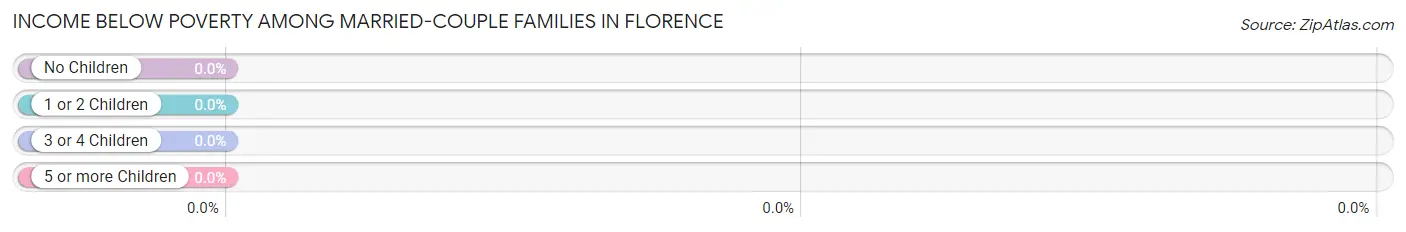
| Children | Above Poverty | Below Poverty |
| No Children | 347 (100.0%) | 0 (0.0%) |
| 1 or 2 Children | 386 (100.0%) | 0 (0.0%) |
| 3 or 4 Children | 0 (0.0%) | 0 (0.0%) |
| 5 or more Children | 0 (0.0%) | 0 (0.0%) |
| Total | 733 (100.0%) | 0 (0.0%) |
Income Below Poverty Among Single-Parent Households in Florence
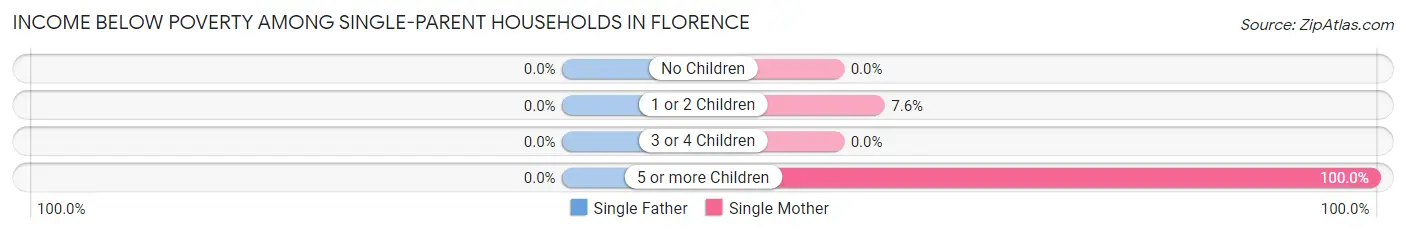
| Children | Single Father | Single Mother |
| No Children | 0 (0.0%) | 0 (0.0%) |
| 1 or 2 Children | 0 (0.0%) | 16 (7.6%) |
| 3 or 4 Children | 0 (0.0%) | 0 (0.0%) |
| 5 or more Children | 0 (0.0%) | 14 (100.0%) |
| Total | 0 (0.0%) | 30 (10.0%) |
Income Below Poverty Among Married-Couple vs Single-Parent Households in Florence
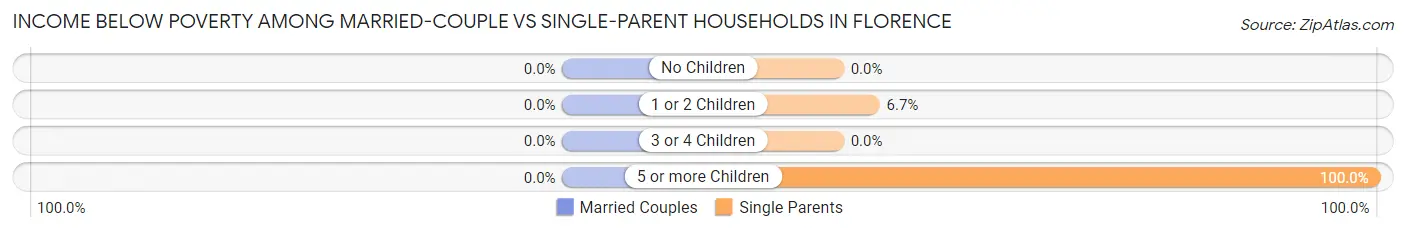
| Children | Married-Couple Families | Single-Parent Households |
| No Children | 0 (0.0%) | 0 (0.0%) |
| 1 or 2 Children | 0 (0.0%) | 16 (6.7%) |
| 3 or 4 Children | 0 (0.0%) | 0 (0.0%) |
| 5 or more Children | 0 (0.0%) | 14 (100.0%) |
| Total | 0 (0.0%) | 30 (7.7%) |
Race in Florence
The most populous races in Florence are White / Caucasian (3,319 | 68.9%), Black / African American (705 | 14.6%), and Hispanic or Latino (501 | 10.4%).
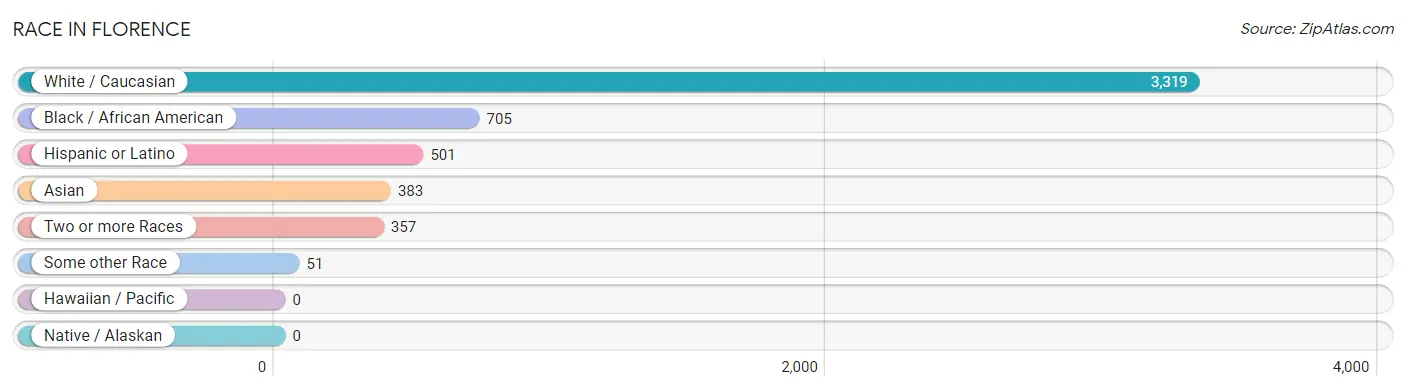
| Race | # Population | % Population |
| Asian | 383 | 8.0% |
| Black / African American | 705 | 14.6% |
| Hawaiian / Pacific | 0 | 0.0% |
| Hispanic or Latino | 501 | 10.4% |
| Native / Alaskan | 0 | 0.0% |
| White / Caucasian | 3,319 | 68.9% |
| Two or more Races | 357 | 7.4% |
| Some other Race | 51 | 1.1% |
| Total | 4,815 | 100.0% |
Ancestry in Florence
The most populous ancestries reported in Florence are Irish (880 | 18.3%), German (793 | 16.5%), English (602 | 12.5%), Italian (571 | 11.9%), and Polish (400 | 8.3%), together accounting for 67.4% of all Florence residents.
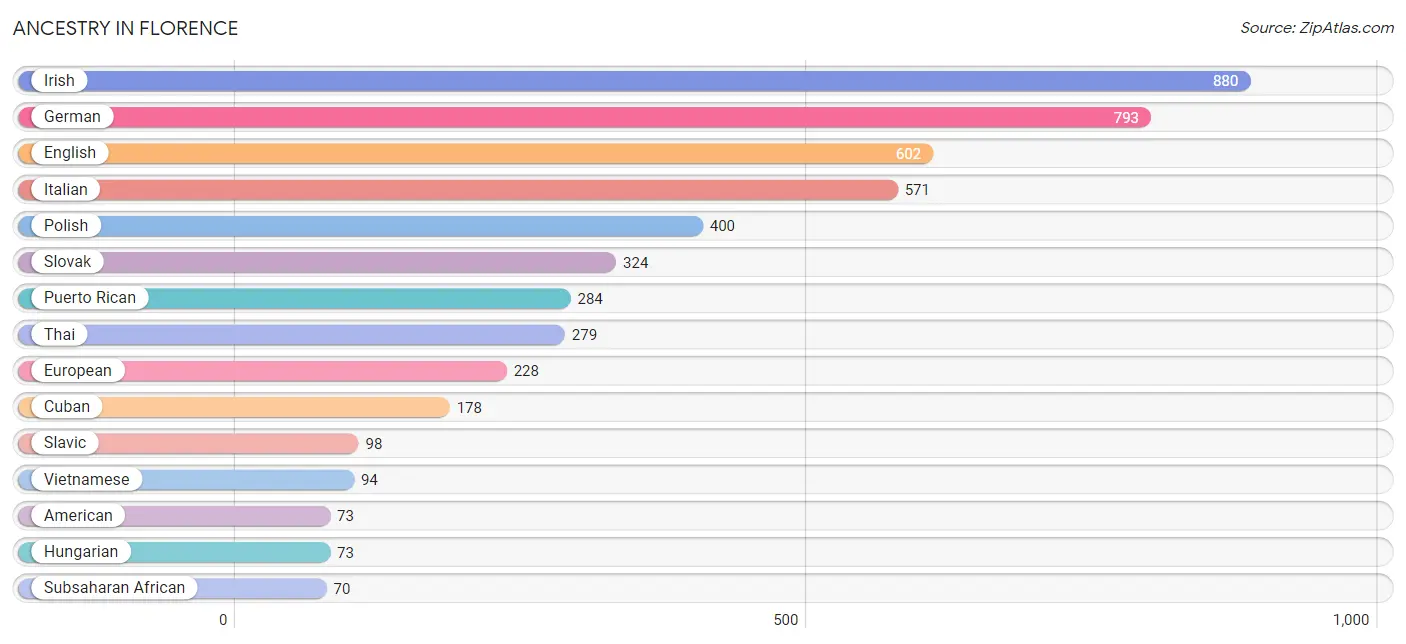
| Ancestry | # Population | % Population |
| American | 73 | 1.5% |
| Apache | 9 | 0.2% |
| Arab | 43 | 0.9% |
| Austrian | 4 | 0.1% |
| Belgian | 15 | 0.3% |
| Central American | 23 | 0.5% |
| Chippewa | 9 | 0.2% |
| Cuban | 178 | 3.7% |
| Czechoslovakian | 22 | 0.5% |
| Delaware | 24 | 0.5% |
| Dominican | 16 | 0.3% |
| Dutch | 13 | 0.3% |
| Eastern European | 10 | 0.2% |
| English | 602 | 12.5% |
| European | 228 | 4.7% |
| Filipino | 7 | 0.2% |
| French | 47 | 1.0% |
| French Canadian | 31 | 0.6% |
| German | 793 | 16.5% |
| Haitian | 24 | 0.5% |
| Honduran | 23 | 0.5% |
| Hungarian | 73 | 1.5% |
| Indian (Asian) | 15 | 0.3% |
| Irish | 880 | 18.3% |
| Iroquois | 7 | 0.2% |
| Italian | 571 | 11.9% |
| Lebanese | 43 | 0.9% |
| Lithuanian | 9 | 0.2% |
| Pakistani | 4 | 0.1% |
| Polish | 400 | 8.3% |
| Portuguese | 12 | 0.3% |
| Puerto Rican | 284 | 5.9% |
| Romanian | 31 | 0.6% |
| Russian | 36 | 0.7% |
| Scotch-Irish | 4 | 0.1% |
| Scottish | 8 | 0.2% |
| Slavic | 98 | 2.0% |
| Slovak | 324 | 6.7% |
| Sri Lankan | 1 | 0.0% |
| Subsaharan African | 70 | 1.5% |
| Swedish | 24 | 0.5% |
| Thai | 279 | 5.8% |
| Turkish | 63 | 1.3% |
| Ukrainian | 4 | 0.1% |
| Vietnamese | 94 | 1.9% |
| Welsh | 8 | 0.2% | View All 46 Rows |
Immigrants in Florence
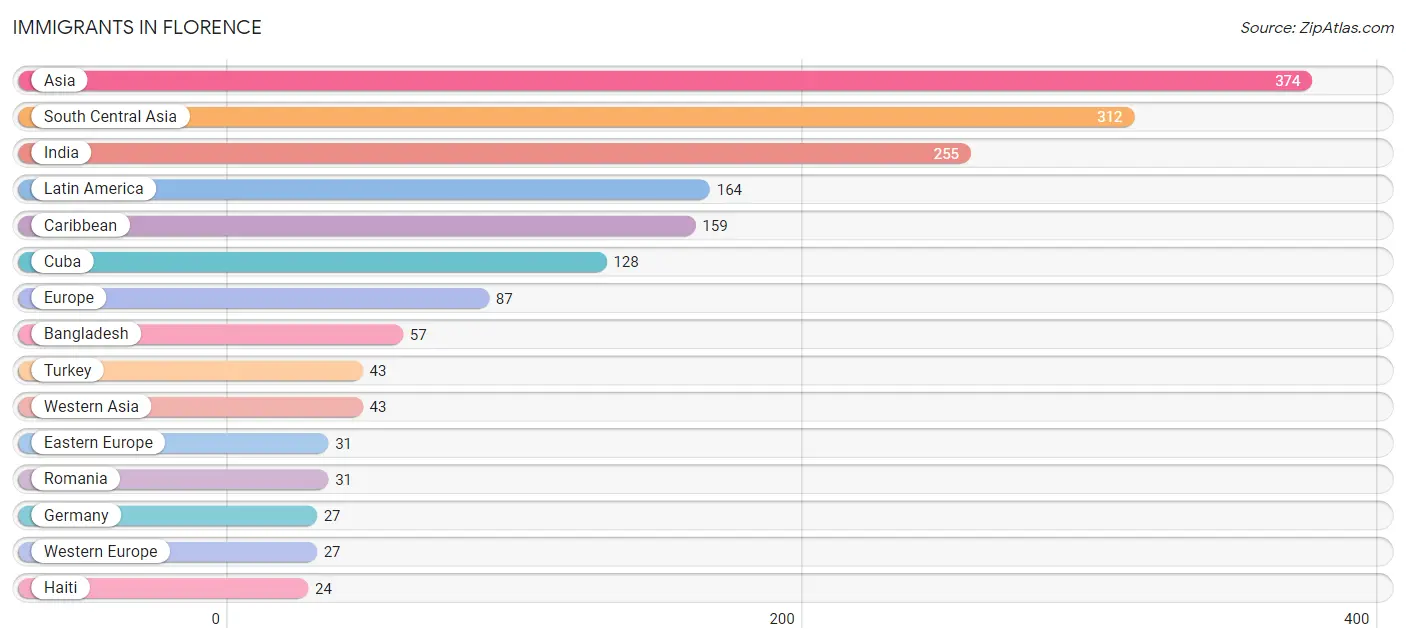
The most numerous immigrant groups reported in Florence came from Asia (374 | 7.8%), South Central Asia (312 | 6.5%), India (255 | 5.3%), Latin America (164 | 3.4%), and Caribbean (159 | 3.3%), together accounting for 26.3% of all Florence residents.
| Immigration Origin | # Population | % Population |
| Asia | 374 | 7.8% |
| Bangladesh | 57 | 1.2% |
| Canada | 9 | 0.2% |
| Caribbean | 159 | 3.3% |
| Central America | 5 | 0.1% |
| China | 15 | 0.3% |
| Cuba | 128 | 2.7% |
| Dominican Republic | 7 | 0.2% |
| Eastern Asia | 15 | 0.3% |
| Eastern Europe | 31 | 0.6% |
| England | 9 | 0.2% |
| Europe | 87 | 1.8% |
| Germany | 27 | 0.6% |
| Guatemala | 5 | 0.1% |
| Haiti | 24 | 0.5% |
| India | 255 | 5.3% |
| Italy | 20 | 0.4% |
| Latin America | 164 | 3.4% |
| Northern Europe | 9 | 0.2% |
| Romania | 31 | 0.6% |
| South Central Asia | 312 | 6.5% |
| South Eastern Asia | 4 | 0.1% |
| Southern Europe | 20 | 0.4% |
| Thailand | 4 | 0.1% |
| Turkey | 43 | 0.9% |
| Western Asia | 43 | 0.9% |
| Western Europe | 27 | 0.6% | View All 27 Rows |
Sex and Age in Florence
Sex and Age in Florence
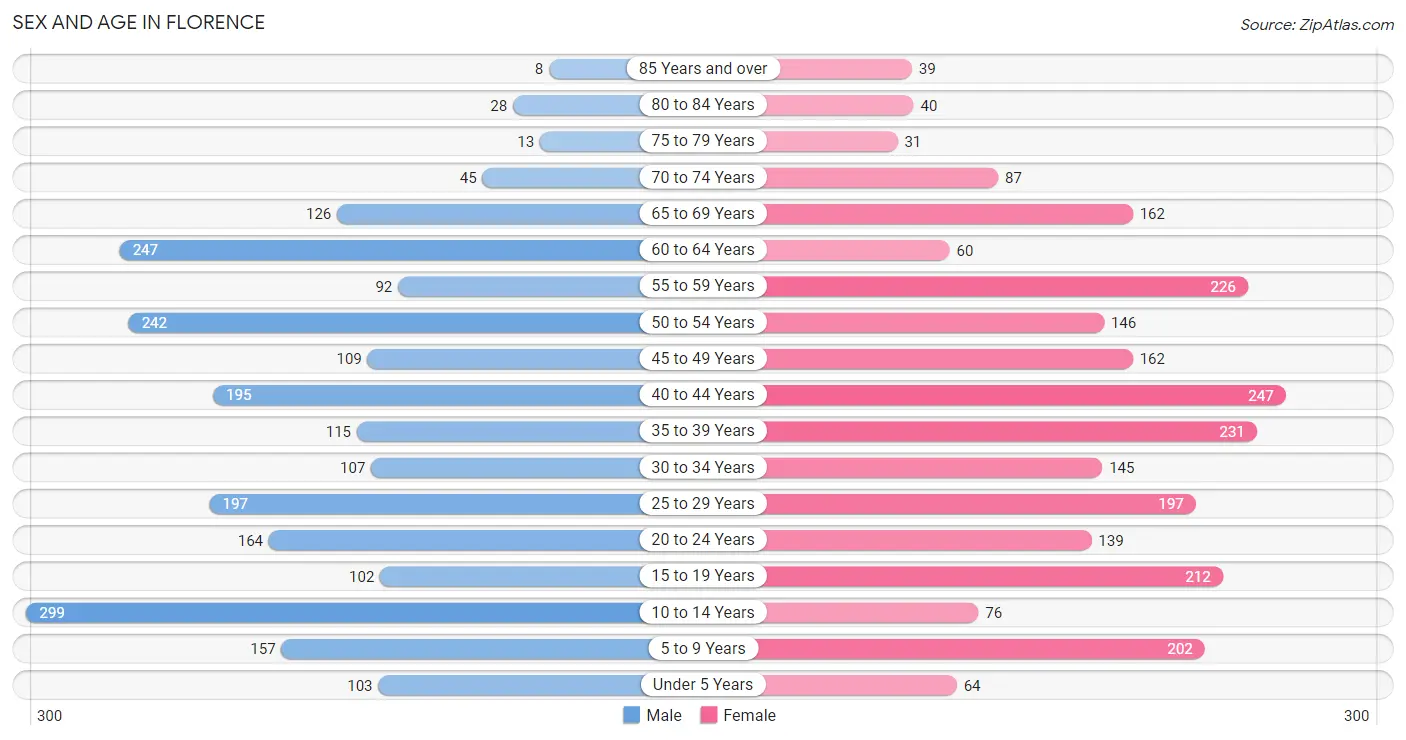
The most populous age groups in Florence are 10 to 14 Years (299 | 12.7%) for men and 40 to 44 Years (247 | 10.0%) for women.
| Age Bracket | Male | Female |
| Under 5 Years | 103 (4.4%) | 64 (2.6%) |
| 5 to 9 Years | 157 (6.7%) | 202 (8.2%) |
| 10 to 14 Years | 299 (12.7%) | 76 (3.1%) |
| 15 to 19 Years | 102 (4.3%) | 212 (8.6%) |
| 20 to 24 Years | 164 (7.0%) | 139 (5.6%) |
| 25 to 29 Years | 197 (8.4%) | 197 (8.0%) |
| 30 to 34 Years | 107 (4.6%) | 145 (5.9%) |
| 35 to 39 Years | 115 (4.9%) | 231 (9.4%) |
| 40 to 44 Years | 195 (8.3%) | 247 (10.0%) |
| 45 to 49 Years | 109 (4.6%) | 162 (6.6%) |
| 50 to 54 Years | 242 (10.3%) | 146 (5.9%) |
| 55 to 59 Years | 92 (3.9%) | 226 (9.2%) |
| 60 to 64 Years | 247 (10.5%) | 60 (2.4%) |
| 65 to 69 Years | 126 (5.4%) | 162 (6.6%) |
| 70 to 74 Years | 45 (1.9%) | 87 (3.5%) |
| 75 to 79 Years | 13 (0.5%) | 31 (1.3%) |
| 80 to 84 Years | 28 (1.2%) | 40 (1.6%) |
| 85 Years and over | 8 (0.3%) | 39 (1.6%) |
| Total | 2,349 (100.0%) | 2,466 (100.0%) |
Families and Households in Florence
Median Family Size in Florence
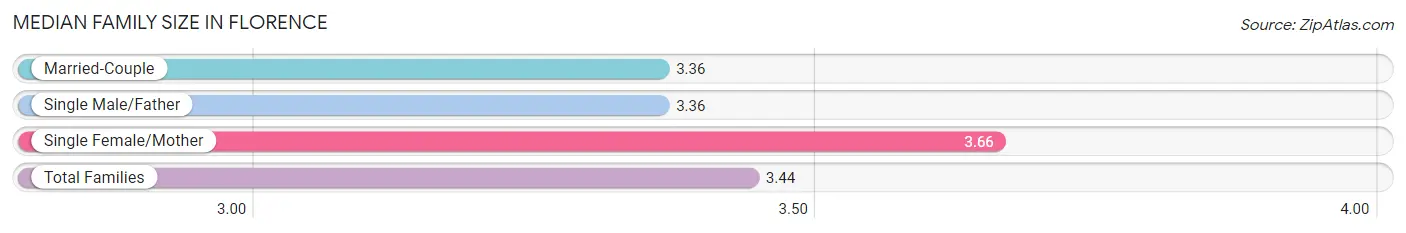
The median family size in Florence is 3.44 persons per family, with single female/mother families (299 | 26.7%) accounting for the largest median family size of 3.66 persons per family. On the other hand, married-couple families (733 | 65.4%) represent the smallest median family size with 3.36 persons per family.
| Family Type | # Families | Family Size |
| Married-Couple | 733 (65.4%) | 3.36 |
| Single Male/Father | 89 (7.9%) | 3.36 |
| Single Female/Mother | 299 (26.7%) | 3.66 |
| Total Families | 1,121 (100.0%) | 3.44 |
Median Household Size in Florence
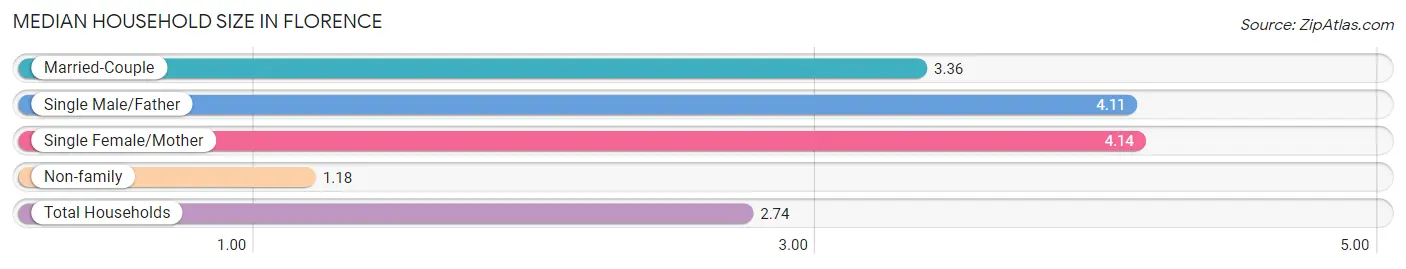
The median household size in Florence is 2.74 persons per household, with single female/mother households (299 | 17.0%) accounting for the largest median household size of 4.14 persons per household. non-family households (637 | 36.2%) represent the smallest median household size with 1.18 persons per household.
| Household Type | # Households | Household Size |
| Married-Couple | 733 (41.7%) | 3.36 |
| Single Male/Father | 89 (5.1%) | 4.11 |
| Single Female/Mother | 299 (17.0%) | 4.14 |
| Non-family | 637 (36.2%) | 1.18 |
| Total Households | 1,758 (100.0%) | 2.74 |
Household Size by Marriage Status in Florence
Out of a total of 1,758 households in Florence, 1,121 (63.8%) are family households, while 637 (36.2%) are nonfamily households. The most numerous type of family households are 4-person households, comprising 347, and the most common type of nonfamily households are 1-person households, comprising 550.
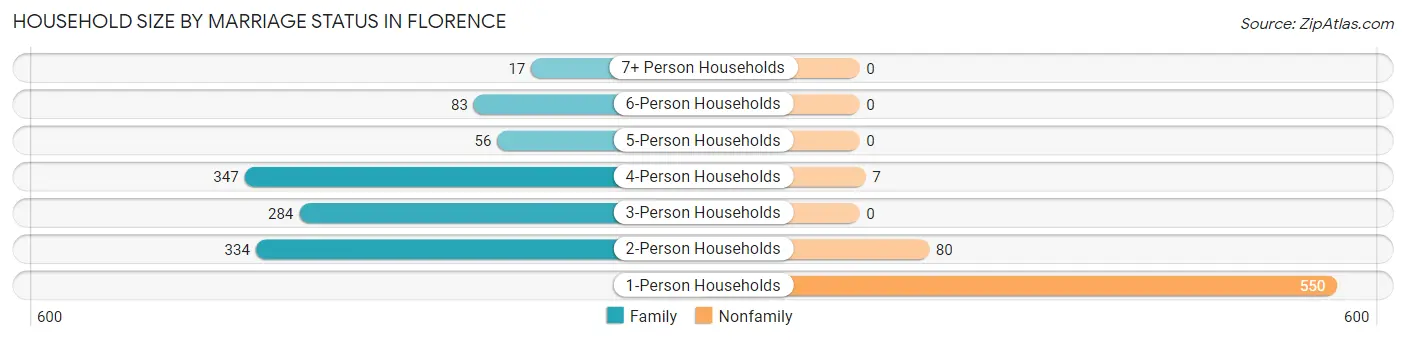
| Household Size | Family Households | Nonfamily Households |
| 1-Person Households | - | 550 (31.3%) |
| 2-Person Households | 334 (19.0%) | 80 (4.5%) |
| 3-Person Households | 284 (16.2%) | 0 (0.0%) |
| 4-Person Households | 347 (19.7%) | 7 (0.4%) |
| 5-Person Households | 56 (3.2%) | 0 (0.0%) |
| 6-Person Households | 83 (4.7%) | 0 (0.0%) |
| 7+ Person Households | 17 (1.0%) | 0 (0.0%) |
| Total | 1,121 (63.8%) | 637 (36.2%) |
Female Fertility in Florence
Fertility by Age in Florence
Average fertility rate in Florence is 37.0 births per 1,000 women. Women in the age bracket of 20 to 34 years have the highest fertility rate with 85.0 births per 1,000 women. Women in the age bracket of 20 to 34 years acount for 82.0% of all women with births.
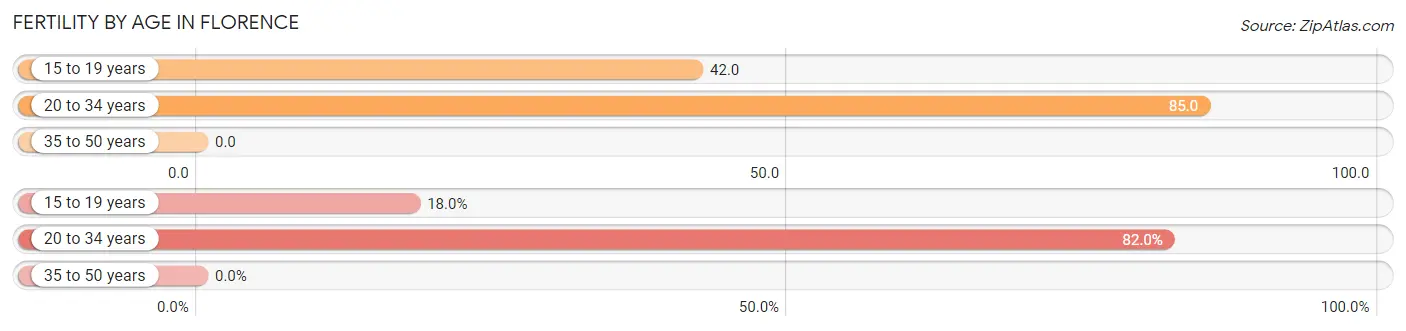
| Age Bracket | Women with Births | Births / 1,000 Women |
| 15 to 19 years | 9 (18.0%) | 42.0 |
| 20 to 34 years | 41 (82.0%) | 85.0 |
| 35 to 50 years | 0 (0.0%) | 0.0 |
| Total | 50 (100.0%) | 37.0 |
Fertility by Age by Marriage Status in Florence
72.0% of women with births (50) in Florence are married. The highest percentage of unmarried women with births falls into 15 to 19 years age bracket with 100.0% of them unmarried at the time of birth, while the lowest percentage of unmarried women with births belong to 20 to 34 years age bracket with 12.2% of them unmarried.
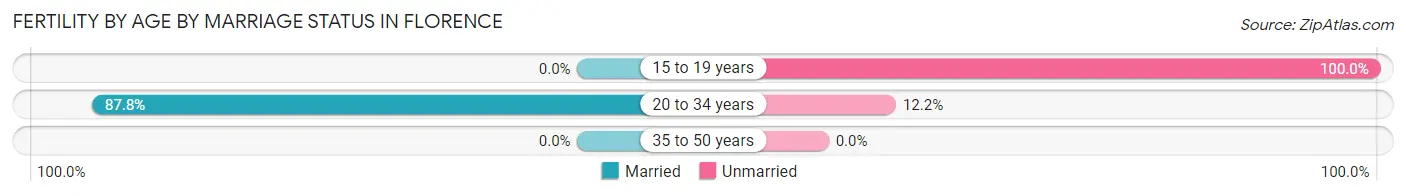
| Age Bracket | Married | Unmarried |
| 15 to 19 years | 0 (0.0%) | 9 (100.0%) |
| 20 to 34 years | 36 (87.8%) | 5 (12.2%) |
| 35 to 50 years | 0 (0.0%) | 0 (0.0%) |
| Total | 36 (72.0%) | 14 (28.0%) |
Fertility by Education in Florence
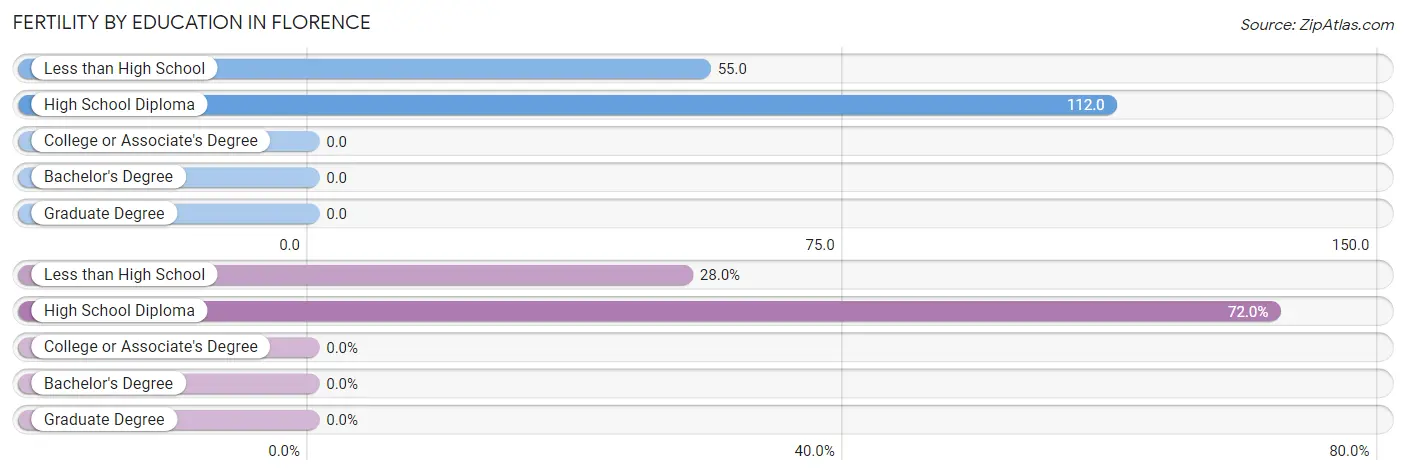
| Educational Attainment | Women with Births | Births / 1,000 Women |
| Less than High School | 14 (28.0%) | 55.0 |
| High School Diploma | 36 (72.0%) | 112.0 |
| College or Associate's Degree | 0 (0.0%) | 0.0 |
| Bachelor's Degree | 0 (0.0%) | 0.0 |
| Graduate Degree | 0 (0.0%) | 0.0 |
| Total | 50 (100.0%) | 37.0 |
Fertility by Education by Marriage Status in Florence
28.0% of women with births in Florence are unmarried. Women with the educational attainment of high school diploma are most likely to be married with 100.0% of them married at childbirth, while women with the educational attainment of less than high school are least likely to be married with 100.0% of them unmarried at childbirth.
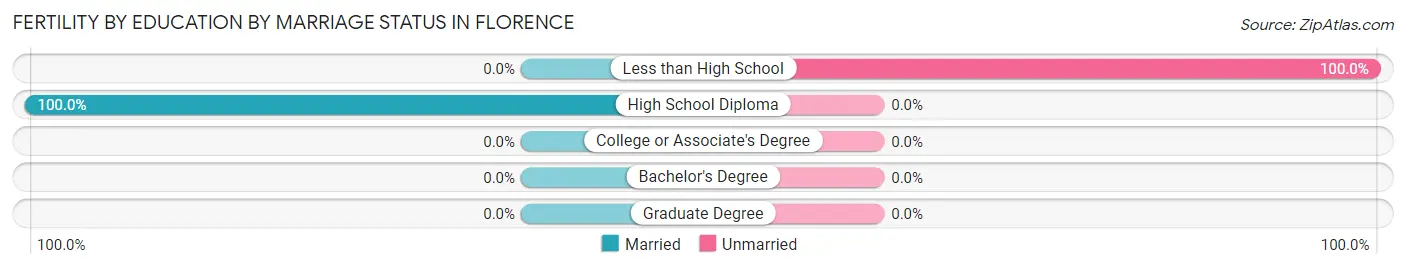
| Educational Attainment | Married | Unmarried |
| Less than High School | 0 (0.0%) | 14 (100.0%) |
| High School Diploma | 36 (100.0%) | 0 (0.0%) |
| College or Associate's Degree | 0 (0.0%) | 0 (0.0%) |
| Bachelor's Degree | 0 (0.0%) | 0 (0.0%) |
| Graduate Degree | 0 (0.0%) | 0 (0.0%) |
| Total | 36 (72.0%) | 14 (28.0%) |
Employment Characteristics in Florence
Employment by Class of Employer in Florence
Among the 2,653 employed individuals in Florence, private company employees (2,187 | 82.4%), state government employees (173 | 6.5%), and local government employees (115 | 4.3%) make up the most common classes of employment.
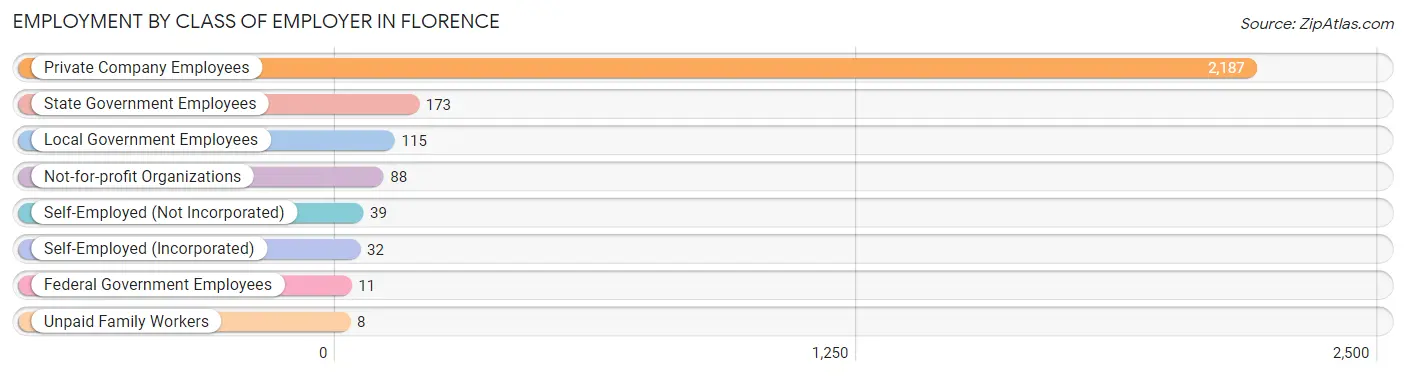
| Employer Class | # Employees | % Employees |
| Private Company Employees | 2,187 | 82.4% |
| Self-Employed (Incorporated) | 32 | 1.2% |
| Self-Employed (Not Incorporated) | 39 | 1.5% |
| Not-for-profit Organizations | 88 | 3.3% |
| Local Government Employees | 115 | 4.3% |
| State Government Employees | 173 | 6.5% |
| Federal Government Employees | 11 | 0.4% |
| Unpaid Family Workers | 8 | 0.3% |
| Total | 2,653 | 100.0% |
Employment Status by Age in Florence
According to the labor force statistics for Florence, out of the total population over 16 years of age (3,708), 81.3% or 3,015 individuals are in the labor force, with 6.0% or 181 of them unemployed. The age group with the highest labor force participation rate is 20 to 24 years, with 100.0% or 303 individuals in the labor force. Within the labor force, the 55 to 59 years age range has the highest percentage of unemployed individuals, with 14.6% or 40 of them being unemployed.
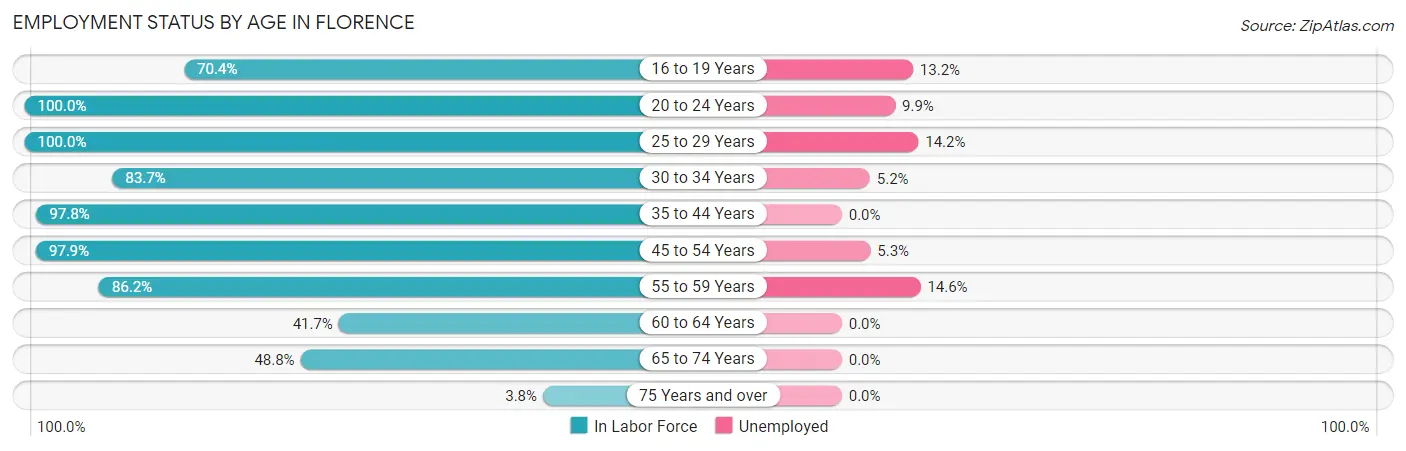
| Age Bracket | In Labor Force | Unemployed |
| 16 to 19 Years | 76 (70.4%) | 10 (13.2%) |
| 20 to 24 Years | 303 (100.0%) | 30 (9.9%) |
| 25 to 29 Years | 394 (100.0%) | 56 (14.2%) |
| 30 to 34 Years | 211 (83.7%) | 11 (5.2%) |
| 35 to 44 Years | 771 (97.8%) | 0 (0.0%) |
| 45 to 54 Years | 645 (97.9%) | 34 (5.3%) |
| 55 to 59 Years | 274 (86.2%) | 40 (14.6%) |
| 60 to 64 Years | 128 (41.7%) | 0 (0.0%) |
| 65 to 74 Years | 205 (48.8%) | 0 (0.0%) |
| 75 Years and over | 6 (3.8%) | 0 (0.0%) |
| Total | 3,015 (81.3%) | 181 (6.0%) |
Employment Status by Educational Attainment in Florence
According to labor force statistics for Florence, 89.1% of individuals (2,422) out of the total population between 25 and 64 years of age (2,718) are in the labor force, with 5.8% or 140 of them being unemployed. The group with the highest labor force participation rate are those with the educational attainment of college / associate degree, with 97.6% or 923 individuals in the labor force. Within the labor force, individuals with college / associate degree education have the highest percentage of unemployment, with 7.7% or 71 of them being unemployed.
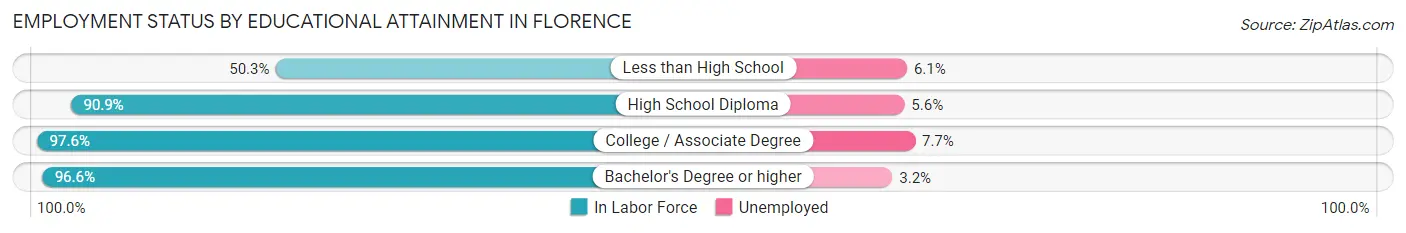
| Educational Attainment | In Labor Force | Unemployed |
| Less than High School | 181 (50.3%) | 22 (6.1%) |
| High School Diploma | 717 (90.9%) | 44 (5.6%) |
| College / Associate Degree | 923 (97.6%) | 73 (7.7%) |
| Bachelor's Degree or higher | 602 (96.6%) | 20 (3.2%) |
| Total | 2,422 (89.1%) | 158 (5.8%) |
Employment Occupations by Sex in Florence
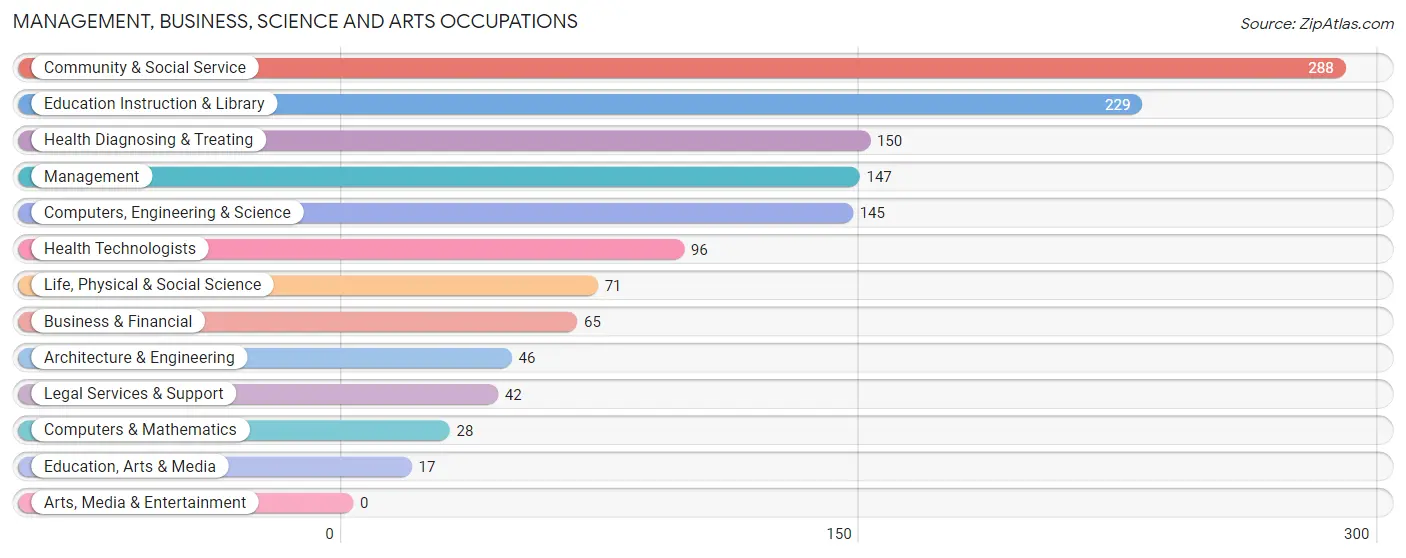
Management, Business, Science and Arts Occupations
The most common Management, Business, Science and Arts occupations in Florence are Community & Social Service (288 | 10.2%), Education Instruction & Library (229 | 8.1%), Health Diagnosing & Treating (150 | 5.3%), Management (147 | 5.2%), and Computers, Engineering & Science (145 | 5.1%).
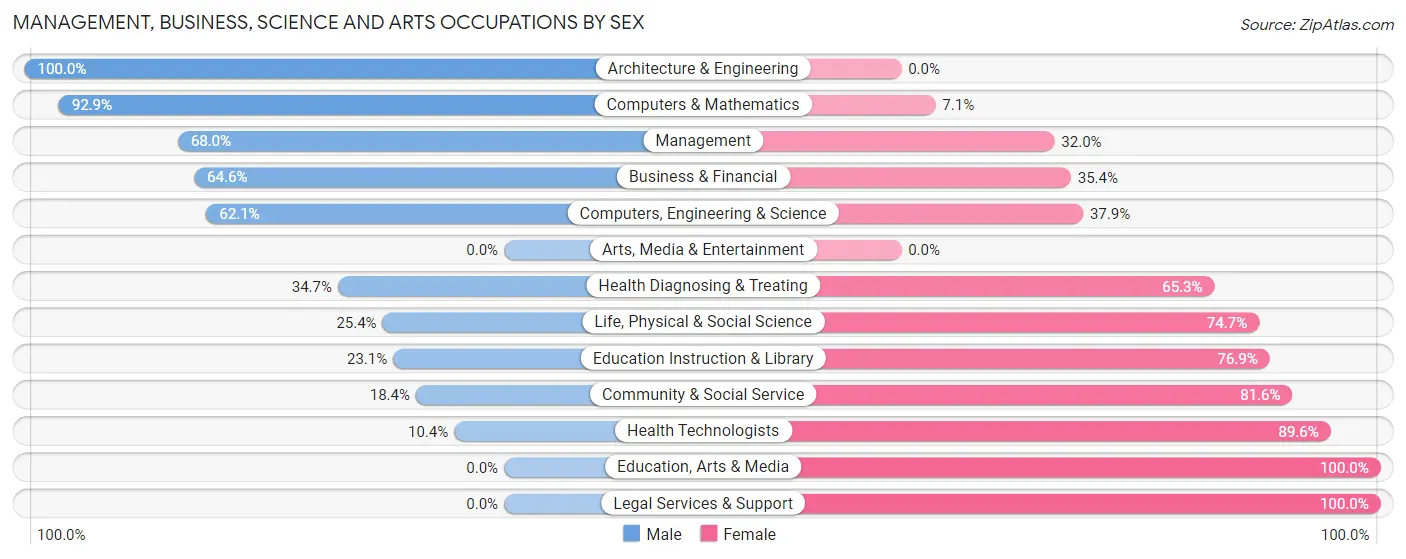
Management, Business, Science and Arts Occupations by Sex
Within the Management, Business, Science and Arts occupations in Florence, the most male-oriented occupations are Architecture & Engineering (100.0%), Computers & Mathematics (92.9%), and Management (68.0%), while the most female-oriented occupations are Education, Arts & Media (100.0%), Legal Services & Support (100.0%), and Health Technologists (89.6%).
| Occupation | Male | Female |
| Management | 100 (68.0%) | 47 (32.0%) |
| Business & Financial | 42 (64.6%) | 23 (35.4%) |
| Computers, Engineering & Science | 90 (62.1%) | 55 (37.9%) |
| Computers & Mathematics | 26 (92.9%) | 2 (7.1%) |
| Architecture & Engineering | 46 (100.0%) | 0 (0.0%) |
| Life, Physical & Social Science | 18 (25.4%) | 53 (74.7%) |
| Community & Social Service | 53 (18.4%) | 235 (81.6%) |
| Education, Arts & Media | 0 (0.0%) | 17 (100.0%) |
| Legal Services & Support | 0 (0.0%) | 42 (100.0%) |
| Education Instruction & Library | 53 (23.1%) | 176 (76.9%) |
| Arts, Media & Entertainment | 0 (0.0%) | 0 (0.0%) |
| Health Diagnosing & Treating | 52 (34.7%) | 98 (65.3%) |
| Health Technologists | 10 (10.4%) | 86 (89.6%) |
| Total (Category) | 337 (42.4%) | 458 (57.6%) |
| Total (Overall) | 1,393 (49.2%) | 1,439 (50.8%) |
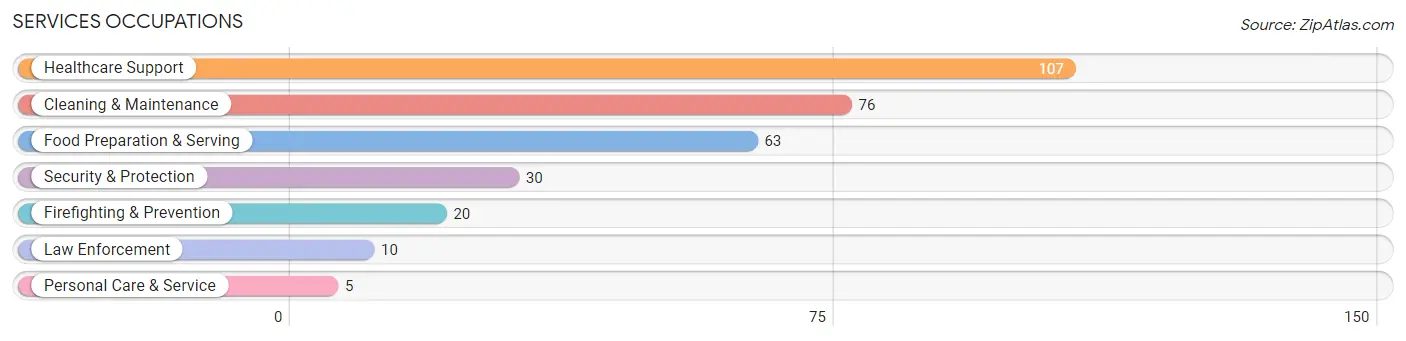
Services Occupations
The most common Services occupations in Florence are Healthcare Support (107 | 3.8%), Cleaning & Maintenance (76 | 2.7%), Food Preparation & Serving (63 | 2.2%), Security & Protection (30 | 1.1%), and Firefighting & Prevention (20 | 0.7%).
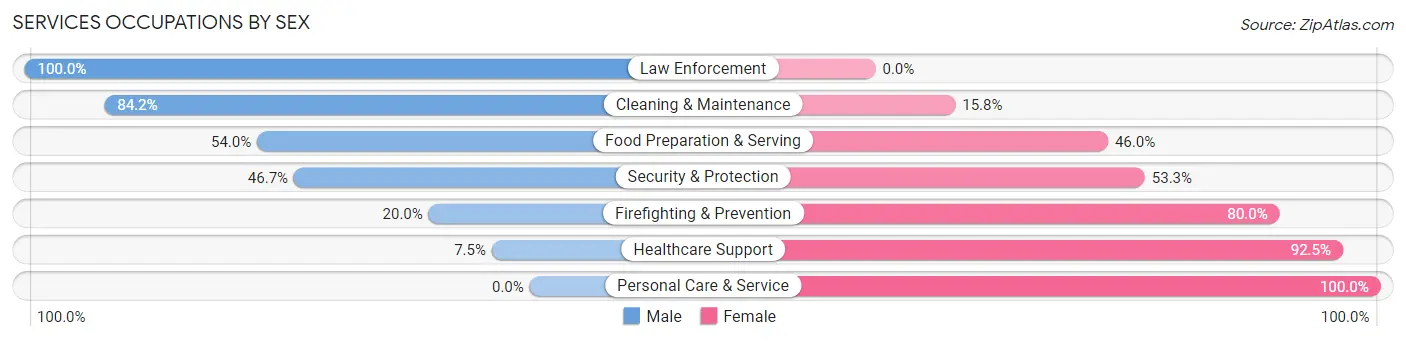
Services Occupations by Sex
Within the Services occupations in Florence, the most male-oriented occupations are Law Enforcement (100.0%), Cleaning & Maintenance (84.2%), and Food Preparation & Serving (54.0%), while the most female-oriented occupations are Personal Care & Service (100.0%), Healthcare Support (92.5%), and Firefighting & Prevention (80.0%).
| Occupation | Male | Female |
| Healthcare Support | 8 (7.5%) | 99 (92.5%) |
| Security & Protection | 14 (46.7%) | 16 (53.3%) |
| Firefighting & Prevention | 4 (20.0%) | 16 (80.0%) |
| Law Enforcement | 10 (100.0%) | 0 (0.0%) |
| Food Preparation & Serving | 34 (54.0%) | 29 (46.0%) |
| Cleaning & Maintenance | 64 (84.2%) | 12 (15.8%) |
| Personal Care & Service | 0 (0.0%) | 5 (100.0%) |
| Total (Category) | 120 (42.7%) | 161 (57.3%) |
| Total (Overall) | 1,393 (49.2%) | 1,439 (50.8%) |
Sales and Office Occupations
The most common Sales and Office occupations in Florence are Office & Administration (560 | 19.8%), and Sales & Related (221 | 7.8%).
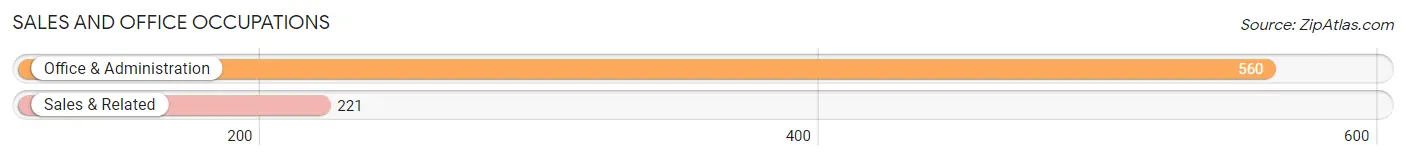
Sales and Office Occupations by Sex
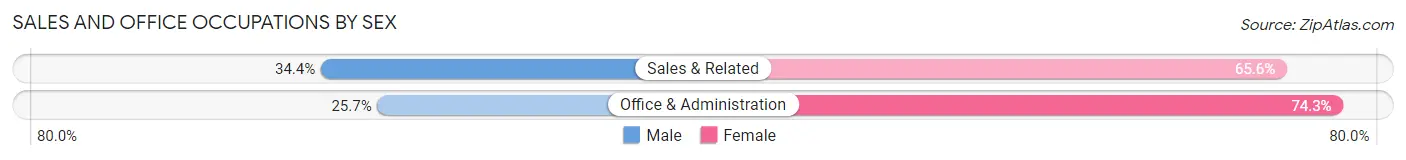
| Occupation | Male | Female |
| Sales & Related | 76 (34.4%) | 145 (65.6%) |
| Office & Administration | 144 (25.7%) | 416 (74.3%) |
| Total (Category) | 220 (28.2%) | 561 (71.8%) |
| Total (Overall) | 1,393 (49.2%) | 1,439 (50.8%) |
Natural Resources, Construction and Maintenance Occupations
The most common Natural Resources, Construction and Maintenance occupations in Florence are Installation, Maintenance & Repair (167 | 5.9%), and Construction & Extraction (164 | 5.8%).
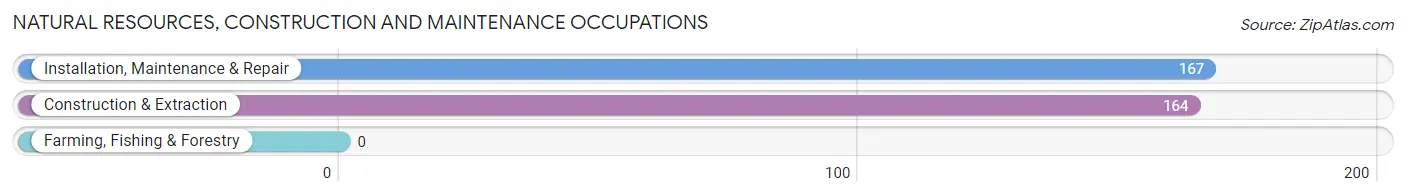
Natural Resources, Construction and Maintenance Occupations by Sex
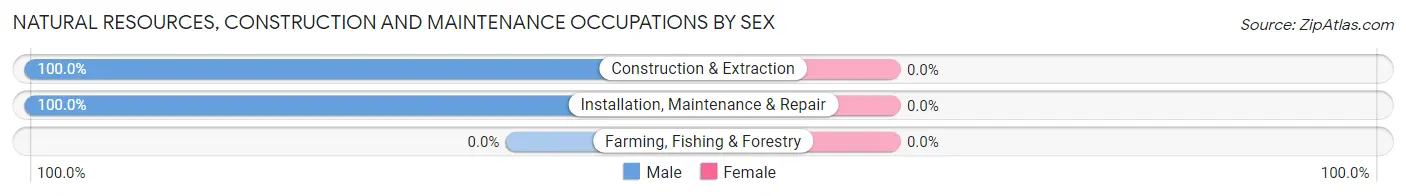
| Occupation | Male | Female |
| Farming, Fishing & Forestry | 0 (0.0%) | 0 (0.0%) |
| Construction & Extraction | 164 (100.0%) | 0 (0.0%) |
| Installation, Maintenance & Repair | 167 (100.0%) | 0 (0.0%) |
| Total (Category) | 331 (100.0%) | 0 (0.0%) |
| Total (Overall) | 1,393 (49.2%) | 1,439 (50.8%) |
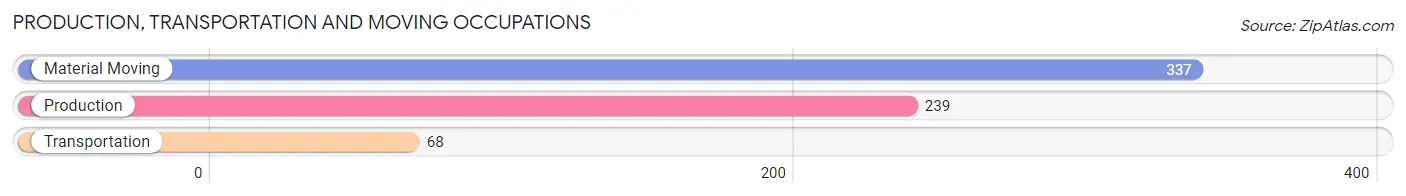
Production, Transportation and Moving Occupations
The most common Production, Transportation and Moving occupations in Florence are Material Moving (337 | 11.9%), Production (239 | 8.4%), and Transportation (68 | 2.4%).
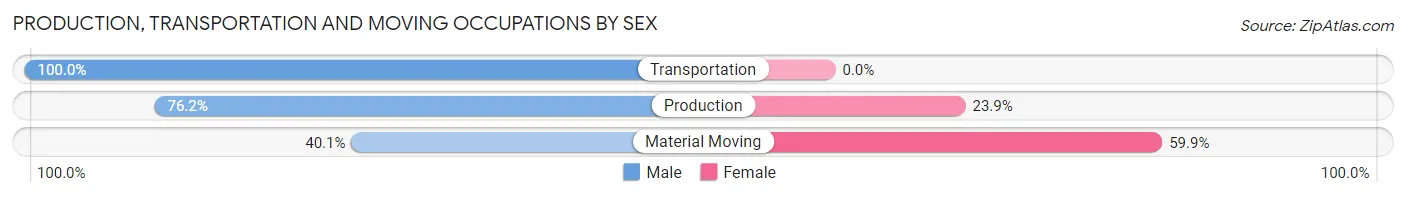
Production, Transportation and Moving Occupations by Sex
| Occupation | Male | Female |
| Production | 182 (76.1%) | 57 (23.8%) |
| Transportation | 68 (100.0%) | 0 (0.0%) |
| Material Moving | 135 (40.1%) | 202 (59.9%) |
| Total (Category) | 385 (59.8%) | 259 (40.2%) |
| Total (Overall) | 1,393 (49.2%) | 1,439 (50.8%) |
Employment Industries by Sex in Florence
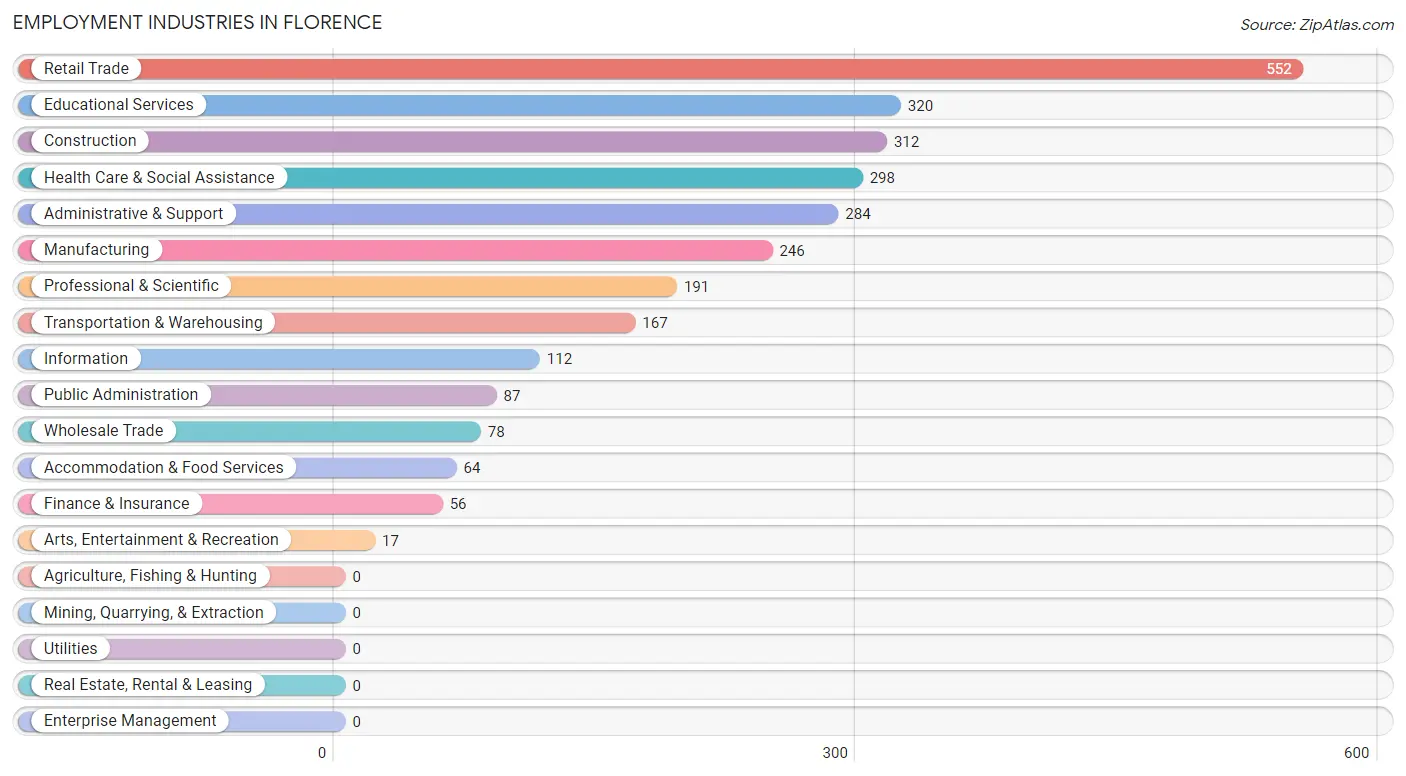
Employment Industries in Florence
The major employment industries in Florence include Retail Trade (552 | 19.5%), Educational Services (320 | 11.3%), Construction (312 | 11.0%), Health Care & Social Assistance (298 | 10.5%), and Administrative & Support (284 | 10.0%).
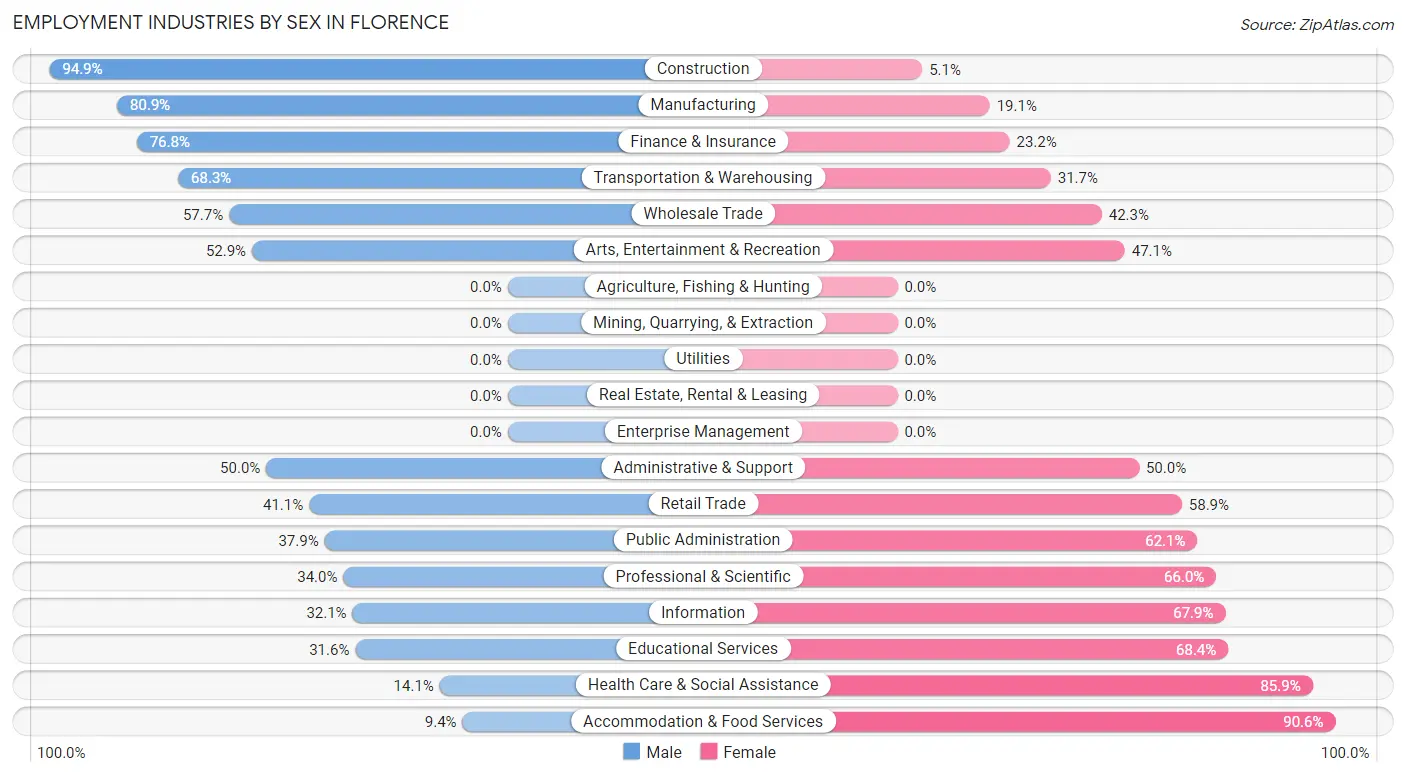
Employment Industries by Sex in Florence
The Florence industries that see more men than women are Construction (94.9%), Manufacturing (80.9%), and Finance & Insurance (76.8%), whereas the industries that tend to have a higher number of women are Accommodation & Food Services (90.6%), Health Care & Social Assistance (85.9%), and Educational Services (68.4%).
| Industry | Male | Female |
| Agriculture, Fishing & Hunting | 0 (0.0%) | 0 (0.0%) |
| Mining, Quarrying, & Extraction | 0 (0.0%) | 0 (0.0%) |
| Construction | 296 (94.9%) | 16 (5.1%) |
| Manufacturing | 199 (80.9%) | 47 (19.1%) |
| Wholesale Trade | 45 (57.7%) | 33 (42.3%) |
| Retail Trade | 227 (41.1%) | 325 (58.9%) |
| Transportation & Warehousing | 114 (68.3%) | 53 (31.7%) |
| Utilities | 0 (0.0%) | 0 (0.0%) |
| Information | 36 (32.1%) | 76 (67.9%) |
| Finance & Insurance | 43 (76.8%) | 13 (23.2%) |
| Real Estate, Rental & Leasing | 0 (0.0%) | 0 (0.0%) |
| Professional & Scientific | 65 (34.0%) | 126 (66.0%) |
| Enterprise Management | 0 (0.0%) | 0 (0.0%) |
| Administrative & Support | 142 (50.0%) | 142 (50.0%) |
| Educational Services | 101 (31.6%) | 219 (68.4%) |
| Health Care & Social Assistance | 42 (14.1%) | 256 (85.9%) |
| Arts, Entertainment & Recreation | 9 (52.9%) | 8 (47.1%) |
| Accommodation & Food Services | 6 (9.4%) | 58 (90.6%) |
| Public Administration | 33 (37.9%) | 54 (62.1%) |
| Total | 1,393 (49.2%) | 1,439 (50.8%) |
Education in Florence
School Enrollment in Florence
The most common levels of schooling among the 1,179 students in Florence are middle school (325 | 27.6%), elementary school (293 | 24.8%), and high school (291 | 24.7%).
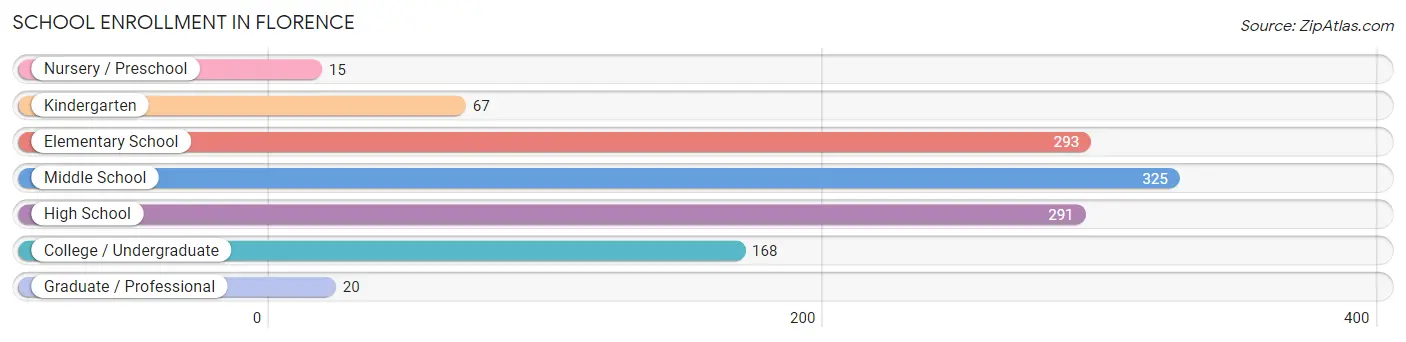
| School Level | # Students | % Students |
| Nursery / Preschool | 15 | 1.3% |
| Kindergarten | 67 | 5.7% |
| Elementary School | 293 | 24.8% |
| Middle School | 325 | 27.6% |
| High School | 291 | 24.7% |
| College / Undergraduate | 168 | 14.2% |
| Graduate / Professional | 20 | 1.7% |
| Total | 1,179 | 100.0% |
School Enrollment by Age by Funding Source in Florence
Out of a total of 1,179 students who are enrolled in schools in Florence, 190 (16.1%) attend a private institution, while the remaining 989 (83.9%) are enrolled in public schools. The age group of 3 to 4 year olds has the highest likelihood of being enrolled in private schools, with 8 (53.3% in the age bracket) enrolled. Conversely, the age group of 5 to 9 year old has the lowest likelihood of being enrolled in a private school, with 336 (100.0% in the age bracket) attending a public institution.
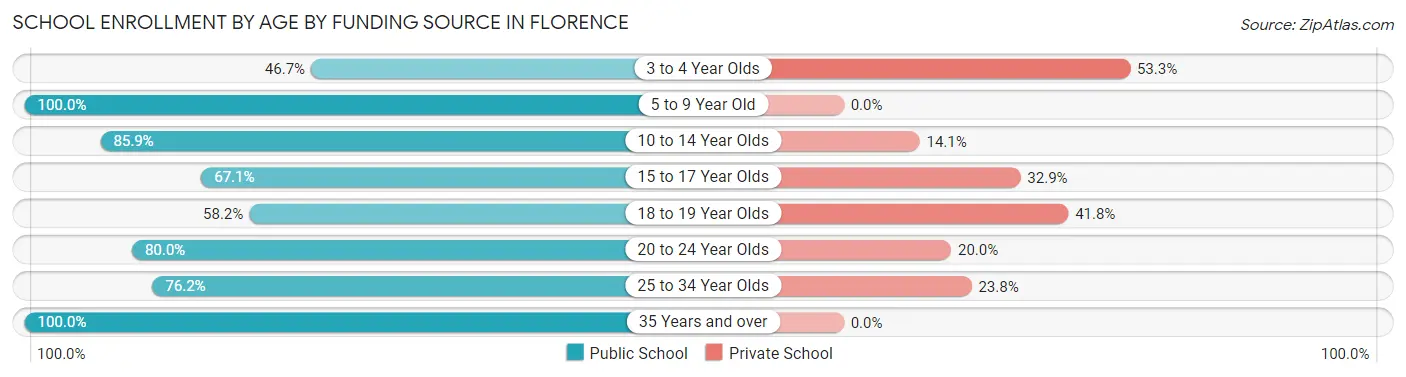
| Age Bracket | Public School | Private School |
| 3 to 4 Year Olds | 7 (46.7%) | 8 (53.3%) |
| 5 to 9 Year Old | 336 (100.0%) | 0 (0.0%) |
| 10 to 14 Year Olds | 322 (85.9%) | 53 (14.1%) |
| 15 to 17 Year Olds | 161 (67.1%) | 79 (32.9%) |
| 18 to 19 Year Olds | 32 (58.2%) | 23 (41.8%) |
| 20 to 24 Year Olds | 68 (80.0%) | 17 (20.0%) |
| 25 to 34 Year Olds | 32 (76.2%) | 10 (23.8%) |
| 35 Years and over | 31 (100.0%) | 0 (0.0%) |
| Total | 989 (83.9%) | 190 (16.1%) |
Educational Attainment by Field of Study in Florence
Business (277 | 31.1%), education (115 | 12.9%), social sciences (94 | 10.5%), bio, nature & agricultural (89 | 10.0%), and science & technology (85 | 9.5%) are the most common fields of study among 891 individuals in Florence who have obtained a bachelor's degree or higher.
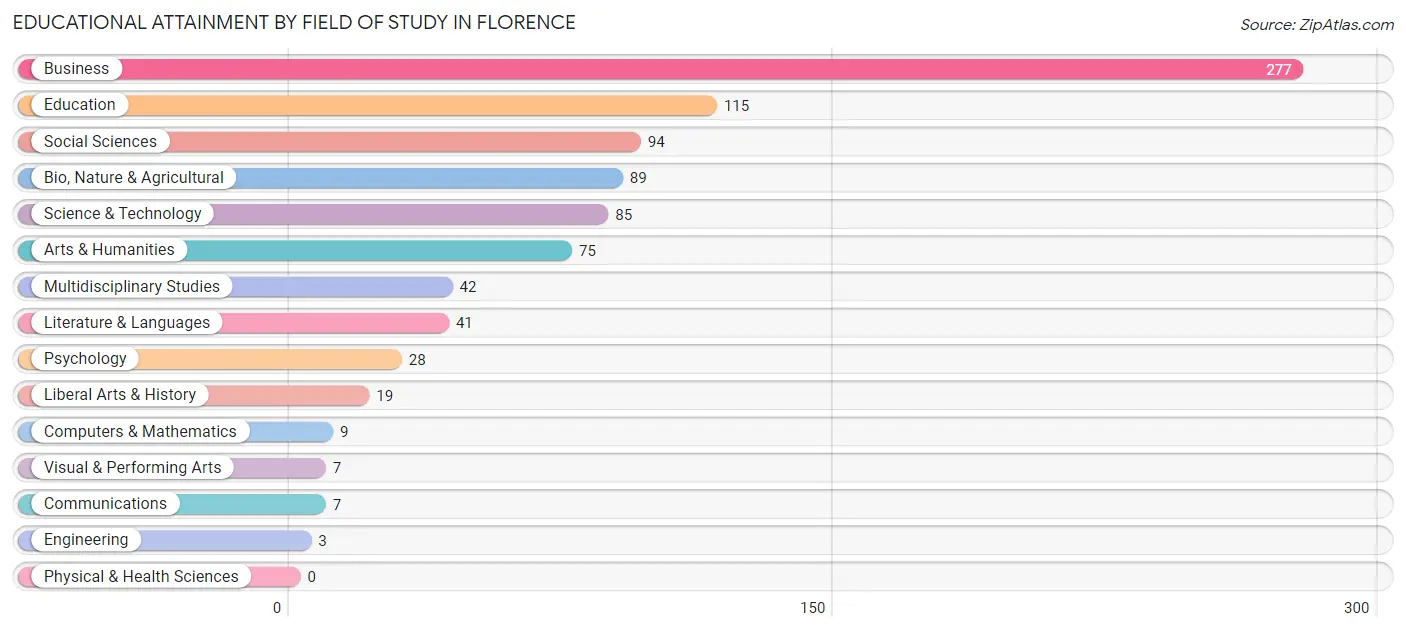
| Field of Study | # Graduates | % Graduates |
| Computers & Mathematics | 9 | 1.0% |
| Bio, Nature & Agricultural | 89 | 10.0% |
| Physical & Health Sciences | 0 | 0.0% |
| Psychology | 28 | 3.1% |
| Social Sciences | 94 | 10.5% |
| Engineering | 3 | 0.3% |
| Multidisciplinary Studies | 42 | 4.7% |
| Science & Technology | 85 | 9.5% |
| Business | 277 | 31.1% |
| Education | 115 | 12.9% |
| Literature & Languages | 41 | 4.6% |
| Liberal Arts & History | 19 | 2.1% |
| Visual & Performing Arts | 7 | 0.8% |
| Communications | 7 | 0.8% |
| Arts & Humanities | 75 | 8.4% |
| Total | 891 | 100.0% |
Transportation & Commute in Florence
Vehicle Availability by Sex in Florence
The most prevalent vehicle ownership categories in Florence are males with 2 vehicles (639, accounting for 46.3%) and females with 2 vehicles (616, making up 50.2%).
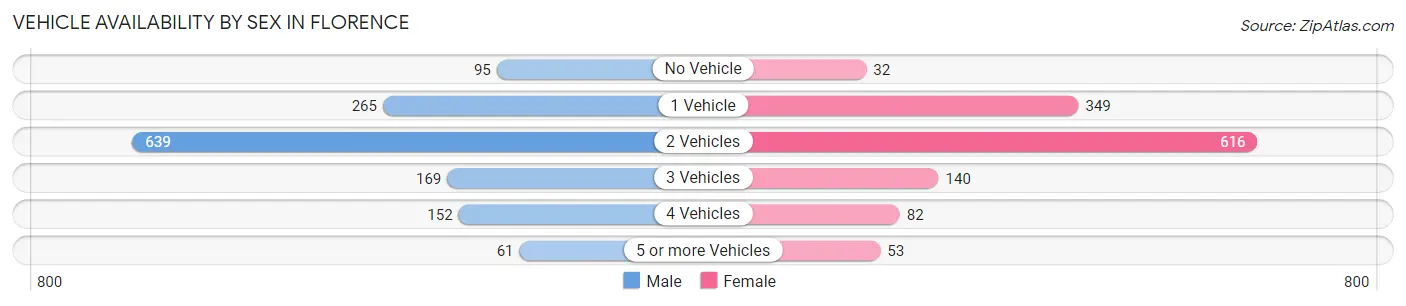
| Vehicles Available | Male | Female |
| No Vehicle | 95 (6.9%) | 32 (2.5%) |
| 1 Vehicle | 265 (19.2%) | 349 (27.4%) |
| 2 Vehicles | 639 (46.3%) | 616 (48.4%) |
| 3 Vehicles | 169 (12.2%) | 140 (11.0%) |
| 4 Vehicles | 152 (11.0%) | 82 (6.5%) |
| 5 or more Vehicles | 61 (4.4%) | 53 (4.2%) |
| Total | 1,381 (100.0%) | 1,272 (100.0%) |
Commute Time in Florence
The most frequently occuring commute durations in Florence are 15 to 19 minutes (463 commuters, 18.1%), 30 to 34 minutes (305 commuters, 11.9%), and 10 to 14 minutes (296 commuters, 11.6%).
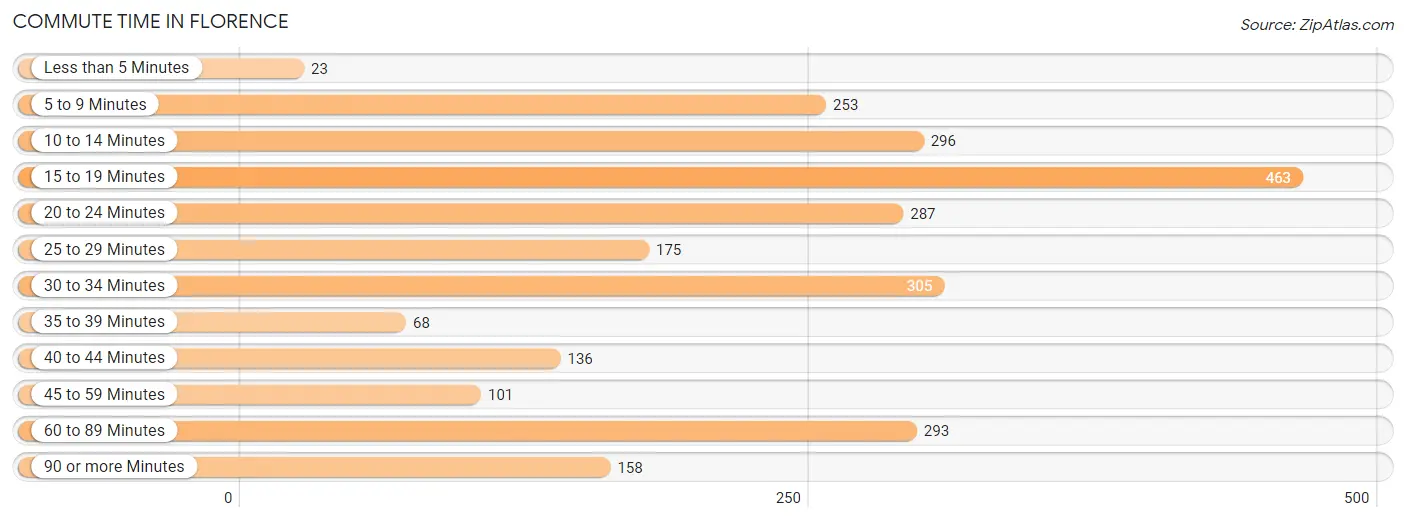
| Commute Time | # Commuters | % Commuters |
| Less than 5 Minutes | 23 | 0.9% |
| 5 to 9 Minutes | 253 | 9.9% |
| 10 to 14 Minutes | 296 | 11.6% |
| 15 to 19 Minutes | 463 | 18.1% |
| 20 to 24 Minutes | 287 | 11.2% |
| 25 to 29 Minutes | 175 | 6.8% |
| 30 to 34 Minutes | 305 | 11.9% |
| 35 to 39 Minutes | 68 | 2.7% |
| 40 to 44 Minutes | 136 | 5.3% |
| 45 to 59 Minutes | 101 | 4.0% |
| 60 to 89 Minutes | 293 | 11.5% |
| 90 or more Minutes | 158 | 6.2% |
Commute Time by Sex in Florence
The most common commute times in Florence are 60 to 89 minutes (203 commuters, 15.5%) for males and 15 to 19 minutes (328 commuters, 26.3%) for females.
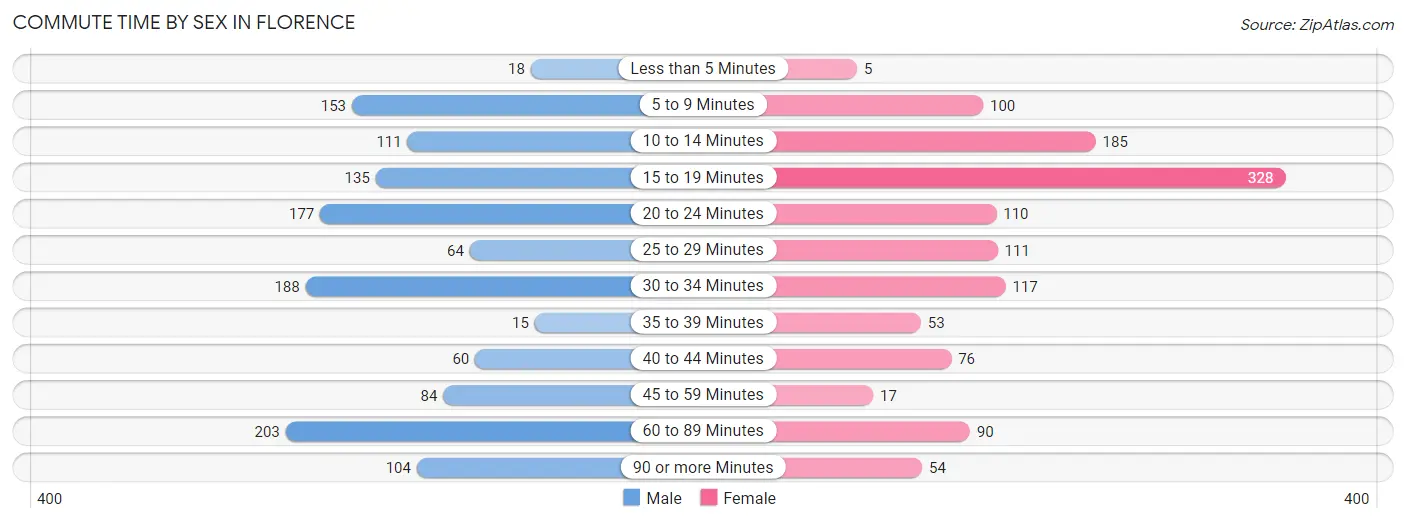
| Commute Time | Male | Female |
| Less than 5 Minutes | 18 (1.4%) | 5 (0.4%) |
| 5 to 9 Minutes | 153 (11.7%) | 100 (8.0%) |
| 10 to 14 Minutes | 111 (8.5%) | 185 (14.8%) |
| 15 to 19 Minutes | 135 (10.3%) | 328 (26.3%) |
| 20 to 24 Minutes | 177 (13.5%) | 110 (8.8%) |
| 25 to 29 Minutes | 64 (4.9%) | 111 (8.9%) |
| 30 to 34 Minutes | 188 (14.3%) | 117 (9.4%) |
| 35 to 39 Minutes | 15 (1.1%) | 53 (4.3%) |
| 40 to 44 Minutes | 60 (4.6%) | 76 (6.1%) |
| 45 to 59 Minutes | 84 (6.4%) | 17 (1.4%) |
| 60 to 89 Minutes | 203 (15.5%) | 90 (7.2%) |
| 90 or more Minutes | 104 (7.9%) | 54 (4.3%) |
Time of Departure to Work by Sex in Florence
The most frequent times of departure to work in Florence are 7:30 AM to 7:59 AM (232, 17.7%) for males and 7:30 AM to 7:59 AM (354, 28.4%) for females.
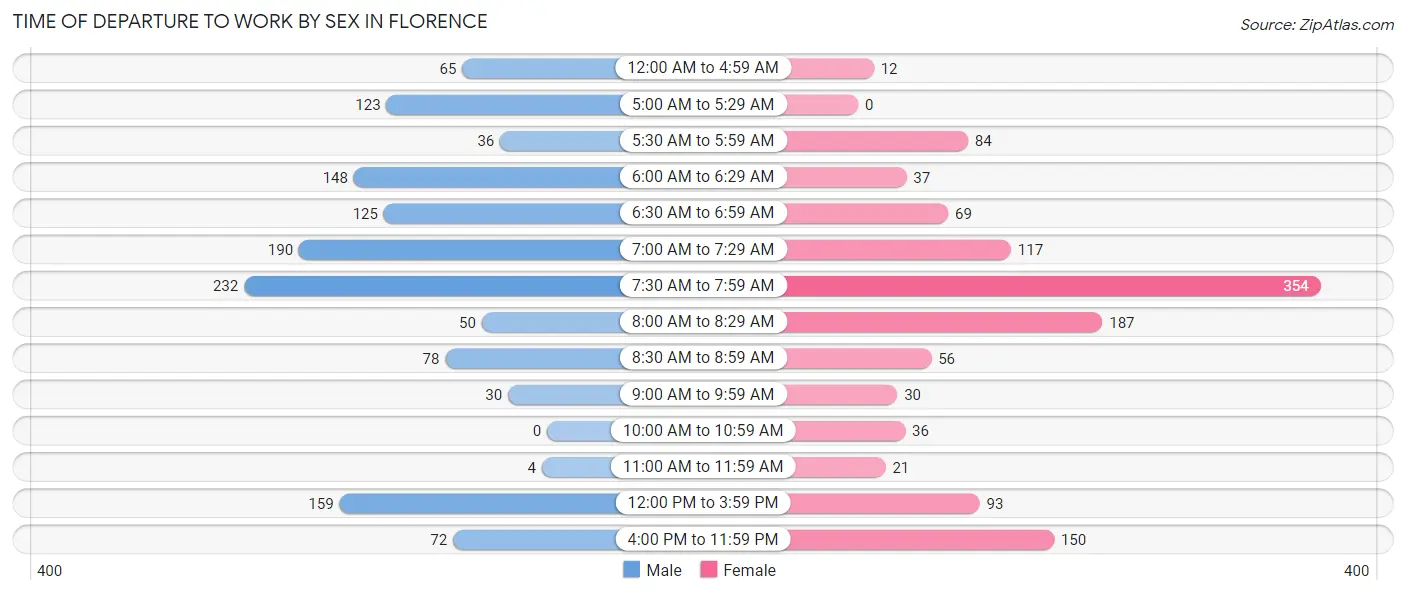
| Time of Departure | Male | Female |
| 12:00 AM to 4:59 AM | 65 (5.0%) | 12 (1.0%) |
| 5:00 AM to 5:29 AM | 123 (9.4%) | 0 (0.0%) |
| 5:30 AM to 5:59 AM | 36 (2.7%) | 84 (6.7%) |
| 6:00 AM to 6:29 AM | 148 (11.3%) | 37 (3.0%) |
| 6:30 AM to 6:59 AM | 125 (9.5%) | 69 (5.5%) |
| 7:00 AM to 7:29 AM | 190 (14.5%) | 117 (9.4%) |
| 7:30 AM to 7:59 AM | 232 (17.7%) | 354 (28.4%) |
| 8:00 AM to 8:29 AM | 50 (3.8%) | 187 (15.0%) |
| 8:30 AM to 8:59 AM | 78 (5.9%) | 56 (4.5%) |
| 9:00 AM to 9:59 AM | 30 (2.3%) | 30 (2.4%) |
| 10:00 AM to 10:59 AM | 0 (0.0%) | 36 (2.9%) |
| 11:00 AM to 11:59 AM | 4 (0.3%) | 21 (1.7%) |
| 12:00 PM to 3:59 PM | 159 (12.1%) | 93 (7.5%) |
| 4:00 PM to 11:59 PM | 72 (5.5%) | 150 (12.0%) |
| Total | 1,312 (100.0%) | 1,246 (100.0%) |
Housing Occupancy in Florence
Occupancy by Ownership in Florence
Of the total 1,758 dwellings in Florence, owner-occupied units account for 1,107 (63.0%), while renter-occupied units make up 651 (37.0%).
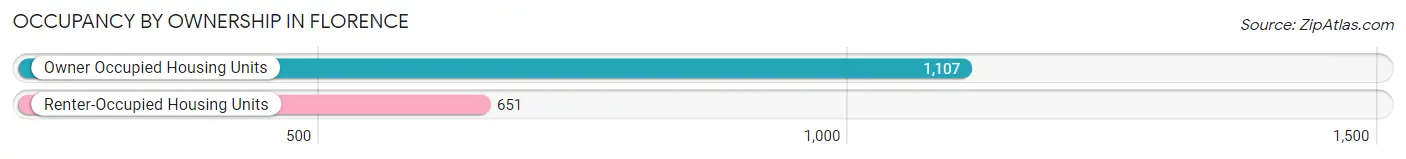
| Occupancy | # Housing Units | % Housing Units |
| Owner Occupied Housing Units | 1,107 | 63.0% |
| Renter-Occupied Housing Units | 651 | 37.0% |
| Total Occupied Housing Units | 1,758 | 100.0% |
Occupancy by Household Size in Florence
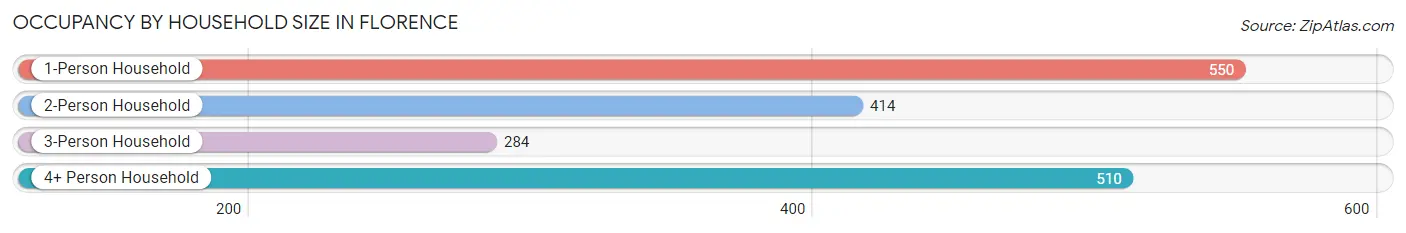
| Household Size | # Housing Units | % Housing Units |
| 1-Person Household | 550 | 31.3% |
| 2-Person Household | 414 | 23.5% |
| 3-Person Household | 284 | 16.2% |
| 4+ Person Household | 510 | 29.0% |
| Total Housing Units | 1,758 | 100.0% |
Occupancy by Ownership by Household Size in Florence
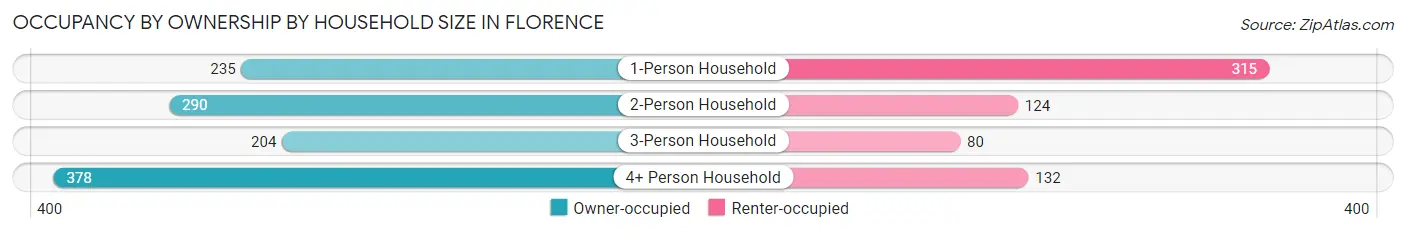
| Household Size | Owner-occupied | Renter-occupied |
| 1-Person Household | 235 (42.7%) | 315 (57.3%) |
| 2-Person Household | 290 (70.1%) | 124 (29.9%) |
| 3-Person Household | 204 (71.8%) | 80 (28.2%) |
| 4+ Person Household | 378 (74.1%) | 132 (25.9%) |
| Total Housing Units | 1,107 (63.0%) | 651 (37.0%) |
Occupancy by Educational Attainment in Florence
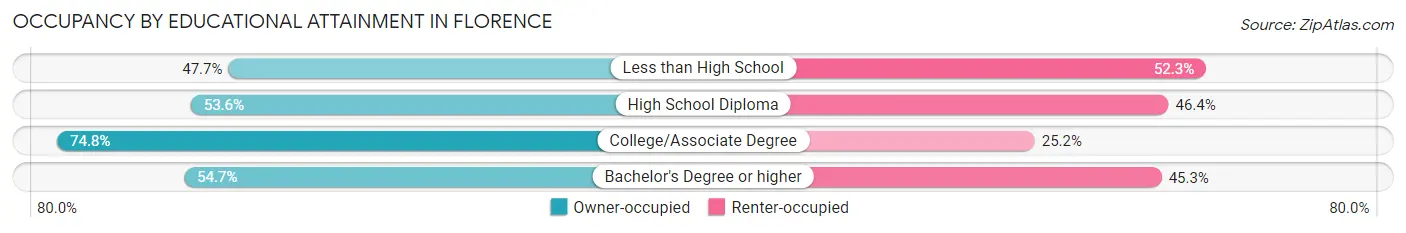
| Household Size | Owner-occupied | Renter-occupied |
| Less than High School | 62 (47.7%) | 68 (52.3%) |
| High School Diploma | 244 (53.6%) | 211 (46.4%) |
| College/Associate Degree | 592 (74.8%) | 199 (25.2%) |
| Bachelor's Degree or higher | 209 (54.7%) | 173 (45.3%) |
Occupancy by Age of Householder in Florence
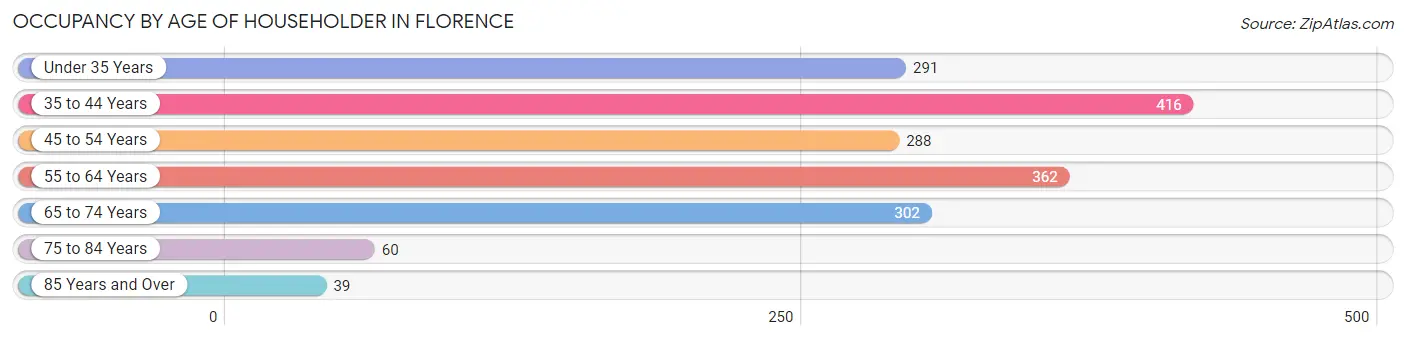
| Age Bracket | # Households | % Households |
| Under 35 Years | 291 | 16.6% |
| 35 to 44 Years | 416 | 23.7% |
| 45 to 54 Years | 288 | 16.4% |
| 55 to 64 Years | 362 | 20.6% |
| 65 to 74 Years | 302 | 17.2% |
| 75 to 84 Years | 60 | 3.4% |
| 85 Years and Over | 39 | 2.2% |
| Total | 1,758 | 100.0% |
Housing Finances in Florence
Median Income by Occupancy in Florence
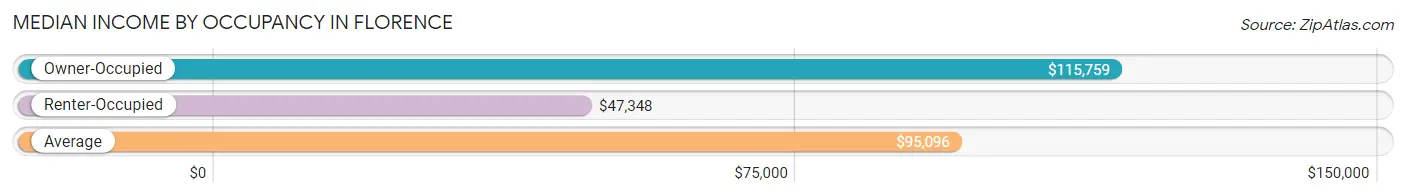
| Occupancy Type | # Households | Median Income |
| Owner-Occupied | 1,107 (63.0%) | $115,759 |
| Renter-Occupied | 651 (37.0%) | $47,348 |
| Average | 1,758 (100.0%) | $95,096 |
Occupancy by Householder Income Bracket in Florence
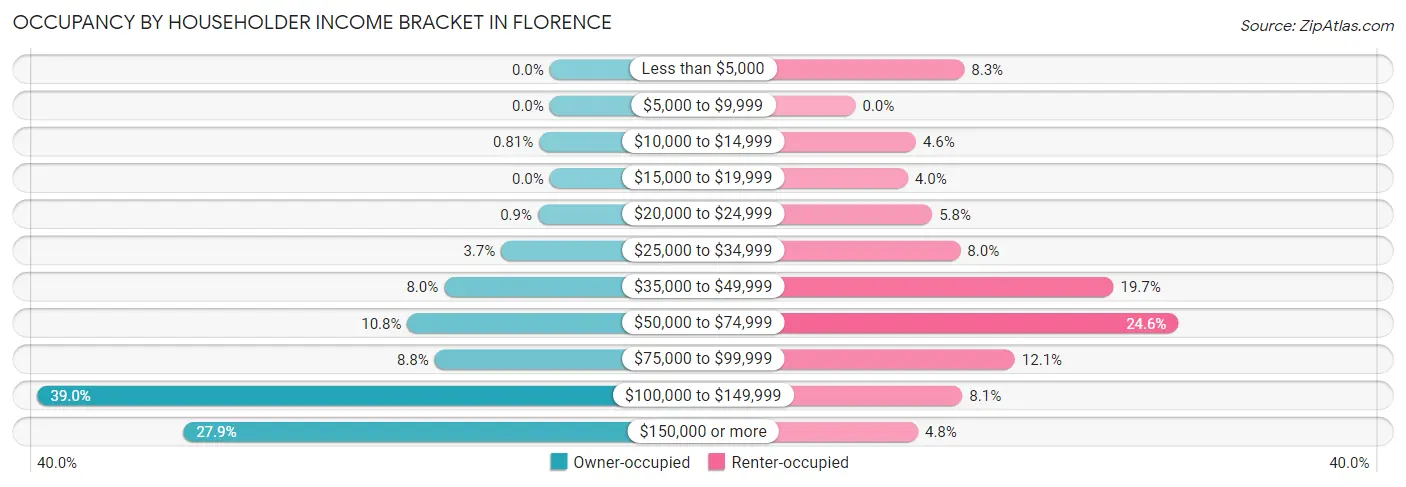
| Income Bracket | Owner-occupied | Renter-occupied |
| Less than $5,000 | 0 (0.0%) | 54 (8.3%) |
| $5,000 to $9,999 | 0 (0.0%) | 0 (0.0%) |
| $10,000 to $14,999 | 9 (0.8%) | 30 (4.6%) |
| $15,000 to $19,999 | 0 (0.0%) | 26 (4.0%) |
| $20,000 to $24,999 | 10 (0.9%) | 38 (5.8%) |
| $25,000 to $34,999 | 41 (3.7%) | 52 (8.0%) |
| $35,000 to $49,999 | 89 (8.0%) | 128 (19.7%) |
| $50,000 to $74,999 | 120 (10.8%) | 160 (24.6%) |
| $75,000 to $99,999 | 97 (8.8%) | 79 (12.1%) |
| $100,000 to $149,999 | 432 (39.0%) | 53 (8.1%) |
| $150,000 or more | 309 (27.9%) | 31 (4.8%) |
| Total | 1,107 (100.0%) | 651 (100.0%) |
Monthly Housing Cost Tiers in Florence
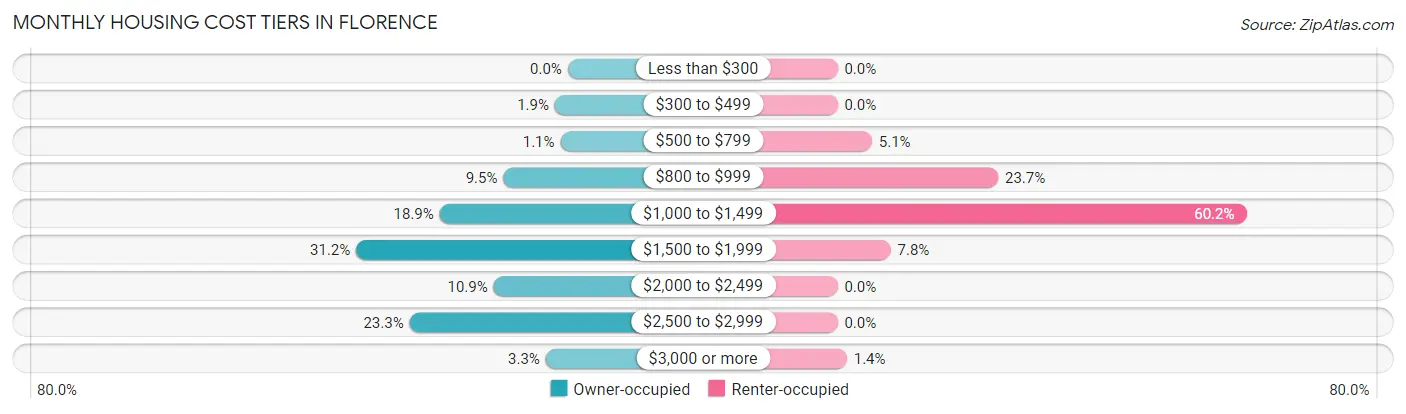
| Monthly Cost | Owner-occupied | Renter-occupied |
| Less than $300 | 0 (0.0%) | 0 (0.0%) |
| $300 to $499 | 21 (1.9%) | 0 (0.0%) |
| $500 to $799 | 12 (1.1%) | 33 (5.1%) |
| $800 to $999 | 105 (9.5%) | 154 (23.7%) |
| $1,000 to $1,499 | 209 (18.9%) | 392 (60.2%) |
| $1,500 to $1,999 | 345 (31.2%) | 51 (7.8%) |
| $2,000 to $2,499 | 121 (10.9%) | 0 (0.0%) |
| $2,500 to $2,999 | 258 (23.3%) | 0 (0.0%) |
| $3,000 or more | 36 (3.3%) | 9 (1.4%) |
| Total | 1,107 (100.0%) | 651 (100.0%) |
Physical Housing Characteristics in Florence
Housing Structures in Florence
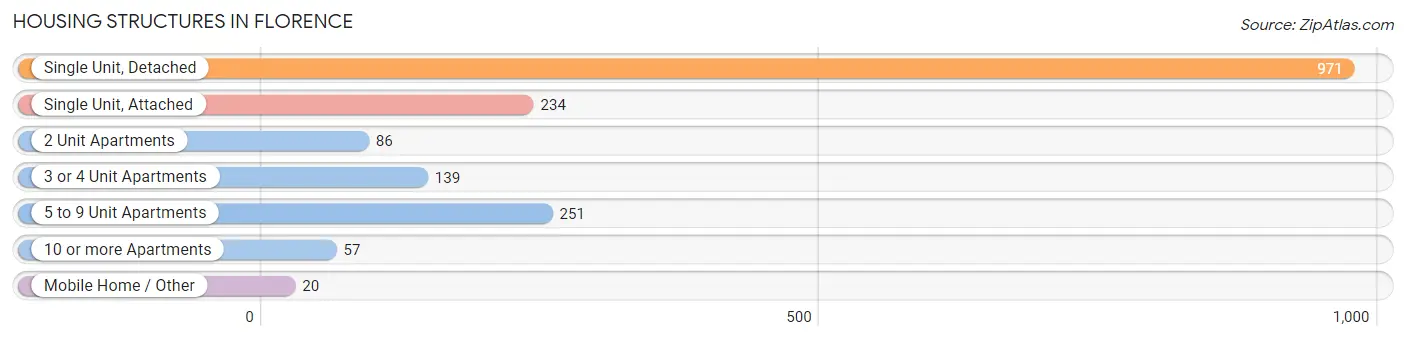
| Structure Type | # Housing Units | % Housing Units |
| Single Unit, Detached | 971 | 55.2% |
| Single Unit, Attached | 234 | 13.3% |
| 2 Unit Apartments | 86 | 4.9% |
| 3 or 4 Unit Apartments | 139 | 7.9% |
| 5 to 9 Unit Apartments | 251 | 14.3% |
| 10 or more Apartments | 57 | 3.2% |
| Mobile Home / Other | 20 | 1.1% |
| Total | 1,758 | 100.0% |
Housing Structures by Occupancy in Florence
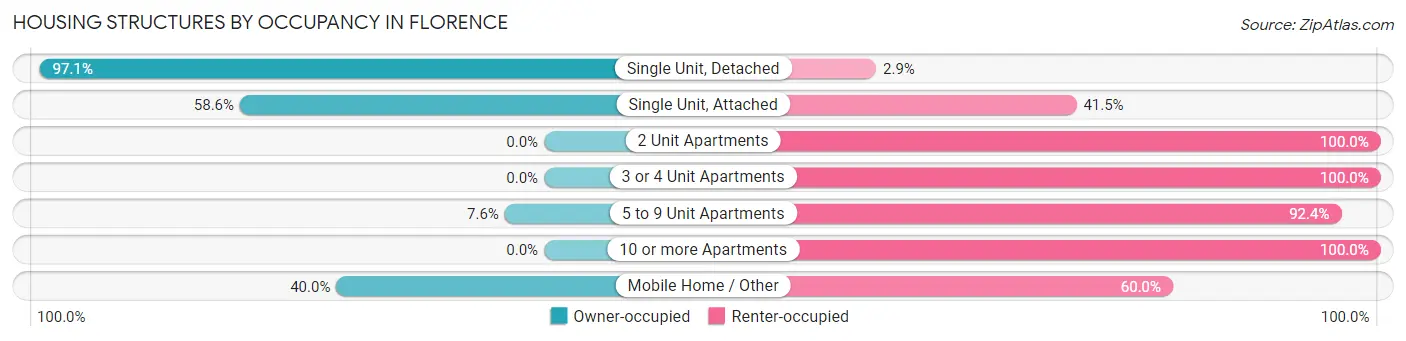
| Structure Type | Owner-occupied | Renter-occupied |
| Single Unit, Detached | 943 (97.1%) | 28 (2.9%) |
| Single Unit, Attached | 137 (58.6%) | 97 (41.4%) |
| 2 Unit Apartments | 0 (0.0%) | 86 (100.0%) |
| 3 or 4 Unit Apartments | 0 (0.0%) | 139 (100.0%) |
| 5 to 9 Unit Apartments | 19 (7.6%) | 232 (92.4%) |
| 10 or more Apartments | 0 (0.0%) | 57 (100.0%) |
| Mobile Home / Other | 8 (40.0%) | 12 (60.0%) |
| Total | 1,107 (63.0%) | 651 (37.0%) |
Housing Structures by Number of Rooms in Florence
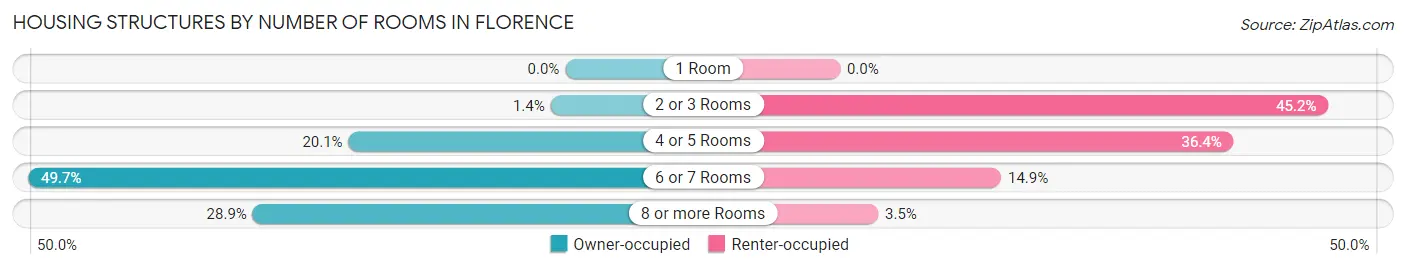
| Number of Rooms | Owner-occupied | Renter-occupied |
| 1 Room | 0 (0.0%) | 0 (0.0%) |
| 2 or 3 Rooms | 15 (1.4%) | 294 (45.2%) |
| 4 or 5 Rooms | 222 (20.1%) | 237 (36.4%) |
| 6 or 7 Rooms | 550 (49.7%) | 97 (14.9%) |
| 8 or more Rooms | 320 (28.9%) | 23 (3.5%) |
| Total | 1,107 (100.0%) | 651 (100.0%) |
Housing Structure by Heating Type in Florence
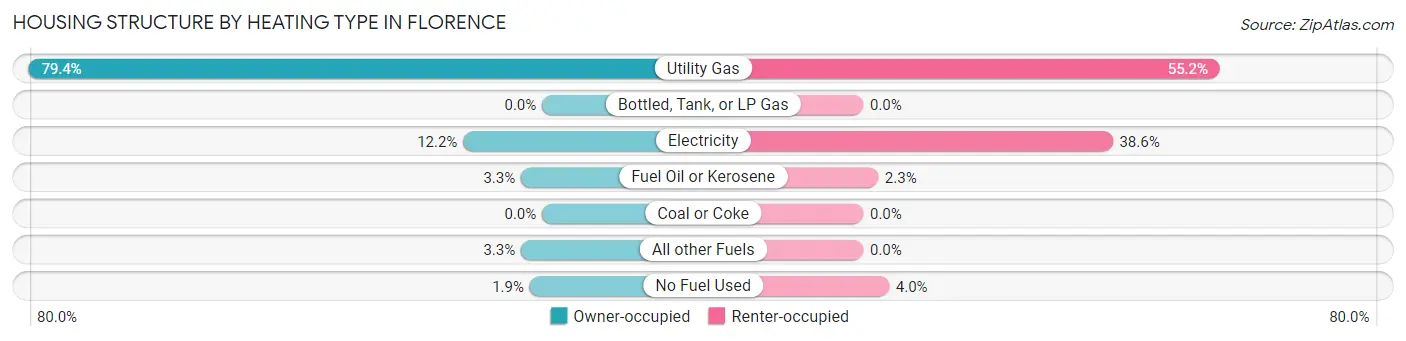
| Heating Type | Owner-occupied | Renter-occupied |
| Utility Gas | 879 (79.4%) | 359 (55.1%) |
| Bottled, Tank, or LP Gas | 0 (0.0%) | 0 (0.0%) |
| Electricity | 135 (12.2%) | 251 (38.6%) |
| Fuel Oil or Kerosene | 36 (3.3%) | 15 (2.3%) |
| Coal or Coke | 0 (0.0%) | 0 (0.0%) |
| All other Fuels | 36 (3.3%) | 0 (0.0%) |
| No Fuel Used | 21 (1.9%) | 26 (4.0%) |
| Total | 1,107 (100.0%) | 651 (100.0%) |
Household Vehicle Usage in Florence
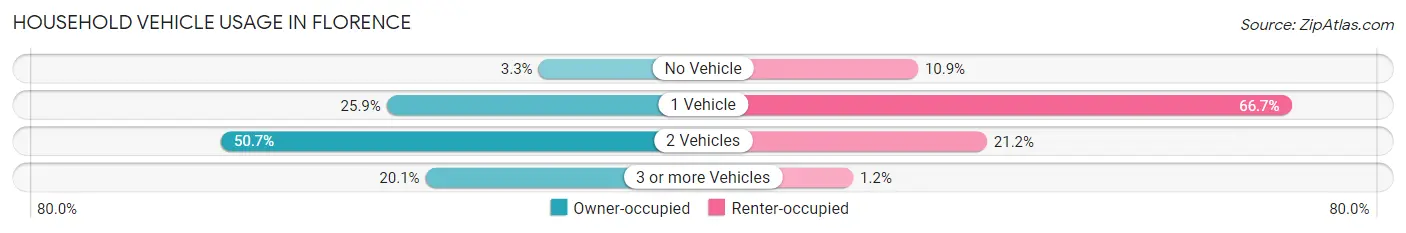
| Vehicles per Household | Owner-occupied | Renter-occupied |
| No Vehicle | 36 (3.3%) | 71 (10.9%) |
| 1 Vehicle | 287 (25.9%) | 434 (66.7%) |
| 2 Vehicles | 561 (50.7%) | 138 (21.2%) |
| 3 or more Vehicles | 223 (20.1%) | 8 (1.2%) |
| Total | 1,107 (100.0%) | 651 (100.0%) |
Real Estate & Mortgages in Florence
Real Estate and Mortgage Overview in Florence
| Characteristic | Without Mortgage | With Mortgage |
| Housing Units | 137 | 970 |
| Median Property Value | $285,600 | $239,200 |
| Median Household Income | $82,083 | $280 |
| Monthly Housing Costs | $885 | $27 |
| Real Estate Taxes | $6,025 | $6 |
Property Value by Mortgage Status in Florence
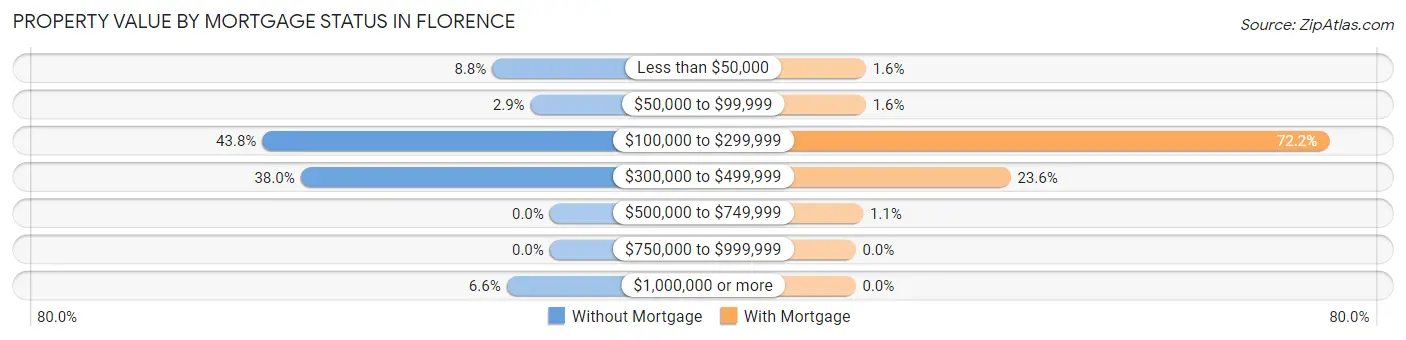
| Property Value | Without Mortgage | With Mortgage |
| Less than $50,000 | 12 (8.8%) | 15 (1.5%) |
| $50,000 to $99,999 | 4 (2.9%) | 15 (1.5%) |
| $100,000 to $299,999 | 60 (43.8%) | 700 (72.2%) |
| $300,000 to $499,999 | 52 (38.0%) | 229 (23.6%) |
| $500,000 to $749,999 | 0 (0.0%) | 11 (1.1%) |
| $750,000 to $999,999 | 0 (0.0%) | 0 (0.0%) |
| $1,000,000 or more | 9 (6.6%) | 0 (0.0%) |
| Total | 137 (100.0%) | 970 (100.0%) |
Household Income by Mortgage Status in Florence
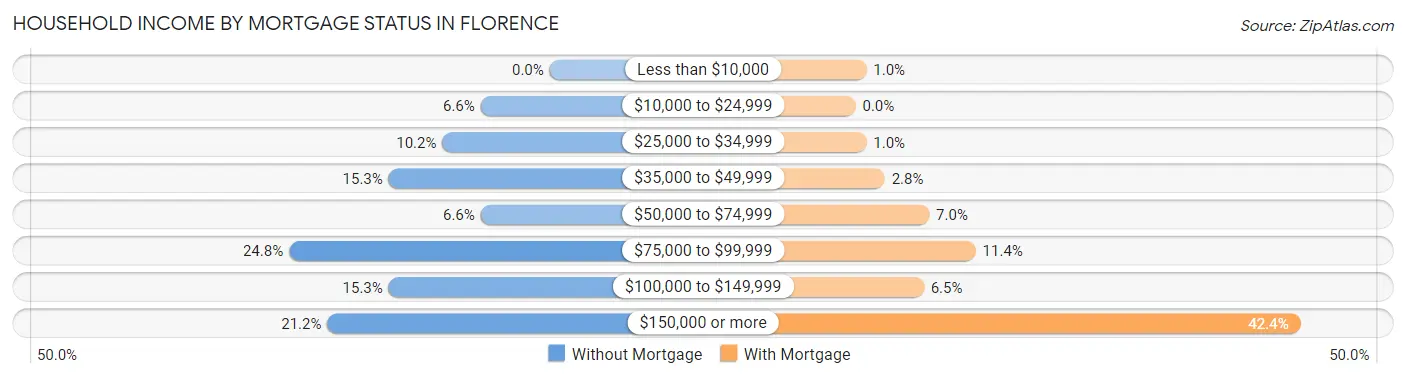
| Household Income | Without Mortgage | With Mortgage |
| Less than $10,000 | 0 (0.0%) | 10 (1.0%) |
| $10,000 to $24,999 | 9 (6.6%) | 0 (0.0%) |
| $25,000 to $34,999 | 14 (10.2%) | 10 (1.0%) |
| $35,000 to $49,999 | 21 (15.3%) | 27 (2.8%) |
| $50,000 to $74,999 | 9 (6.6%) | 68 (7.0%) |
| $75,000 to $99,999 | 34 (24.8%) | 111 (11.4%) |
| $100,000 to $149,999 | 21 (15.3%) | 63 (6.5%) |
| $150,000 or more | 29 (21.2%) | 411 (42.4%) |
| Total | 137 (100.0%) | 970 (100.0%) |
Property Value to Household Income Ratio in Florence
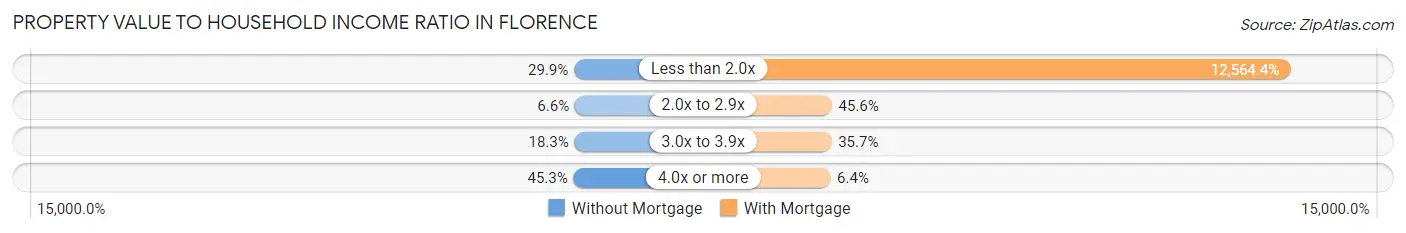
| Value-to-Income Ratio | Without Mortgage | With Mortgage |
| Less than 2.0x | 41 (29.9%) | 121,875 (12,564.4%) |
| 2.0x to 2.9x | 9 (6.6%) | 442 (45.6%) |
| 3.0x to 3.9x | 25 (18.2%) | 346 (35.7%) |
| 4.0x or more | 62 (45.3%) | 62 (6.4%) |
| Total | 137 (100.0%) | 970 (100.0%) |
Real Estate Taxes by Mortgage Status in Florence
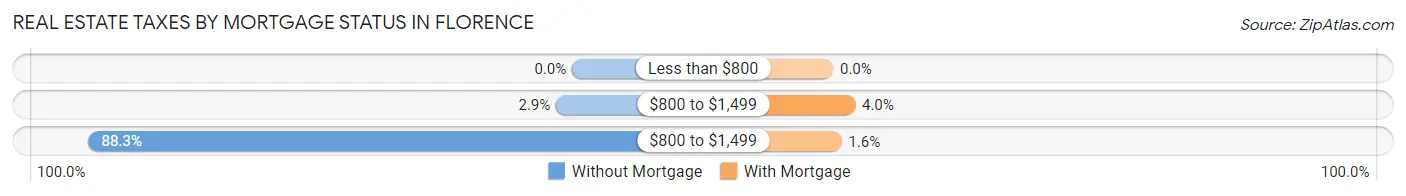
| Property Taxes | Without Mortgage | With Mortgage |
| Less than $800 | 0 (0.0%) | 0 (0.0%) |
| $800 to $1,499 | 4 (2.9%) | 39 (4.0%) |
| $800 to $1,499 | 121 (88.3%) | 15 (1.5%) |
| Total | 137 (100.0%) | 970 (100.0%) |
Health & Disability in Florence
Health Insurance Coverage by Age in Florence
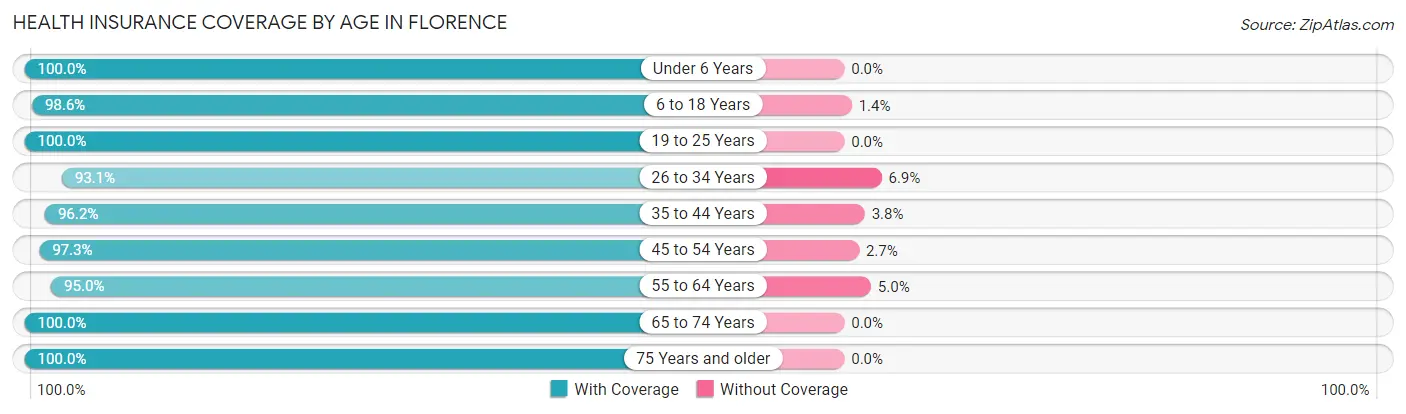
| Age Bracket | With Coverage | Without Coverage |
| Under 6 Years | 237 (100.0%) | 0 (0.0%) |
| 6 to 18 Years | 931 (98.6%) | 13 (1.4%) |
| 19 to 25 Years | 450 (100.0%) | 0 (0.0%) |
| 26 to 34 Years | 496 (93.1%) | 37 (6.9%) |
| 35 to 44 Years | 758 (96.2%) | 30 (3.8%) |
| 45 to 54 Years | 641 (97.3%) | 18 (2.7%) |
| 55 to 64 Years | 594 (95.0%) | 31 (5.0%) |
| 65 to 74 Years | 420 (100.0%) | 0 (0.0%) |
| 75 Years and older | 159 (100.0%) | 0 (0.0%) |
| Total | 4,686 (97.3%) | 129 (2.7%) |
Health Insurance Coverage by Citizenship Status in Florence
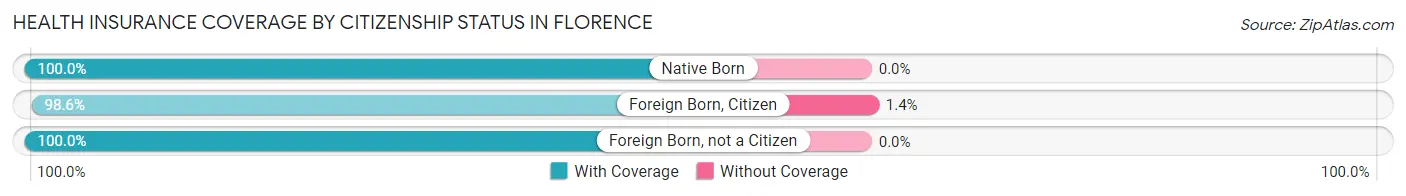
| Citizenship Status | With Coverage | Without Coverage |
| Native Born | 237 (100.0%) | 0 (0.0%) |
| Foreign Born, Citizen | 931 (98.6%) | 13 (1.4%) |
| Foreign Born, not a Citizen | 450 (100.0%) | 0 (0.0%) |
Health Insurance Coverage by Household Income in Florence
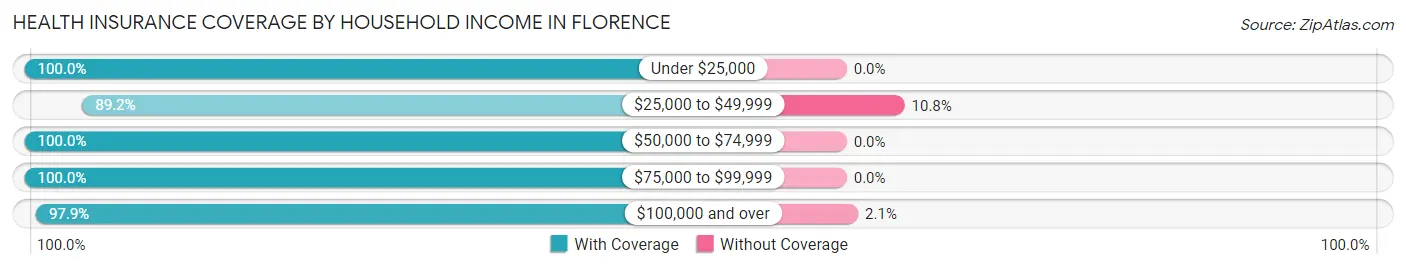
| Household Income | With Coverage | Without Coverage |
| Under $25,000 | 294 (100.0%) | 0 (0.0%) |
| $25,000 to $49,999 | 568 (89.2%) | 69 (10.8%) |
| $50,000 to $74,999 | 707 (100.0%) | 0 (0.0%) |
| $75,000 to $99,999 | 355 (100.0%) | 0 (0.0%) |
| $100,000 and over | 2,762 (97.9%) | 60 (2.1%) |
Public vs Private Health Insurance Coverage by Age in Florence
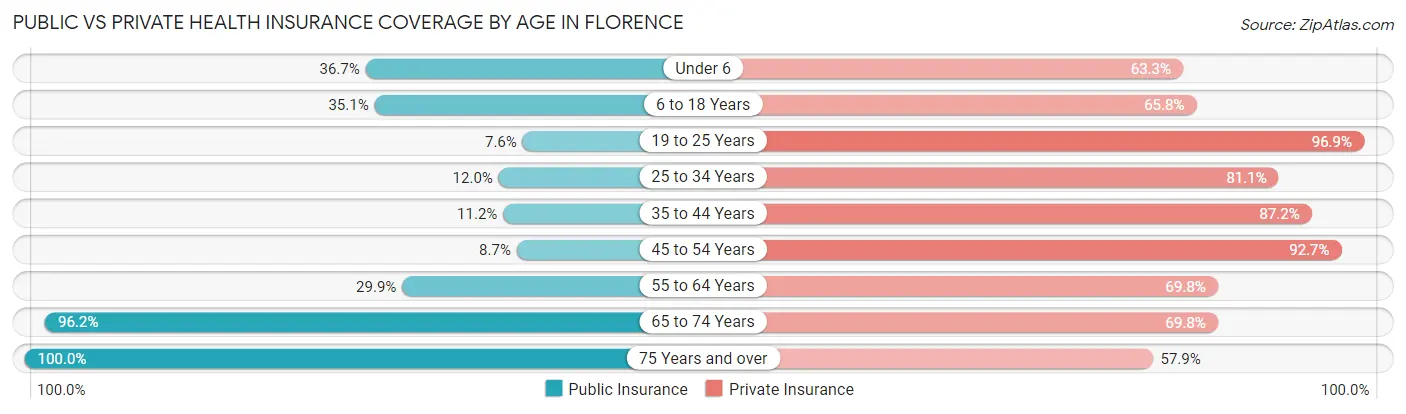
| Age Bracket | Public Insurance | Private Insurance |
| Under 6 | 87 (36.7%) | 150 (63.3%) |
| 6 to 18 Years | 331 (35.1%) | 621 (65.8%) |
| 19 to 25 Years | 34 (7.6%) | 436 (96.9%) |
| 25 to 34 Years | 64 (12.0%) | 432 (81.0%) |
| 35 to 44 Years | 88 (11.2%) | 687 (87.2%) |
| 45 to 54 Years | 57 (8.6%) | 611 (92.7%) |
| 55 to 64 Years | 187 (29.9%) | 436 (69.8%) |
| 65 to 74 Years | 404 (96.2%) | 293 (69.8%) |
| 75 Years and over | 159 (100.0%) | 92 (57.9%) |
| Total | 1,411 (29.3%) | 3,758 (78.0%) |
Disability Status by Sex by Age in Florence
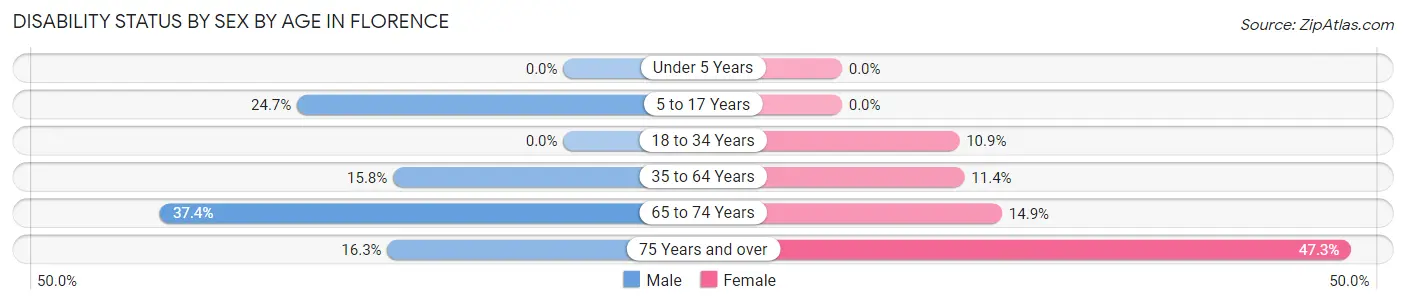
| Age Bracket | Male | Female |
| Under 5 Years | 0 (0.0%) | 0 (0.0%) |
| 5 to 17 Years | 130 (24.7%) | 0 (0.0%) |
| 18 to 34 Years | 0 (0.0%) | 57 (10.9%) |
| 35 to 64 Years | 158 (15.8%) | 122 (11.4%) |
| 65 to 74 Years | 64 (37.4%) | 37 (14.9%) |
| 75 Years and over | 8 (16.3%) | 52 (47.3%) |
Disability Class by Sex by Age in Florence
Disability Class: Hearing Difficulty
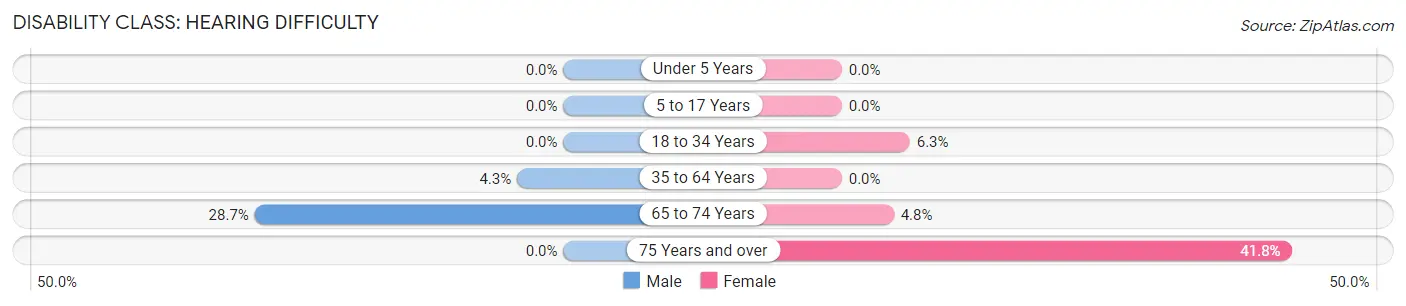
| Age Bracket | Male | Female |
| Under 5 Years | 0 (0.0%) | 0 (0.0%) |
| 5 to 17 Years | 0 (0.0%) | 0 (0.0%) |
| 18 to 34 Years | 0 (0.0%) | 33 (6.3%) |
| 35 to 64 Years | 43 (4.3%) | 0 (0.0%) |
| 65 to 74 Years | 49 (28.6%) | 12 (4.8%) |
| 75 Years and over | 0 (0.0%) | 46 (41.8%) |
Disability Class: Vision Difficulty
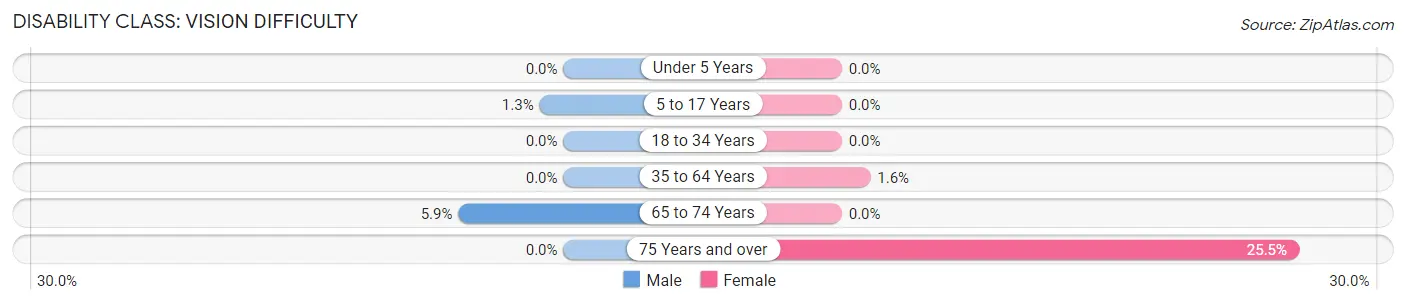
| Age Bracket | Male | Female |
| Under 5 Years | 0 (0.0%) | 0 (0.0%) |
| 5 to 17 Years | 7 (1.3%) | 0 (0.0%) |
| 18 to 34 Years | 0 (0.0%) | 0 (0.0%) |
| 35 to 64 Years | 0 (0.0%) | 17 (1.6%) |
| 65 to 74 Years | 10 (5.9%) | 0 (0.0%) |
| 75 Years and over | 0 (0.0%) | 28 (25.5%) |
Disability Class: Cognitive Difficulty
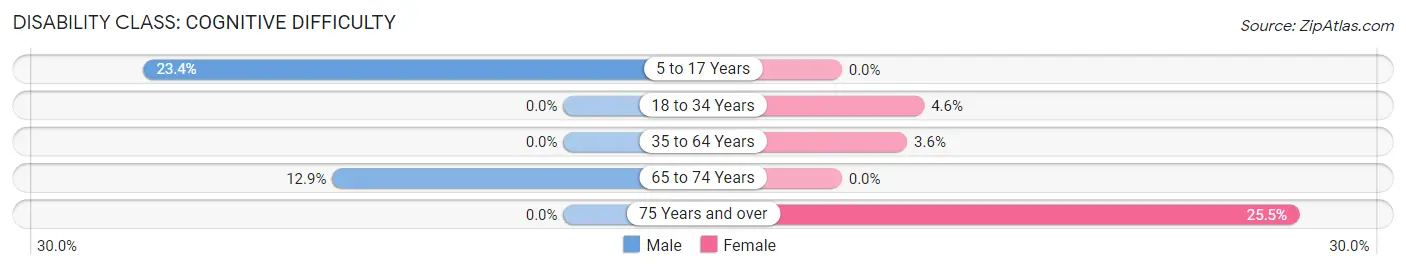
| Age Bracket | Male | Female |
| 5 to 17 Years | 123 (23.4%) | 0 (0.0%) |
| 18 to 34 Years | 0 (0.0%) | 24 (4.6%) |
| 35 to 64 Years | 0 (0.0%) | 39 (3.6%) |
| 65 to 74 Years | 22 (12.9%) | 0 (0.0%) |
| 75 Years and over | 0 (0.0%) | 28 (25.5%) |
Disability Class: Ambulatory Difficulty
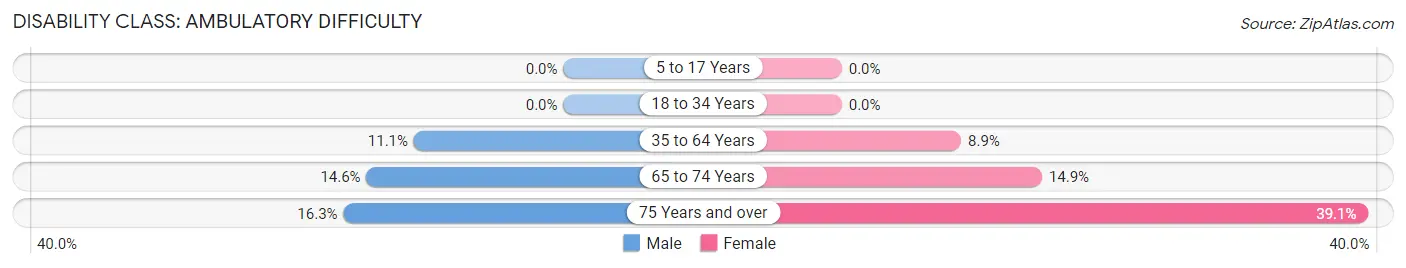
| Age Bracket | Male | Female |
| 5 to 17 Years | 0 (0.0%) | 0 (0.0%) |
| 18 to 34 Years | 0 (0.0%) | 0 (0.0%) |
| 35 to 64 Years | 111 (11.1%) | 95 (8.9%) |
| 65 to 74 Years | 25 (14.6%) | 37 (14.9%) |
| 75 Years and over | 8 (16.3%) | 43 (39.1%) |
Disability Class: Self-Care Difficulty
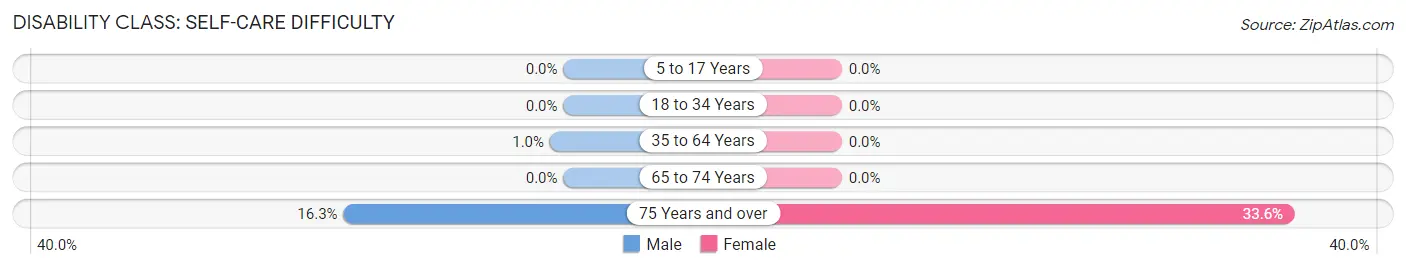
| Age Bracket | Male | Female |
| 5 to 17 Years | 0 (0.0%) | 0 (0.0%) |
| 18 to 34 Years | 0 (0.0%) | 0 (0.0%) |
| 35 to 64 Years | 10 (1.0%) | 0 (0.0%) |
| 65 to 74 Years | 0 (0.0%) | 0 (0.0%) |
| 75 Years and over | 8 (16.3%) | 37 (33.6%) |
Technology Access in Florence
Computing Device Access in Florence
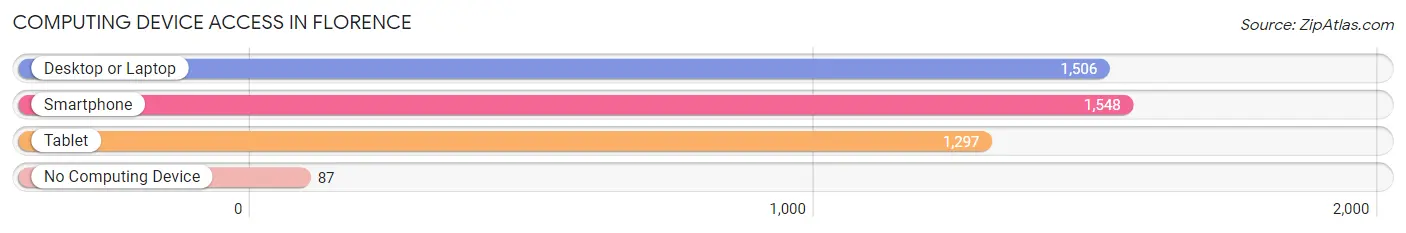
| Device Type | # Households | % Households |
| Desktop or Laptop | 1,506 | 85.7% |
| Smartphone | 1,548 | 88.0% |
| Tablet | 1,297 | 73.8% |
| No Computing Device | 87 | 5.0% |
| Total | 1,758 | 100.0% |
Internet Access in Florence
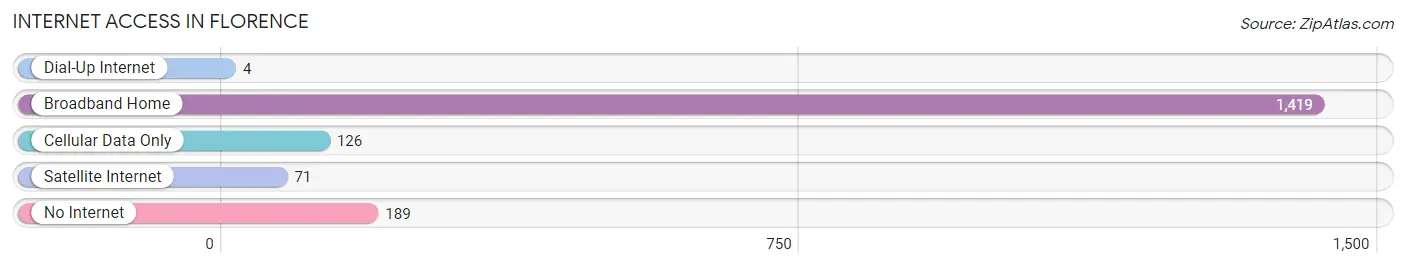
| Internet Type | # Households | % Households |
| Dial-Up Internet | 4 | 0.2% |
| Broadband Home | 1,419 | 80.7% |
| Cellular Data Only | 126 | 7.2% |
| Satellite Internet | 71 | 4.0% |
| No Internet | 189 | 10.7% |
| Total | 1,758 | 100.0% |
Florence Summary
Florence, NJ is a small township located in Burlington County, New Jersey. It is situated along the Delaware River, just north of Trenton and south of Philadelphia. The township is home to a population of approximately 12,000 people, and is part of the larger Florence-Roebling Metropolitan Statistical Area.
History
Florence was first settled in 1677 by English Quakers, who named the area after the city of Florence in Italy. The area was originally part of Burlington Township, but was incorporated as its own township in 1798. During the American Revolution, Florence was the site of a major battle between the British and American forces. The battle, known as the Battle of Iron Works Hill, was fought on January 3, 1777 and resulted in a victory for the American forces.
In the 19th century, Florence became an important industrial center. The Roebling Steel Company, founded by John A. Roebling in 1848, was one of the largest steel producers in the United States. The company was responsible for the construction of the Brooklyn Bridge and the Golden Gate Bridge. The Roebling Steel Company was the largest employer in Florence until it closed in 1974.
Geography
Florence is located in Burlington County, New Jersey. It is situated along the Delaware River, just north of Trenton and south of Philadelphia. The township covers an area of 8.3 square miles, and is bordered by the townships of Mansfield, Bordentown, and Burlington. The terrain of Florence is mostly flat, with some rolling hills in the northern part of the township.
The climate of Florence is humid subtropical, with hot, humid summers and cold, wet winters. The average annual temperature is around 54°F, and the average annual precipitation is around 44 inches.
Economy
Florence’s economy is largely based on manufacturing and retail. The township is home to several large manufacturing companies, including the Roebling Steel Company, which closed in 1974. Other major employers in Florence include the Burlington County Times newspaper, the Burlington County Library System, and the Florence Township School District.
The retail sector of Florence’s economy is centered around the Florence Mall, which opened in 1972. The mall is home to several major retailers, including Macy’s, JCPenney, and Sears.
Demographics
As of the 2010 census, Florence had a population of 12,109 people. The racial makeup of the township was 79.3% White, 14.2% African American, 0.5% Native American, 2.2% Asian, and 3.8% from other races. The median household income in Florence was $63,917, and the median family income was $76,917.
Florence is home to a large Italian-American population, with over 30% of the population identifying as Italian. The township also has a large Hispanic population, with over 10% of the population identifying as Hispanic or Latino. The majority of the population is Christian, with over 70% of the population identifying as Christian.
Common Questions
What is Per Capita Income in Florence?
Per Capita income in Florence is $40,395.
What is the Median Family Income in Florence?
Median Family Income in Florence is $110,202.
What is the Median Household income in Florence?
Median Household Income in Florence is $95,096.
What is Income or Wage Gap in Florence?
Income or Wage Gap in Florence is 19.1%.
Women in Florence earn 80.9 cents for every dollar earned by a man.
What is Inequality or Gini Index in Florence?
Inequality or Gini Index in Florence is 0.39.
What is the Total Population of Florence?
Total Population of Florence is 4,815.
What is the Total Male Population of Florence?
Total Male Population of Florence is 2,349.
What is the Total Female Population of Florence?
Total Female Population of Florence is 2,466.
What is the Ratio of Males per 100 Females in Florence?
There are 95.26 Males per 100 Females in Florence.
What is the Ratio of Females per 100 Males in Florence?
There are 104.98 Females per 100 Males in Florence.
What is the Median Population Age in Florence?
Median Population Age in Florence is 39.3 Years.
What is the Average Family Size in Florence
Average Family Size in Florence is 3.4 People.
What is the Average Household Size in Florence
Average Household Size in Florence is 2.7 People.
How Large is the Labor Force in Florence?
There are 3,015 People in the Labor Forcein in Florence.
What is the Percentage of People in the Labor Force in Florence?
81.3% of People are in the Labor Force in Florence.
What is the Unemployment Rate in Florence?
Unemployment Rate in Florence is 6.0%.