Belleplain, NJ Map & Demographics
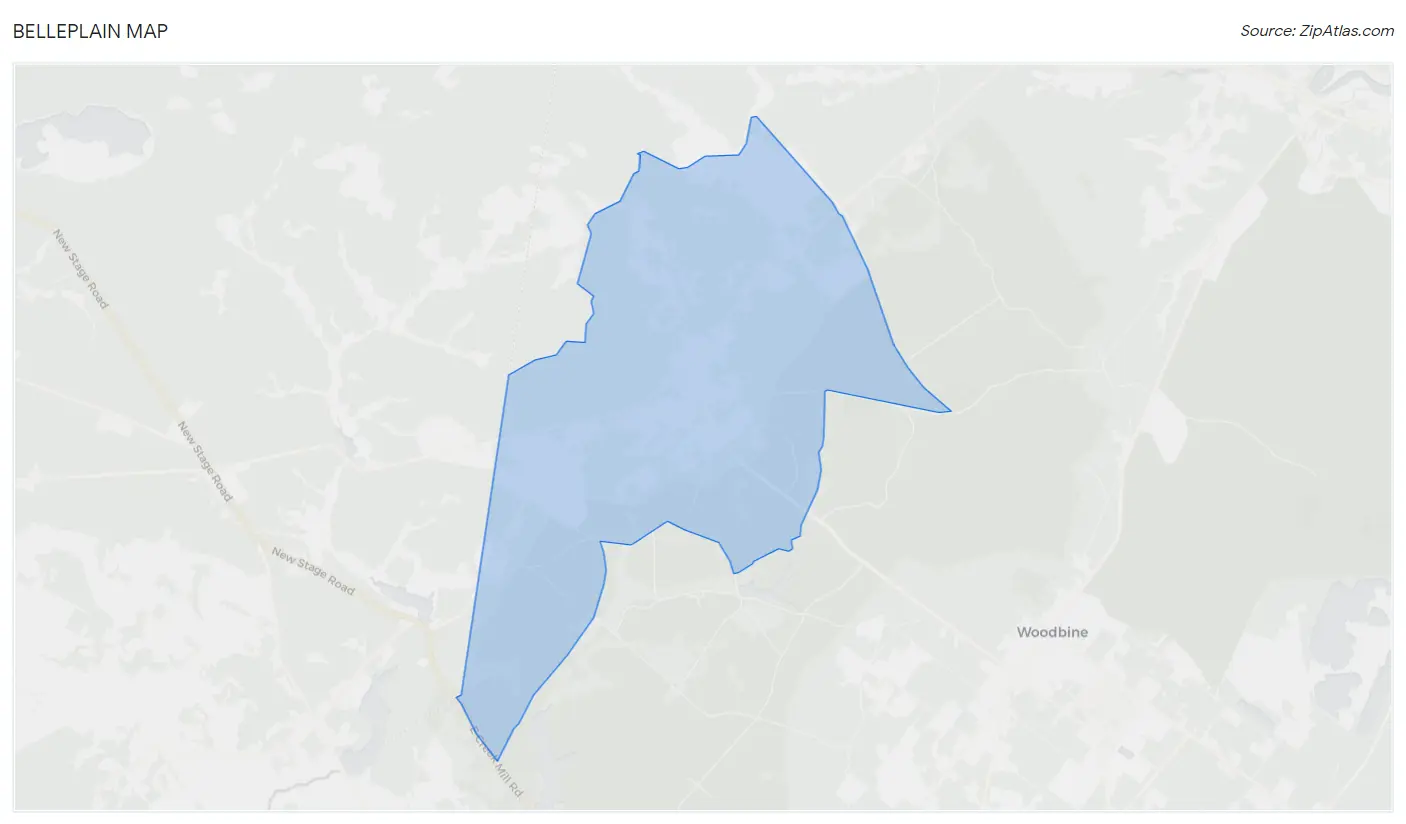
Belleplain Map
Belleplain Overview
$31,784
PER CAPITA INCOME
$70,938
AVG FAMILY INCOME
$54,102
AVG HOUSEHOLD INCOME
4.0%
WAGE / INCOME GAP [ % ]
96.0¢/ $1
WAGE / INCOME GAP [ $ ]
0.37
INEQUALITY / GINI INDEX
463
TOTAL POPULATION
210
MALE POPULATION
253
FEMALE POPULATION
83.00
MALES / 100 FEMALES
120.48
FEMALES / 100 MALES
54.2
MEDIAN AGE
2.7
AVG FAMILY SIZE
2.1
AVG HOUSEHOLD SIZE
172
LABOR FORCE [ PEOPLE ]
47.4%
PERCENT IN LABOR FORCE
Income in Belleplain
Income Overview in Belleplain
Per Capita Income in Belleplain is $31,784, while median incomes of families and households are $70,938 and $54,102 respectively.
| Characteristic | Number | Measure |
| Per Capita Income | 463 | $31,784 |
| Median Family Income | 144 | $70,938 |
| Mean Family Income | 144 | $88,308 |
| Median Household Income | 215 | $54,102 |
| Mean Household Income | 215 | $71,497 |
| Income Deficit | 144 | $0 |
| Wage / Income Gap (%) | 463 | 4.03% |
| Wage / Income Gap ($) | 463 | 95.97¢ per $1 |
| Gini / Inequality Index | 463 | 0.37 |
Earnings by Sex in Belleplain
Average Earnings in Belleplain are $41,306, $40,000 for men and $41,679 for women, a difference of 4.0%.
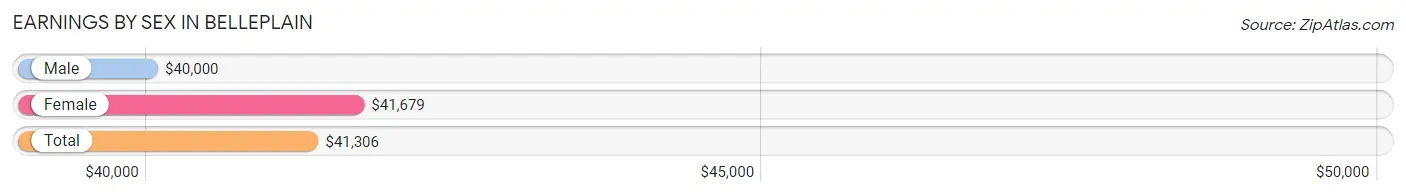
| Sex | Number | Average Earnings |
| Male | 106 (57.3%) | $40,000 |
| Female | 79 (42.7%) | $41,679 |
| Total | 185 (100.0%) | $41,306 |
Earnings by Sex by Income Bracket in Belleplain
The most common earnings brackets in Belleplain are $12,500 to $14,999 for men (25 | 23.6%) and $40,000 to $44,999 for women (44 | 55.7%).
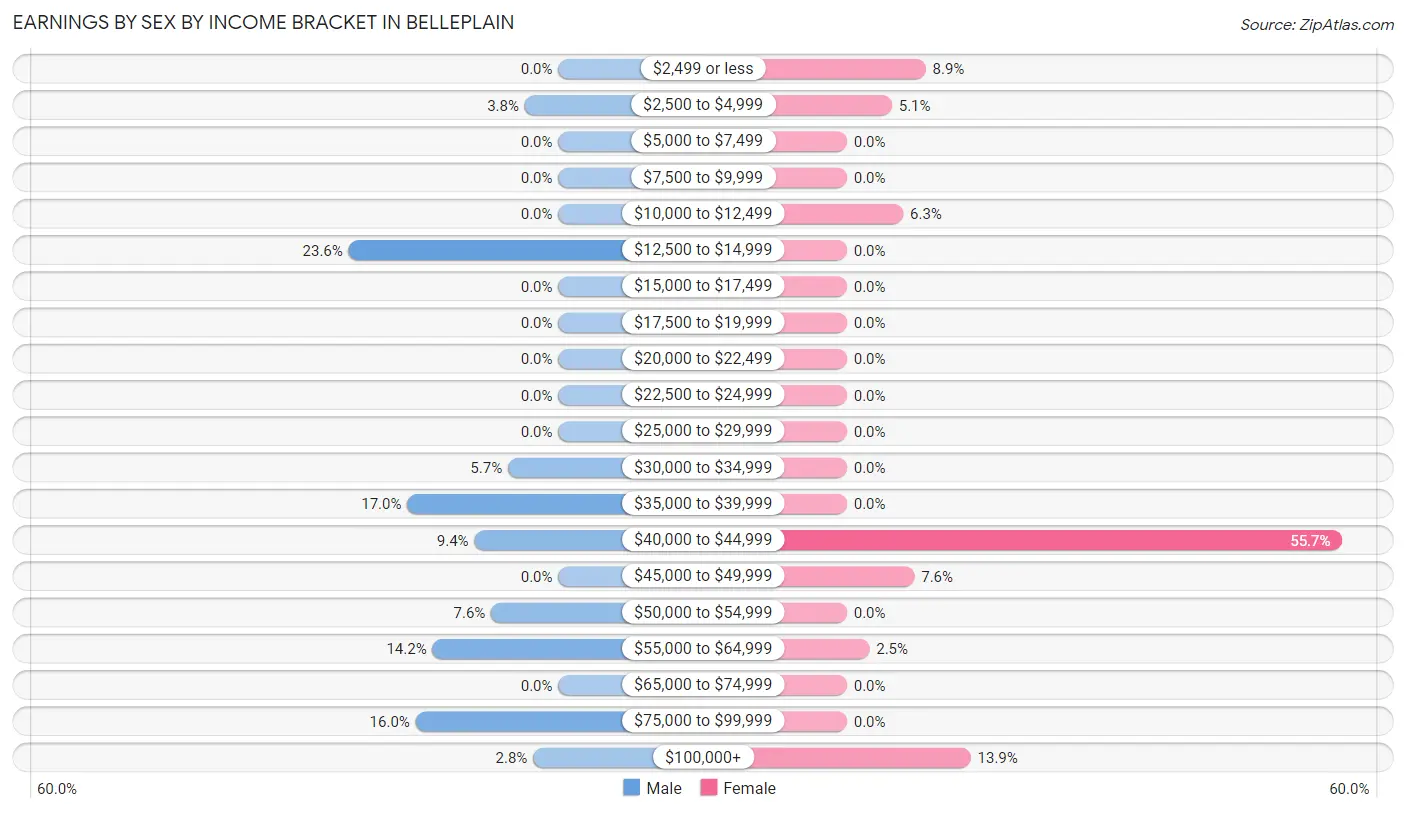
| Income | Male | Female |
| $2,499 or less | 0 (0.0%) | 7 (8.9%) |
| $2,500 to $4,999 | 4 (3.8%) | 4 (5.1%) |
| $5,000 to $7,499 | 0 (0.0%) | 0 (0.0%) |
| $7,500 to $9,999 | 0 (0.0%) | 0 (0.0%) |
| $10,000 to $12,499 | 0 (0.0%) | 5 (6.3%) |
| $12,500 to $14,999 | 25 (23.6%) | 0 (0.0%) |
| $15,000 to $17,499 | 0 (0.0%) | 0 (0.0%) |
| $17,500 to $19,999 | 0 (0.0%) | 0 (0.0%) |
| $20,000 to $22,499 | 0 (0.0%) | 0 (0.0%) |
| $22,500 to $24,999 | 0 (0.0%) | 0 (0.0%) |
| $25,000 to $29,999 | 0 (0.0%) | 0 (0.0%) |
| $30,000 to $34,999 | 6 (5.7%) | 0 (0.0%) |
| $35,000 to $39,999 | 18 (17.0%) | 0 (0.0%) |
| $40,000 to $44,999 | 10 (9.4%) | 44 (55.7%) |
| $45,000 to $49,999 | 0 (0.0%) | 6 (7.6%) |
| $50,000 to $54,999 | 8 (7.5%) | 0 (0.0%) |
| $55,000 to $64,999 | 15 (14.1%) | 2 (2.5%) |
| $65,000 to $74,999 | 0 (0.0%) | 0 (0.0%) |
| $75,000 to $99,999 | 17 (16.0%) | 0 (0.0%) |
| $100,000+ | 3 (2.8%) | 11 (13.9%) |
| Total | 106 (100.0%) | 79 (100.0%) |
Earnings by Sex by Educational Attainment in Belleplain
Average earnings in Belleplain are $40,000 for men and $41,679 for women, a difference of 4.0%. Men with an educational attainment of college or associate's degree enjoy the highest average annual earnings of $39,722, while those with college or associate's degree education earn the least with $39,722. Women with an educational attainment of bachelor's degree earn the most with the average annual earnings of $108,281, while those with college or associate's degree education have the smallest earnings of $41,328.
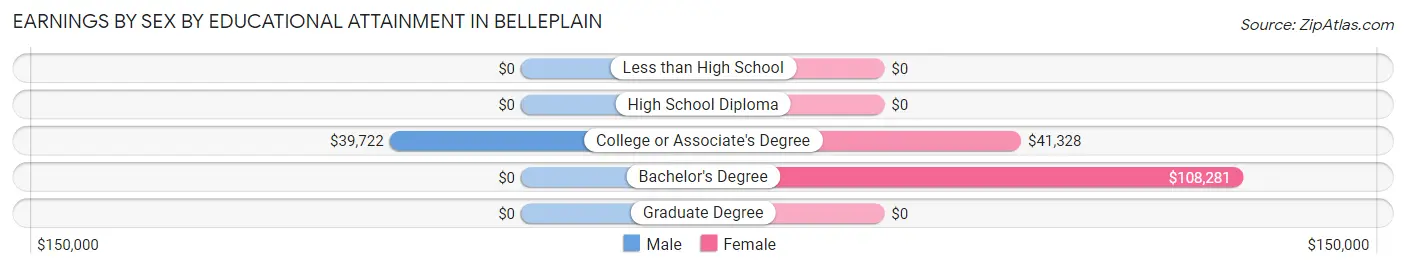
| Educational Attainment | Male Income | Female Income |
| Less than High School | - | - |
| High School Diploma | - | - |
| College or Associate's Degree | $39,722 | $41,328 |
| Bachelor's Degree | - | - |
| Graduate Degree | - | - |
| Total | $40,000 | $41,679 |
Family Income in Belleplain
Family Income Brackets in Belleplain
According to the Belleplain family income data, there are 56 families falling into the $50,000 to $74,999 income range, which is the most common income bracket and makes up 38.9% of all families.
| Income Bracket | # Families | % Families |
| Less than $10,000 | 0 | 0.0% |
| $10,000 to $14,999 | 0 | 0.0% |
| $15,000 to $24,999 | 9 | 6.3% |
| $25,000 to $34,999 | 4 | 2.8% |
| $35,000 to $49,999 | 8 | 5.6% |
| $50,000 to $74,999 | 56 | 38.9% |
| $75,000 to $99,999 | 34 | 23.6% |
| $100,000 to $149,999 | 9 | 6.3% |
| $150,000 to $199,999 | 13 | 9.0% |
| $200,000+ | 11 | 7.6% |
Family Income by Famaliy Size in Belleplain
2-person families (76 | 52.8%) account for the highest median family income in Belleplain with $78,500 per family, while 2-person families (76 | 52.8%) have the highest median income of $39,250 per family member.
| Income Bracket | # Families | Median Income |
| 2-Person Families | 76 (52.8%) | $78,500 |
| 3-Person Families | 28 (19.4%) | $0 |
| 4-Person Families | 0 (0.0%) | $0 |
| 5-Person Families | 8 (5.6%) | $0 |
| 6-Person Families | 32 (22.2%) | $0 |
| 7+ Person Families | 0 (0.0%) | $0 |
| Total | 144 (100.0%) | $70,938 |
Family Income by Number of Earners in Belleplain
| Number of Earners | # Families | Median Income |
| No Earners | 37 (25.7%) | $70,750 |
| 1 Earner | 41 (28.5%) | $70,417 |
| 2 Earners | 58 (40.3%) | $0 |
| 3+ Earners | 8 (5.6%) | $0 |
| Total | 144 (100.0%) | $70,938 |
Household Income in Belleplain
Household Income Brackets in Belleplain
With 62 households falling in the category, the $50,000 to $74,999 income range is the most frequent in Belleplain, accounting for 28.8% of all households.
| Income Bracket | # Households | % Households |
| Less than $10,000 | 0 | 0.0% |
| $10,000 to $14,999 | 0 | 0.0% |
| $15,000 to $24,999 | 30 | 14.0% |
| $25,000 to $34,999 | 9 | 4.2% |
| $35,000 to $49,999 | 42 | 19.5% |
| $50,000 to $74,999 | 62 | 28.8% |
| $75,000 to $99,999 | 39 | 18.1% |
| $100,000 to $149,999 | 9 | 4.2% |
| $150,000 to $199,999 | 13 | 6.0% |
| $200,000+ | 11 | 5.1% |
Household Income by Householder Age in Belleplain
The median household income in Belleplain is $54,102, with the highest median household income of $53,672 found in the 25 to 44 years age bracket for the primary householder. A total of 66 households (30.7%) fall into this category.
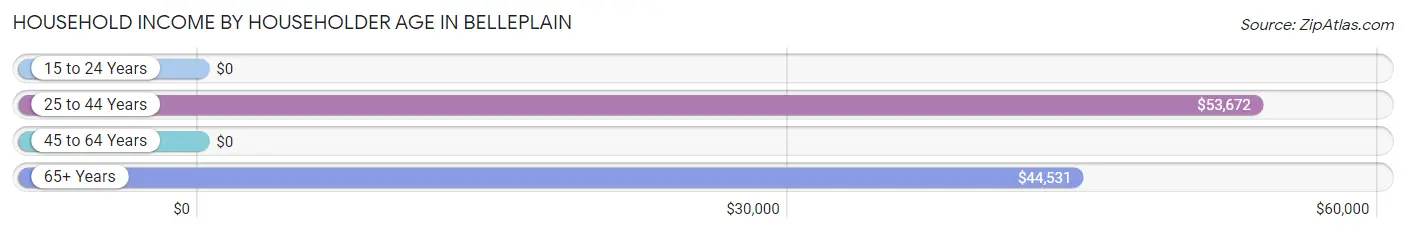
| Income Bracket | # Households | Median Income |
| 15 to 24 Years | 0 (0.0%) | $0 |
| 25 to 44 Years | 66 (30.7%) | $53,672 |
| 45 to 64 Years | 55 (25.6%) | $0 |
| 65+ Years | 94 (43.7%) | $44,531 |
| Total | 215 (100.0%) | $54,102 |
Poverty in Belleplain
Income Below Poverty by Sex and Age in Belleplain
With 6.7% poverty level for males and 3.2% for females among the residents of Belleplain, 55 to 64 year old males and 45 to 54 year old females are the most vulnerable to poverty, with 9 males (24.3%) and 8 females (40.0%) in their respective age groups living below the poverty level.
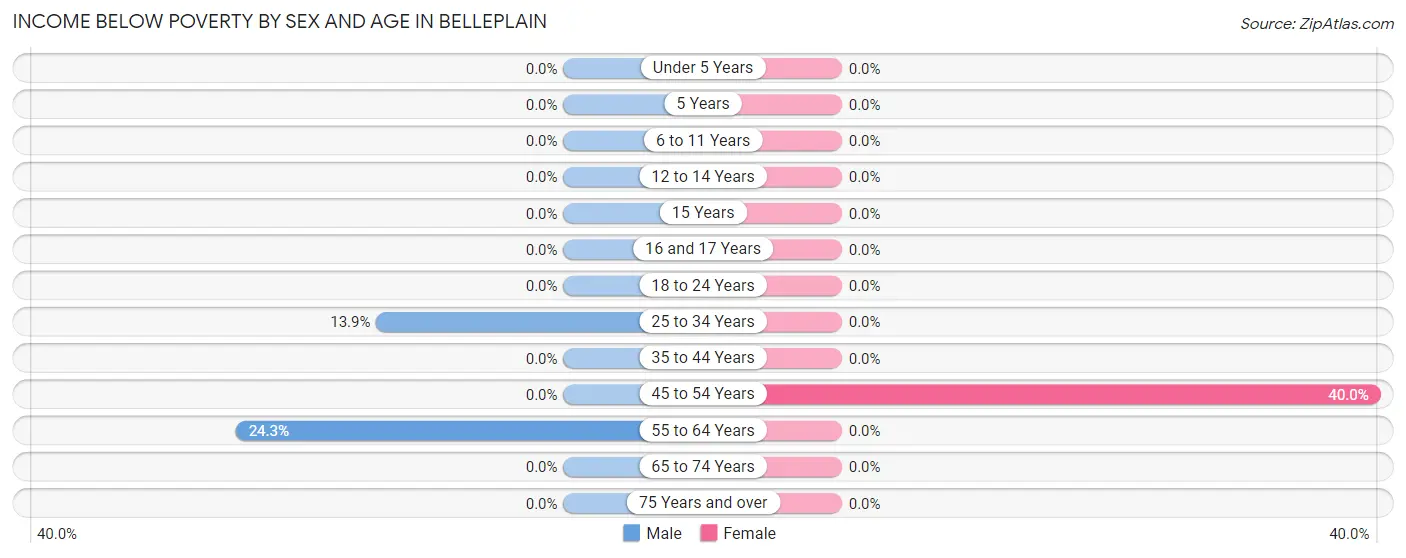
| Age Bracket | Male | Female |
| Under 5 Years | 0 (0.0%) | 0 (0.0%) |
| 5 Years | 0 (0.0%) | 0 (0.0%) |
| 6 to 11 Years | 0 (0.0%) | 0 (0.0%) |
| 12 to 14 Years | 0 (0.0%) | 0 (0.0%) |
| 15 Years | 0 (0.0%) | 0 (0.0%) |
| 16 and 17 Years | 0 (0.0%) | 0 (0.0%) |
| 18 to 24 Years | 0 (0.0%) | 0 (0.0%) |
| 25 to 34 Years | 5 (13.9%) | 0 (0.0%) |
| 35 to 44 Years | 0 (0.0%) | 0 (0.0%) |
| 45 to 54 Years | 0 (0.0%) | 8 (40.0%) |
| 55 to 64 Years | 9 (24.3%) | 0 (0.0%) |
| 65 to 74 Years | 0 (0.0%) | 0 (0.0%) |
| 75 Years and over | 0 (0.0%) | 0 (0.0%) |
| Total | 14 (6.7%) | 8 (3.2%) |
Income Above Poverty by Sex and Age in Belleplain
According to the poverty statistics in Belleplain, males aged under 5 years and females aged under 5 years are the age groups that are most secure financially, with 100.0% of males and 100.0% of females in these age groups living above the poverty line.
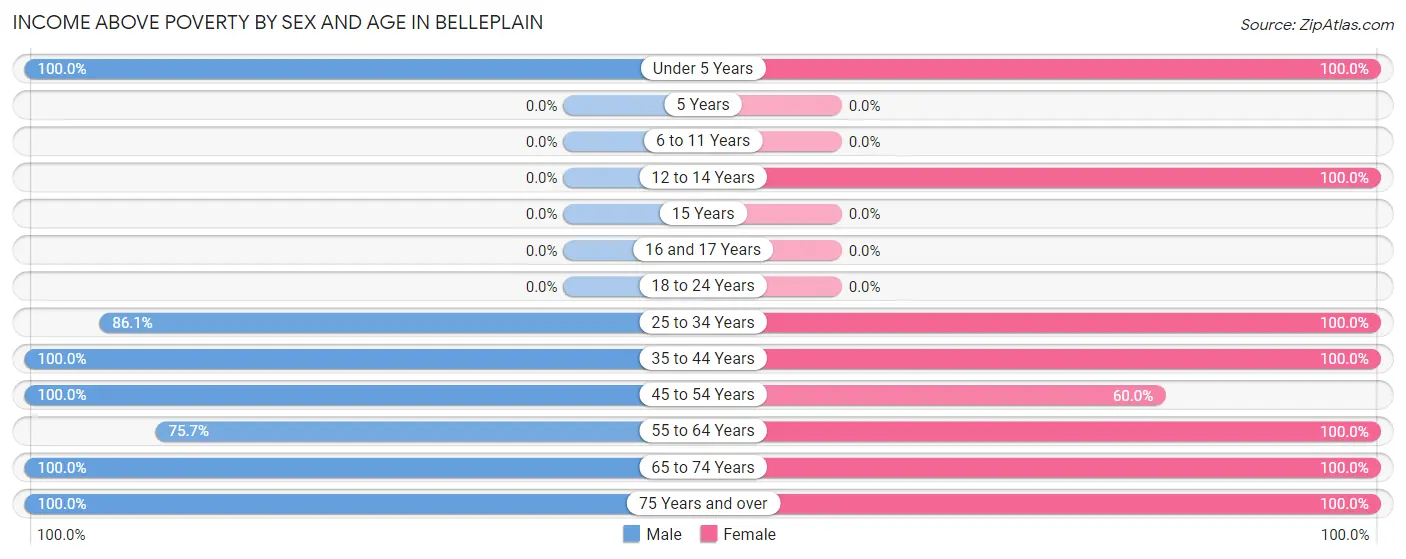
| Age Bracket | Male | Female |
| Under 5 Years | 32 (100.0%) | 59 (100.0%) |
| 5 Years | 0 (0.0%) | 0 (0.0%) |
| 6 to 11 Years | 0 (0.0%) | 0 (0.0%) |
| 12 to 14 Years | 0 (0.0%) | 9 (100.0%) |
| 15 Years | 0 (0.0%) | 0 (0.0%) |
| 16 and 17 Years | 0 (0.0%) | 0 (0.0%) |
| 18 to 24 Years | 0 (0.0%) | 0 (0.0%) |
| 25 to 34 Years | 31 (86.1%) | 41 (100.0%) |
| 35 to 44 Years | 25 (100.0%) | 9 (100.0%) |
| 45 to 54 Years | 9 (100.0%) | 12 (60.0%) |
| 55 to 64 Years | 28 (75.7%) | 46 (100.0%) |
| 65 to 74 Years | 55 (100.0%) | 39 (100.0%) |
| 75 Years and over | 16 (100.0%) | 30 (100.0%) |
| Total | 196 (93.3%) | 245 (96.8%) |
Income Below Poverty Among Married-Couple Families in Belleplain
The poverty statistics for married-couple families in Belleplain show that 6.2% or 9 of the total 144 families live below the poverty line. Families with no children have the highest poverty rate of 9.5%, comprising of 9 families. On the other hand, families with 1 or 2 children have the lowest poverty rate of 0.0%, which includes 0 families.
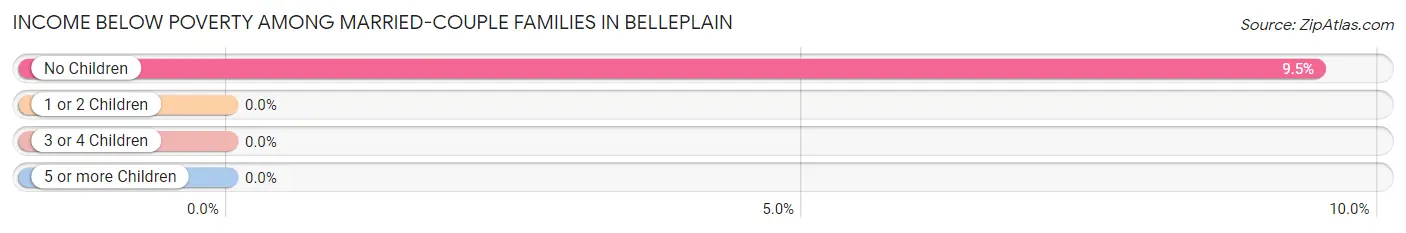
| Children | Above Poverty | Below Poverty |
| No Children | 86 (90.5%) | 9 (9.5%) |
| 1 or 2 Children | 17 (100.0%) | 0 (0.0%) |
| 3 or 4 Children | 32 (100.0%) | 0 (0.0%) |
| 5 or more Children | 0 (0.0%) | 0 (0.0%) |
| Total | 135 (93.8%) | 9 (6.2%) |
Income Below Poverty Among Single-Parent Households in Belleplain
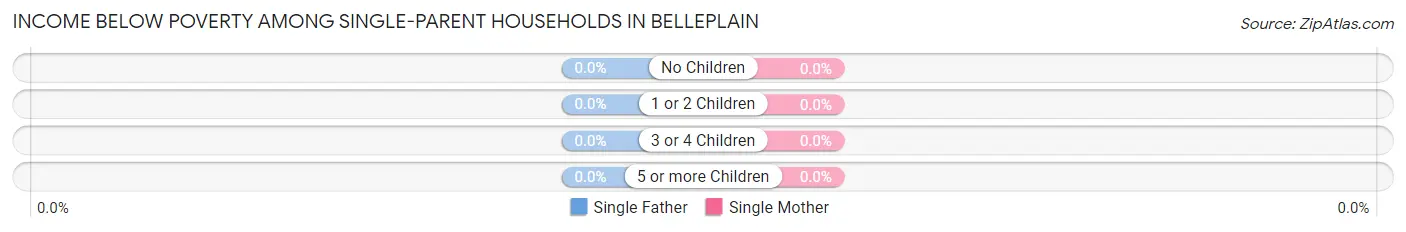
| Children | Single Father | Single Mother |
| No Children | 0 (0.0%) | 0 (0.0%) |
| 1 or 2 Children | 0 (0.0%) | 0 (0.0%) |
| 3 or 4 Children | 0 (0.0%) | 0 (0.0%) |
| 5 or more Children | 0 (0.0%) | 0 (0.0%) |
| Total | 0 (0.0%) | 0 (0.0%) |
Income Below Poverty Among Married-Couple vs Single-Parent Households in Belleplain
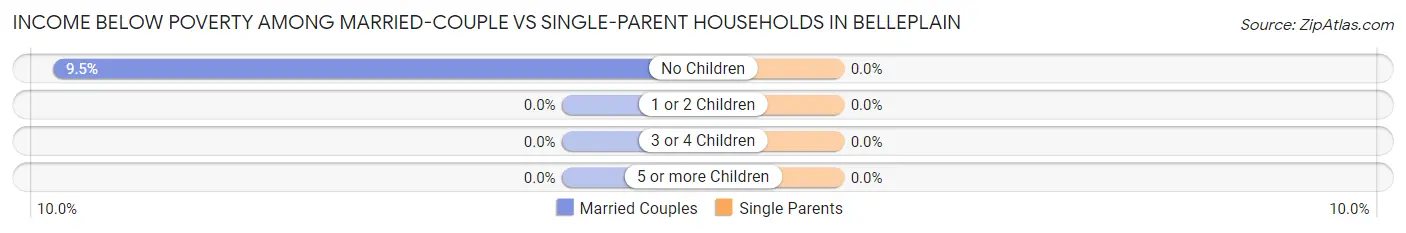
| Children | Married-Couple Families | Single-Parent Households |
| No Children | 9 (9.5%) | 0 (0.0%) |
| 1 or 2 Children | 0 (0.0%) | 0 (0.0%) |
| 3 or 4 Children | 0 (0.0%) | 0 (0.0%) |
| 5 or more Children | 0 (0.0%) | 0 (0.0%) |
| Total | 9 (6.2%) | 0 (0.0%) |
Race in Belleplain
The most populous races in Belleplain are White / Caucasian (447 | 96.5%), and Asian (16 | 3.5%).
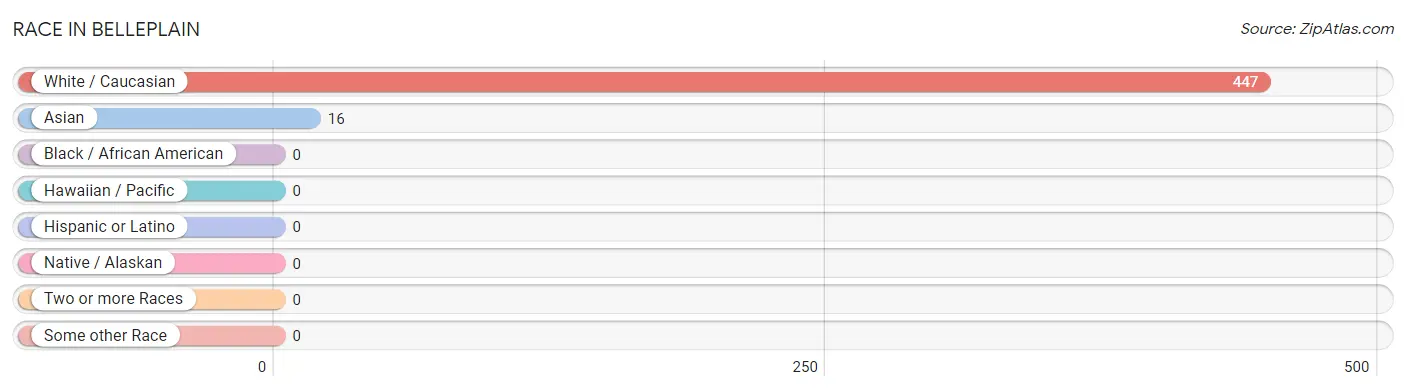
| Race | # Population | % Population |
| Asian | 16 | 3.5% |
| Black / African American | 0 | 0.0% |
| Hawaiian / Pacific | 0 | 0.0% |
| Hispanic or Latino | 0 | 0.0% |
| Native / Alaskan | 0 | 0.0% |
| White / Caucasian | 447 | 96.5% |
| Two or more Races | 0 | 0.0% |
| Some other Race | 0 | 0.0% |
| Total | 463 | 100.0% |
Ancestry in Belleplain
The most populous ancestries reported in Belleplain are Italian (219 | 47.3%), German (143 | 30.9%), Irish (130 | 28.1%), English (57 | 12.3%), and Czech (18 | 3.9%), together accounting for 122.5% of all Belleplain residents.
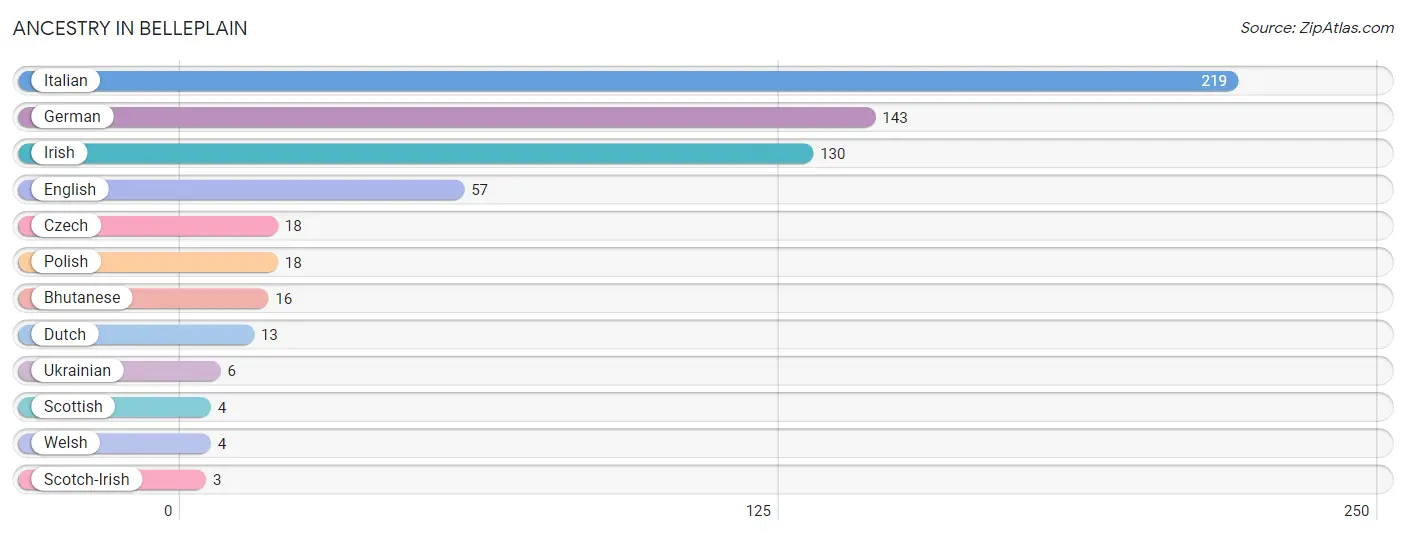
| Ancestry | # Population | % Population |
| Bhutanese | 16 | 3.5% |
| Czech | 18 | 3.9% |
| Dutch | 13 | 2.8% |
| English | 57 | 12.3% |
| German | 143 | 30.9% |
| Irish | 130 | 28.1% |
| Italian | 219 | 47.3% |
| Polish | 18 | 3.9% |
| Scotch-Irish | 3 | 0.6% |
| Scottish | 4 | 0.9% |
| Ukrainian | 6 | 1.3% |
| Welsh | 4 | 0.9% | View All 12 Rows |
Immigrants in Belleplain
The most numerous immigrant groups reported in Belleplain came from Asia (16 | 3.5%), Eastern Asia (16 | 3.5%), and Japan (16 | 3.5%), together accounting for 10.4% of all Belleplain residents.
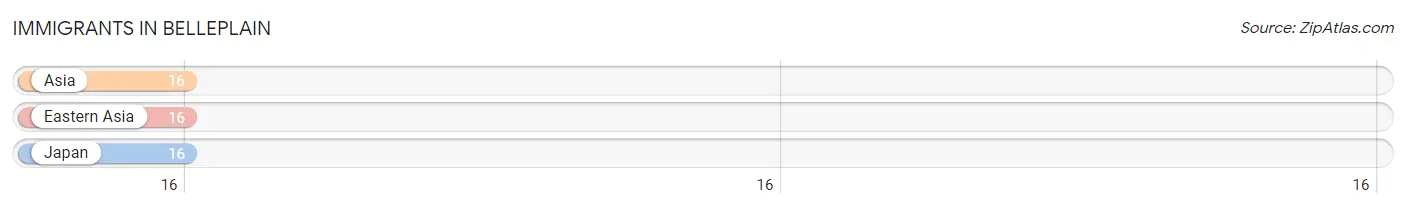
| Immigration Origin | # Population | % Population |
| Asia | 16 | 3.5% |
| Eastern Asia | 16 | 3.5% |
| Japan | 16 | 3.5% | View All 3 Rows |
Sex and Age in Belleplain
Sex and Age in Belleplain
The most populous age groups in Belleplain are 65 to 69 Years (51 | 24.3%) for men and Under 5 Years (59 | 23.3%) for women.
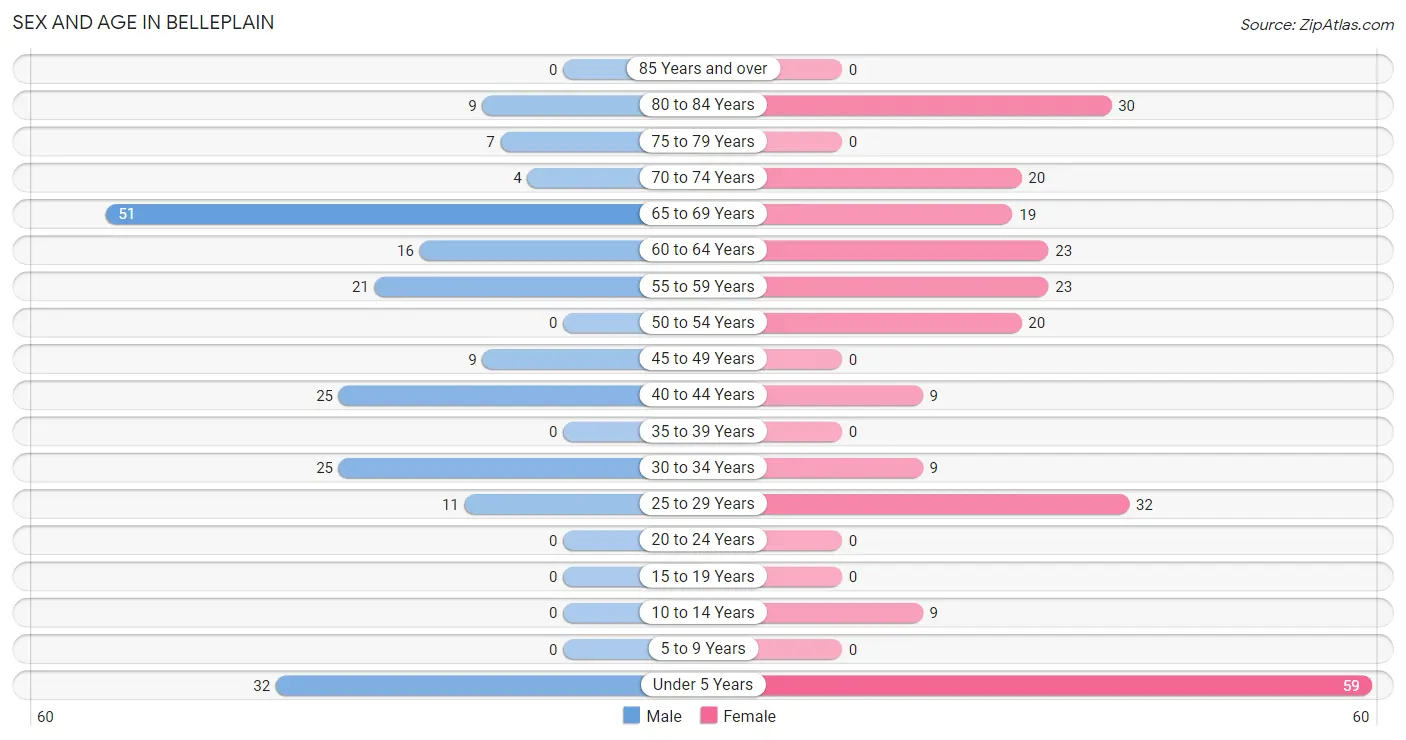
| Age Bracket | Male | Female |
| Under 5 Years | 32 (15.2%) | 59 (23.3%) |
| 5 to 9 Years | 0 (0.0%) | 0 (0.0%) |
| 10 to 14 Years | 0 (0.0%) | 9 (3.6%) |
| 15 to 19 Years | 0 (0.0%) | 0 (0.0%) |
| 20 to 24 Years | 0 (0.0%) | 0 (0.0%) |
| 25 to 29 Years | 11 (5.2%) | 32 (12.7%) |
| 30 to 34 Years | 25 (11.9%) | 9 (3.6%) |
| 35 to 39 Years | 0 (0.0%) | 0 (0.0%) |
| 40 to 44 Years | 25 (11.9%) | 9 (3.6%) |
| 45 to 49 Years | 9 (4.3%) | 0 (0.0%) |
| 50 to 54 Years | 0 (0.0%) | 20 (7.9%) |
| 55 to 59 Years | 21 (10.0%) | 23 (9.1%) |
| 60 to 64 Years | 16 (7.6%) | 23 (9.1%) |
| 65 to 69 Years | 51 (24.3%) | 19 (7.5%) |
| 70 to 74 Years | 4 (1.9%) | 20 (7.9%) |
| 75 to 79 Years | 7 (3.3%) | 0 (0.0%) |
| 80 to 84 Years | 9 (4.3%) | 30 (11.9%) |
| 85 Years and over | 0 (0.0%) | 0 (0.0%) |
| Total | 210 (100.0%) | 253 (100.0%) |
Families and Households in Belleplain
Median Family Size in Belleplain
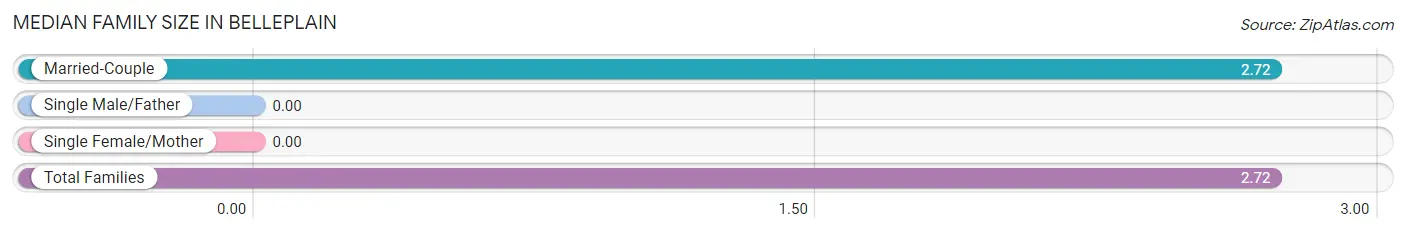
| Family Type | # Families | Family Size |
| Married-Couple | 144 (100.0%) | 2.72 |
| Single Male/Father | 0 (0.0%) | - |
| Single Female/Mother | 0 (0.0%) | - |
| Total Families | 144 (100.0%) | 2.72 |
Median Household Size in Belleplain
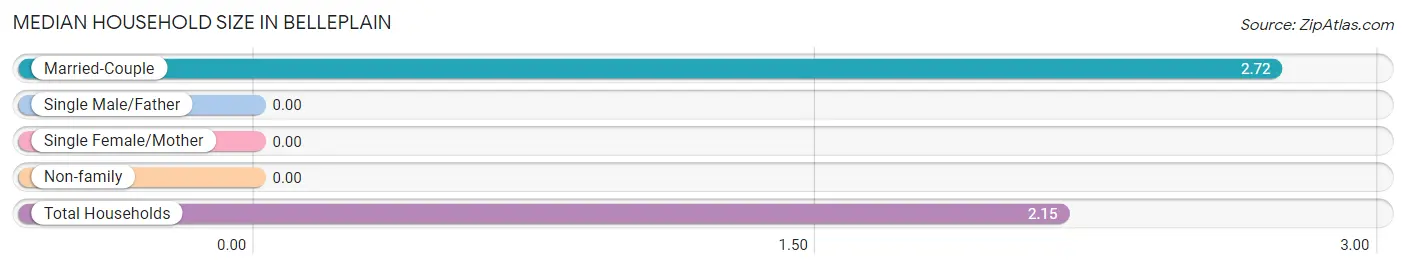
| Household Type | # Households | Household Size |
| Married-Couple | 144 (67.0%) | 2.72 |
| Single Male/Father | 0 (0.0%) | - |
| Single Female/Mother | 0 (0.0%) | - |
| Non-family | 71 (33.0%) | - |
| Total Households | 215 (100.0%) | 2.15 |
Household Size by Marriage Status in Belleplain
Out of a total of 215 households in Belleplain, 144 (67.0%) are family households, while 71 (33.0%) are nonfamily households. The most numerous type of family households are 2-person households, comprising 76, and the most common type of nonfamily households are 1-person households, comprising 71.
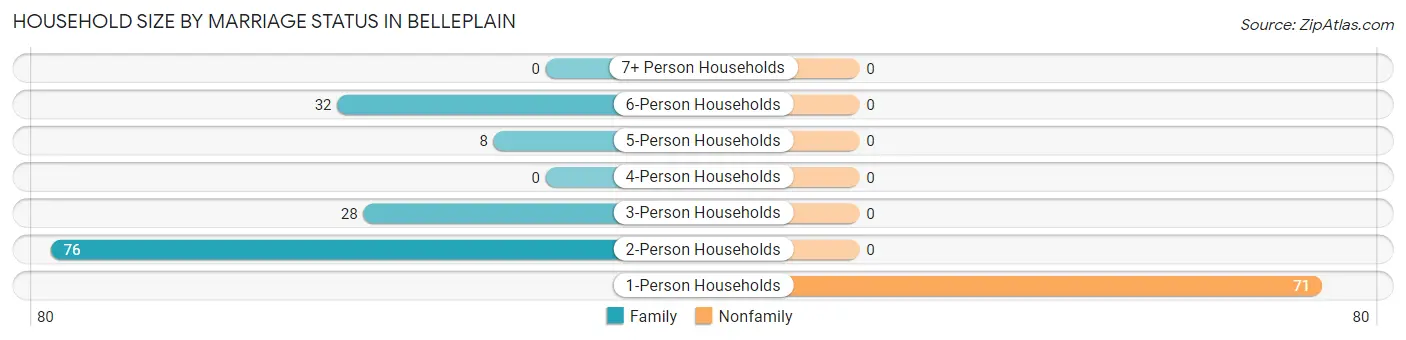
| Household Size | Family Households | Nonfamily Households |
| 1-Person Households | - | 71 (33.0%) |
| 2-Person Households | 76 (35.3%) | 0 (0.0%) |
| 3-Person Households | 28 (13.0%) | 0 (0.0%) |
| 4-Person Households | 0 (0.0%) | 0 (0.0%) |
| 5-Person Households | 8 (3.7%) | 0 (0.0%) |
| 6-Person Households | 32 (14.9%) | 0 (0.0%) |
| 7+ Person Households | 0 (0.0%) | 0 (0.0%) |
| Total | 144 (67.0%) | 71 (33.0%) |
Female Fertility in Belleplain
Fertility by Age in Belleplain
| Age Bracket | Women with Births | Births / 1,000 Women |
| 15 to 19 years | 0 (0.0%) | 0.0 |
| 20 to 34 years | 0 (0.0%) | 0.0 |
| 35 to 50 years | 0 (0.0%) | 0.0 |
| Total | 0 (0.0%) | 0.0 |
Fertility by Age by Marriage Status in Belleplain
| Age Bracket | Married | Unmarried |
| 15 to 19 years | 0 (0.0%) | 0 (0.0%) |
| 20 to 34 years | 0 (0.0%) | 0 (0.0%) |
| 35 to 50 years | 0 (0.0%) | 0 (0.0%) |
| Total | 0 (0.0%) | 0 (0.0%) |
Fertility by Education in Belleplain
| Educational Attainment | Women with Births | Births / 1,000 Women |
| Less than High School | 0 (0.0%) | 0.0 |
| High School Diploma | 0 (0.0%) | 0.0 |
| College or Associate's Degree | 0 (0.0%) | 0.0 |
| Bachelor's Degree | 0 (0.0%) | 0.0 |
| Graduate Degree | 0 (0.0%) | 0.0 |
| Total | 0 (0.0%) | 0.0 |
Fertility by Education by Marriage Status in Belleplain
| Educational Attainment | Married | Unmarried |
| Less than High School | 0 (0.0%) | 0 (0.0%) |
| High School Diploma | 0 (0.0%) | 0 (0.0%) |
| College or Associate's Degree | 0 (0.0%) | 0 (0.0%) |
| Bachelor's Degree | 0 (0.0%) | 0 (0.0%) |
| Graduate Degree | 0 (0.0%) | 0 (0.0%) |
| Total | 0 (0.0%) | 0 (0.0%) |
Employment Characteristics in Belleplain
Employment by Class of Employer in Belleplain
Among the 172 employed individuals in Belleplain, private company employees (126 | 73.3%), local government employees (32 | 18.6%), and not-for-profit organizations (8 | 4.6%) make up the most common classes of employment.
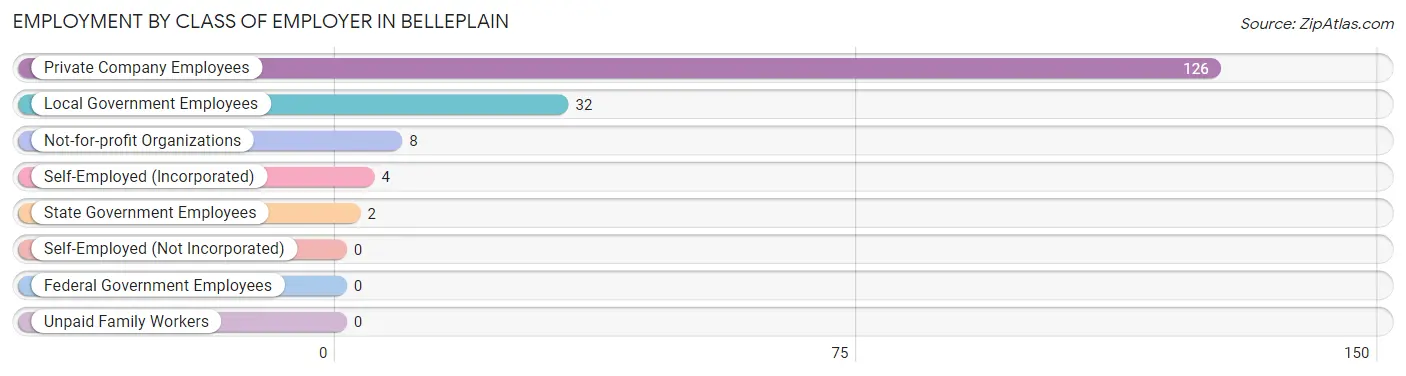
| Employer Class | # Employees | % Employees |
| Private Company Employees | 126 | 73.3% |
| Self-Employed (Incorporated) | 4 | 2.3% |
| Self-Employed (Not Incorporated) | 0 | 0.0% |
| Not-for-profit Organizations | 8 | 4.6% |
| Local Government Employees | 32 | 18.6% |
| State Government Employees | 2 | 1.2% |
| Federal Government Employees | 0 | 0.0% |
| Unpaid Family Workers | 0 | 0.0% |
| Total | 172 | 100.0% |
Employment Status by Age in Belleplain
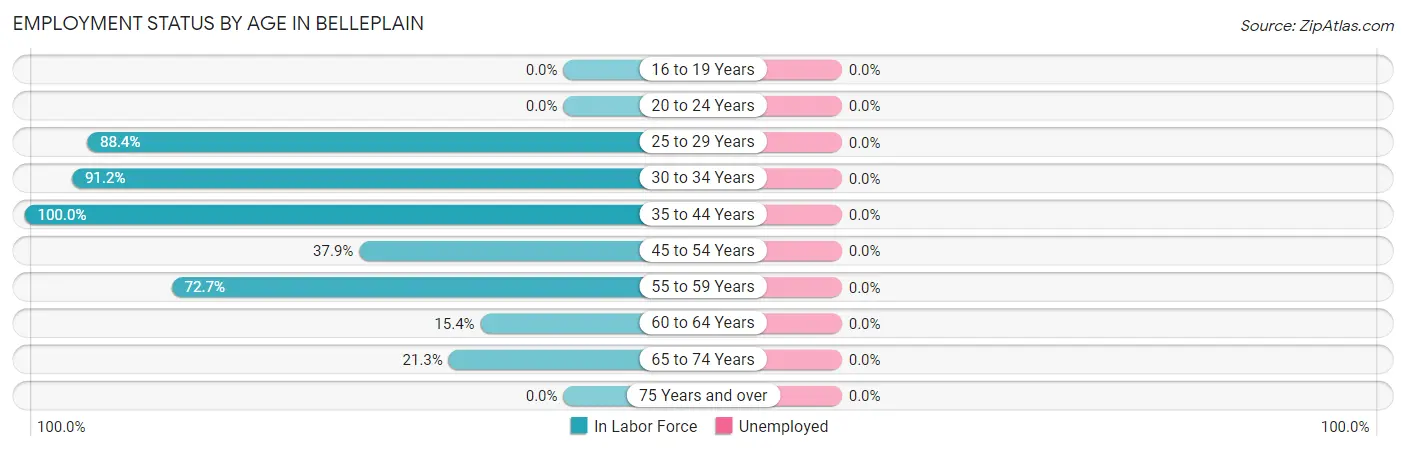
| Age Bracket | In Labor Force | Unemployed |
| 16 to 19 Years | 0 (0.0%) | 0 (0.0%) |
| 20 to 24 Years | 0 (0.0%) | 0 (0.0%) |
| 25 to 29 Years | 38 (88.4%) | 0 (0.0%) |
| 30 to 34 Years | 31 (91.2%) | 0 (0.0%) |
| 35 to 44 Years | 34 (100.0%) | 0 (0.0%) |
| 45 to 54 Years | 11 (37.9%) | 0 (0.0%) |
| 55 to 59 Years | 32 (72.7%) | 0 (0.0%) |
| 60 to 64 Years | 6 (15.4%) | 0 (0.0%) |
| 65 to 74 Years | 20 (21.3%) | 0 (0.0%) |
| 75 Years and over | 0 (0.0%) | 0 (0.0%) |
| Total | 172 (47.4%) | 0 (0.0%) |
Employment Status by Educational Attainment in Belleplain
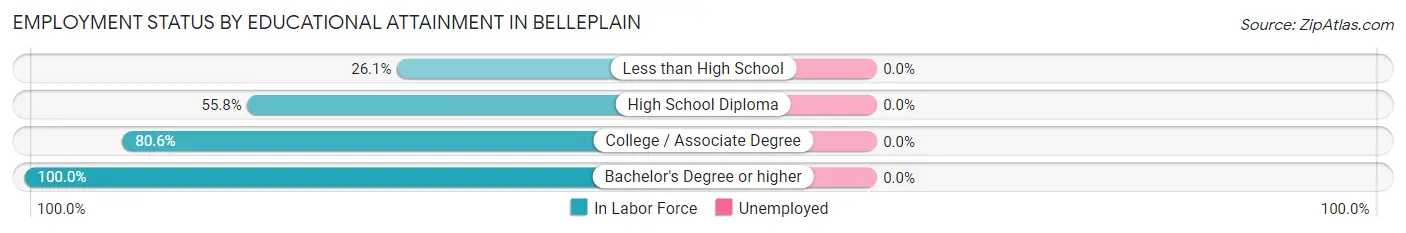
| Educational Attainment | In Labor Force | Unemployed |
| Less than High School | 6 (26.1%) | 0 (0.0%) |
| High School Diploma | 43 (55.8%) | 0 (0.0%) |
| College / Associate Degree | 83 (80.6%) | 0 (0.0%) |
| Bachelor's Degree or higher | 20 (100.0%) | 0 (0.0%) |
| Total | 152 (68.2%) | 0 (0.0%) |
Employment Occupations by Sex in Belleplain
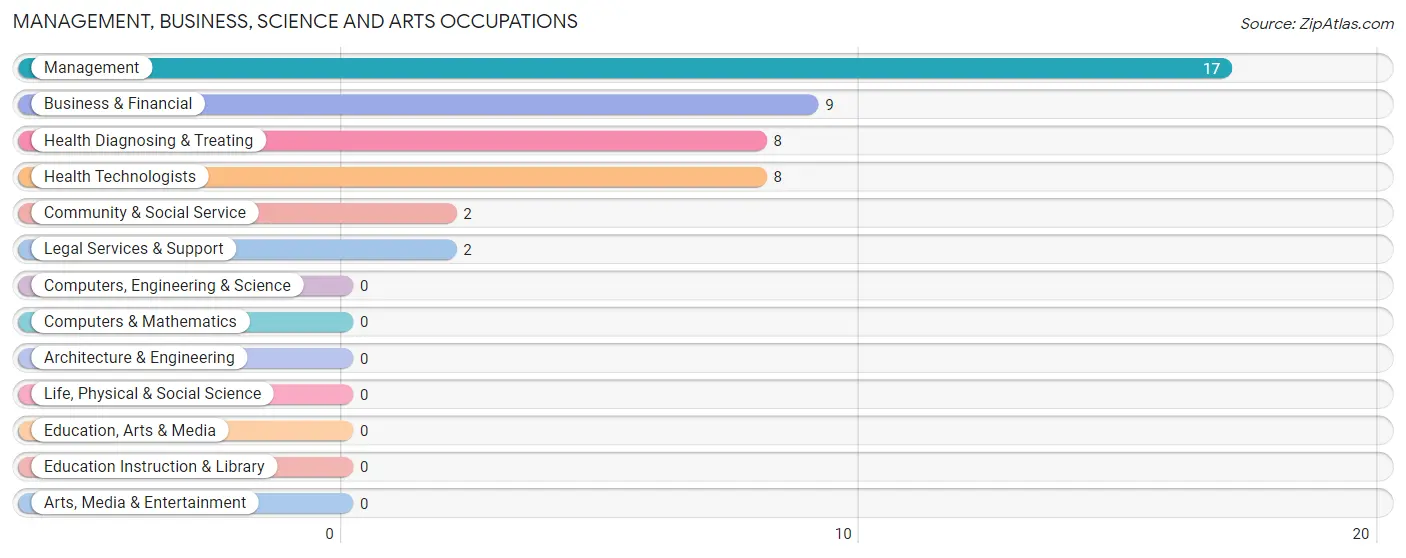
Management, Business, Science and Arts Occupations
The most common Management, Business, Science and Arts occupations in Belleplain are Management (17 | 9.9%), Business & Financial (9 | 5.2%), Health Diagnosing & Treating (8 | 4.6%), Health Technologists (8 | 4.6%), and Community & Social Service (2 | 1.2%).
Management, Business, Science and Arts Occupations by Sex
Within the Management, Business, Science and Arts occupations in Belleplain, the most male-oriented occupations are Management (64.7%), and Business & Financial (33.3%), while the most female-oriented occupations are Community & Social Service (100.0%), Legal Services & Support (100.0%), and Health Diagnosing & Treating (100.0%).
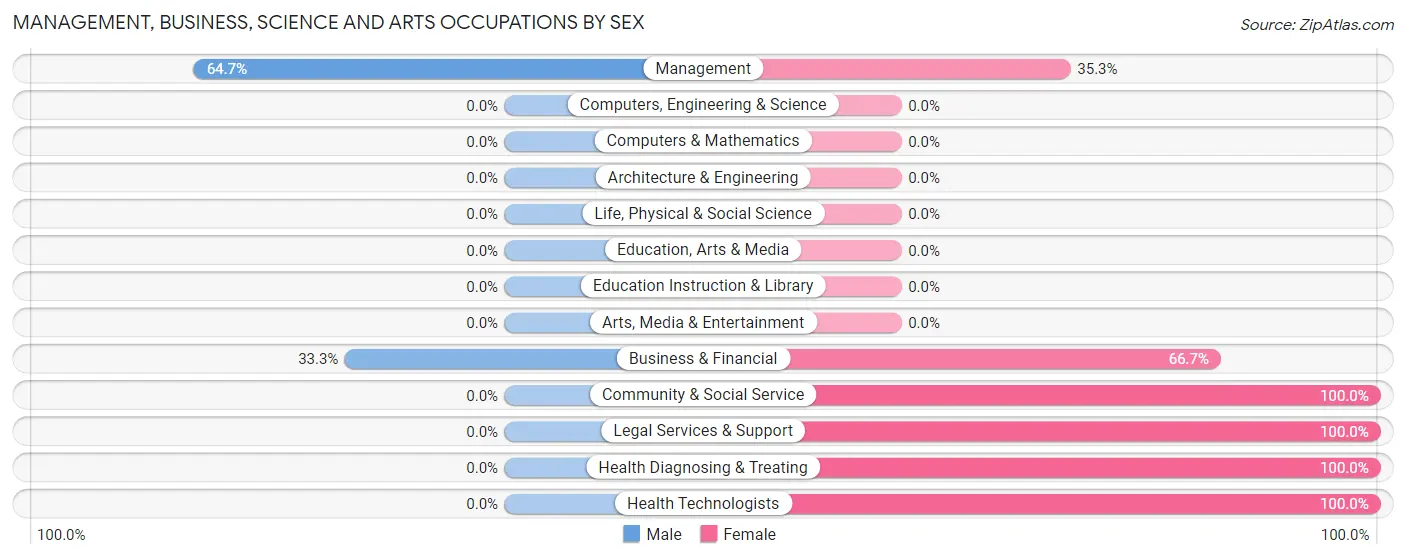
| Occupation | Male | Female |
| Management | 11 (64.7%) | 6 (35.3%) |
| Business & Financial | 3 (33.3%) | 6 (66.7%) |
| Computers, Engineering & Science | 0 (0.0%) | 0 (0.0%) |
| Computers & Mathematics | 0 (0.0%) | 0 (0.0%) |
| Architecture & Engineering | 0 (0.0%) | 0 (0.0%) |
| Life, Physical & Social Science | 0 (0.0%) | 0 (0.0%) |
| Community & Social Service | 0 (0.0%) | 2 (100.0%) |
| Education, Arts & Media | 0 (0.0%) | 0 (0.0%) |
| Legal Services & Support | 0 (0.0%) | 2 (100.0%) |
| Education Instruction & Library | 0 (0.0%) | 0 (0.0%) |
| Arts, Media & Entertainment | 0 (0.0%) | 0 (0.0%) |
| Health Diagnosing & Treating | 0 (0.0%) | 8 (100.0%) |
| Health Technologists | 0 (0.0%) | 8 (100.0%) |
| Total (Category) | 14 (38.9%) | 22 (61.1%) |
| Total (Overall) | 102 (59.3%) | 70 (40.7%) |
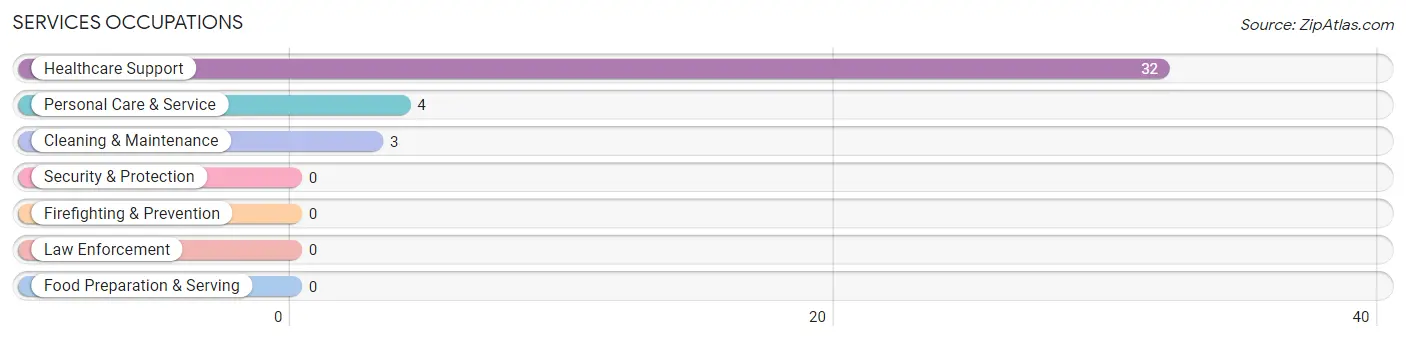
Services Occupations
The most common Services occupations in Belleplain are Healthcare Support (32 | 18.6%), Personal Care & Service (4 | 2.3%), and Cleaning & Maintenance (3 | 1.7%).
Services Occupations by Sex
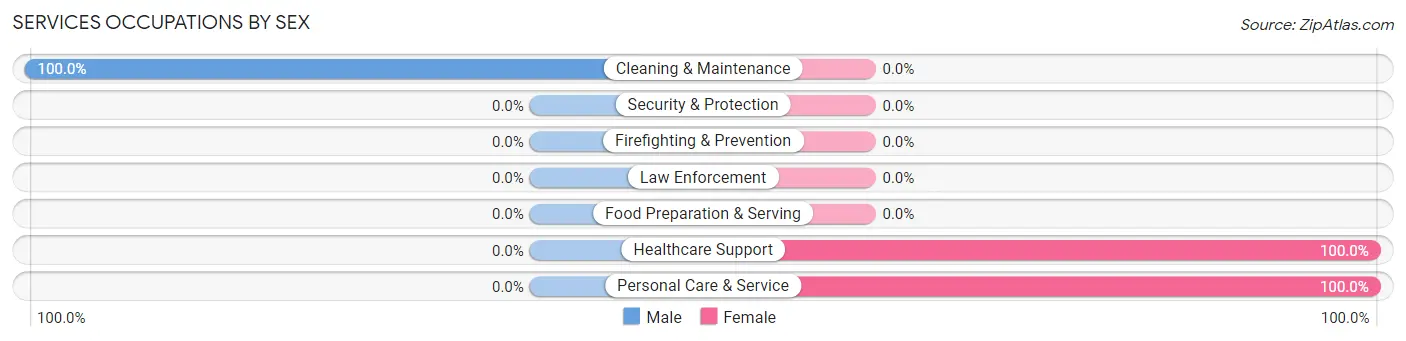
| Occupation | Male | Female |
| Healthcare Support | 0 (0.0%) | 32 (100.0%) |
| Security & Protection | 0 (0.0%) | 0 (0.0%) |
| Firefighting & Prevention | 0 (0.0%) | 0 (0.0%) |
| Law Enforcement | 0 (0.0%) | 0 (0.0%) |
| Food Preparation & Serving | 0 (0.0%) | 0 (0.0%) |
| Cleaning & Maintenance | 3 (100.0%) | 0 (0.0%) |
| Personal Care & Service | 0 (0.0%) | 4 (100.0%) |
| Total (Category) | 3 (7.7%) | 36 (92.3%) |
| Total (Overall) | 102 (59.3%) | 70 (40.7%) |
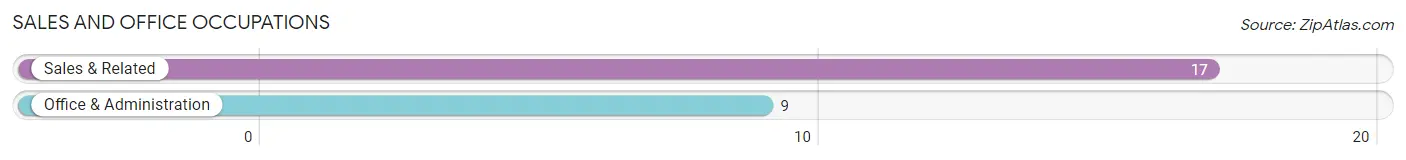
Sales and Office Occupations
The most common Sales and Office occupations in Belleplain are Sales & Related (17 | 9.9%), and Office & Administration (9 | 5.2%).
Sales and Office Occupations by Sex
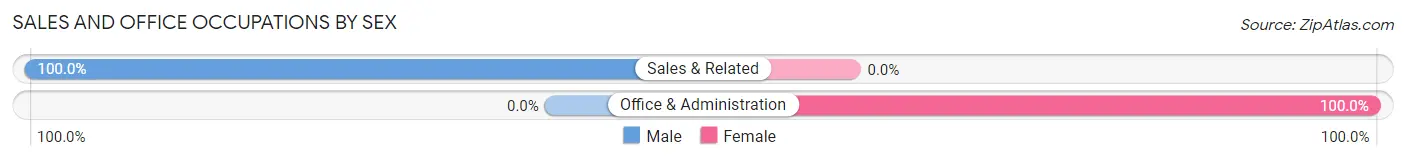
| Occupation | Male | Female |
| Sales & Related | 17 (100.0%) | 0 (0.0%) |
| Office & Administration | 0 (0.0%) | 9 (100.0%) |
| Total (Category) | 17 (65.4%) | 9 (34.6%) |
| Total (Overall) | 102 (59.3%) | 70 (40.7%) |
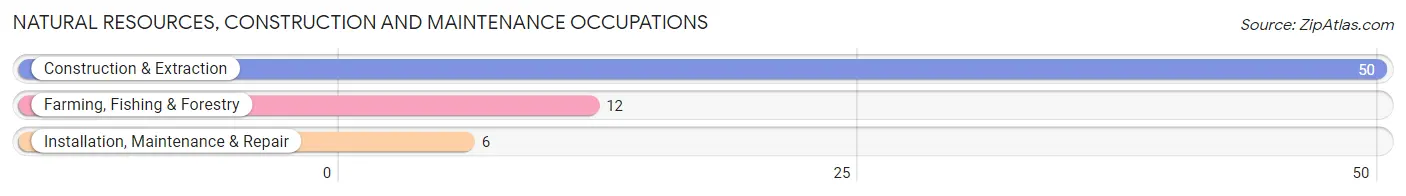
Natural Resources, Construction and Maintenance Occupations
The most common Natural Resources, Construction and Maintenance occupations in Belleplain are Construction & Extraction (50 | 29.1%), Farming, Fishing & Forestry (12 | 7.0%), and Installation, Maintenance & Repair (6 | 3.5%).
Natural Resources, Construction and Maintenance Occupations by Sex
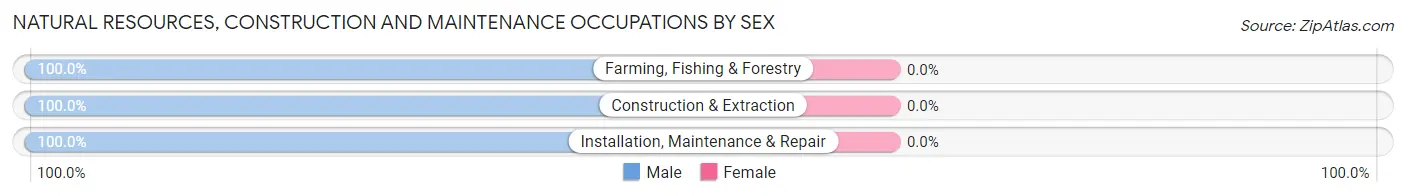
| Occupation | Male | Female |
| Farming, Fishing & Forestry | 12 (100.0%) | 0 (0.0%) |
| Construction & Extraction | 50 (100.0%) | 0 (0.0%) |
| Installation, Maintenance & Repair | 6 (100.0%) | 0 (0.0%) |
| Total (Category) | 68 (100.0%) | 0 (0.0%) |
| Total (Overall) | 102 (59.3%) | 70 (40.7%) |
Production, Transportation and Moving Occupations
The most common Production, Transportation and Moving occupations in Belleplain are , and Material Moving (3 | 1.7%).
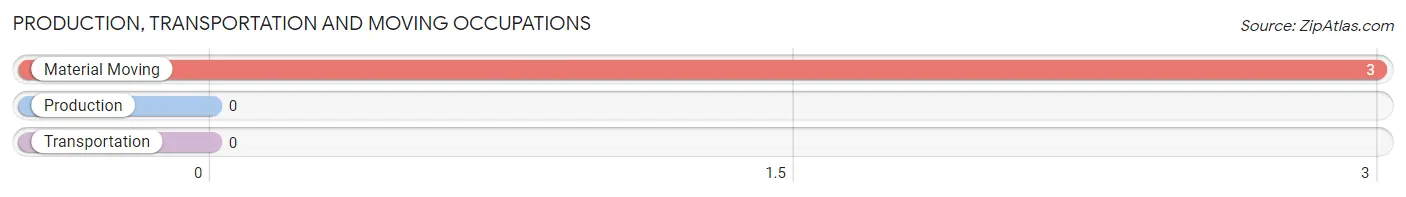
Production, Transportation and Moving Occupations by Sex
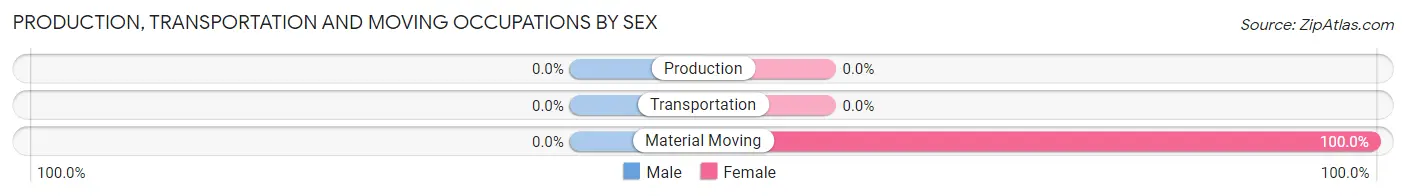
| Occupation | Male | Female |
| Production | 0 (0.0%) | 0 (0.0%) |
| Transportation | 0 (0.0%) | 0 (0.0%) |
| Material Moving | 0 (0.0%) | 3 (100.0%) |
| Total (Category) | 0 (0.0%) | 3 (100.0%) |
| Total (Overall) | 102 (59.3%) | 70 (40.7%) |
Employment Industries by Sex in Belleplain
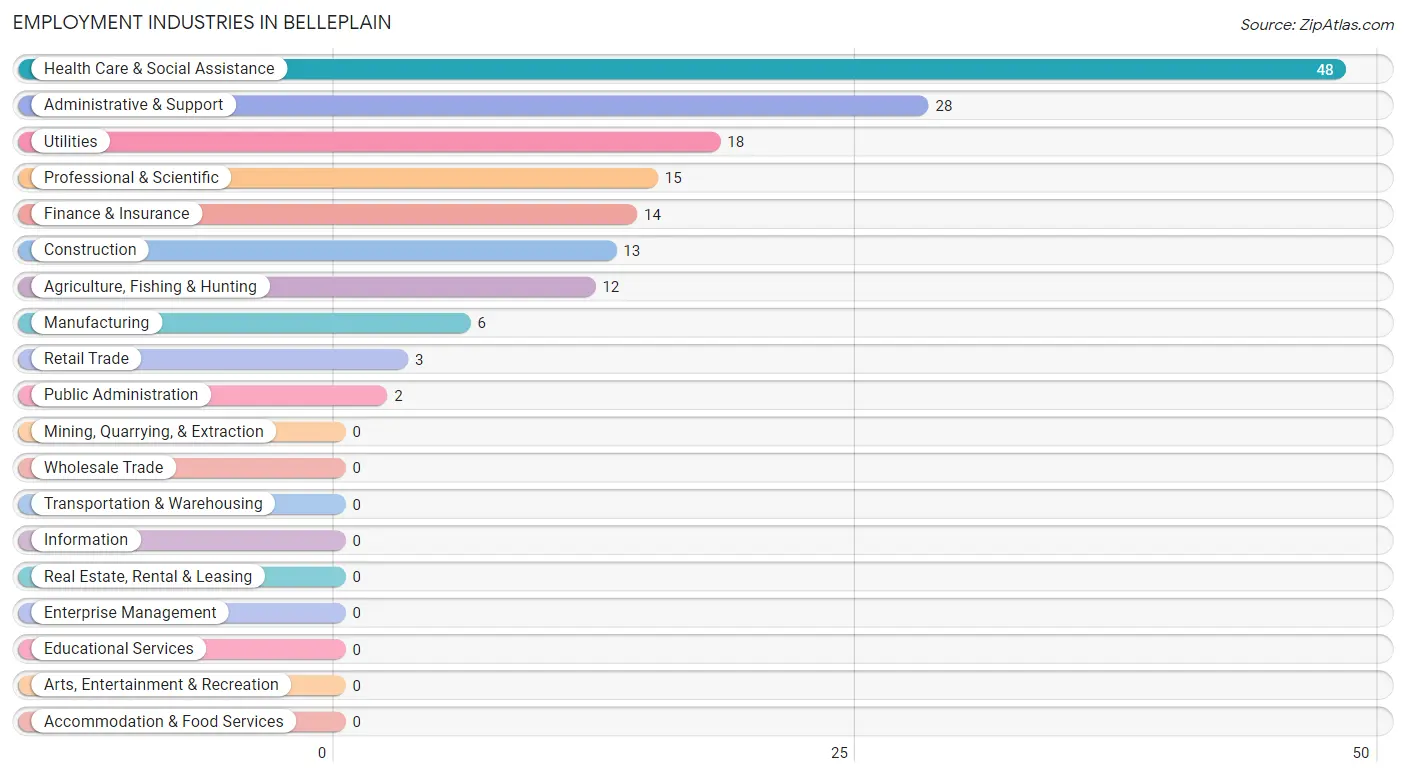
Employment Industries in Belleplain
The major employment industries in Belleplain include Health Care & Social Assistance (48 | 27.9%), Administrative & Support (28 | 16.3%), Utilities (18 | 10.5%), Professional & Scientific (15 | 8.7%), and Finance & Insurance (14 | 8.1%).
Employment Industries by Sex in Belleplain
The Belleplain industries that see more men than women are Agriculture, Fishing & Hunting (100.0%), Utilities (100.0%), and Administrative & Support (100.0%), whereas the industries that tend to have a higher number of women are Retail Trade (100.0%), Public Administration (100.0%), and Health Care & Social Assistance (83.3%).
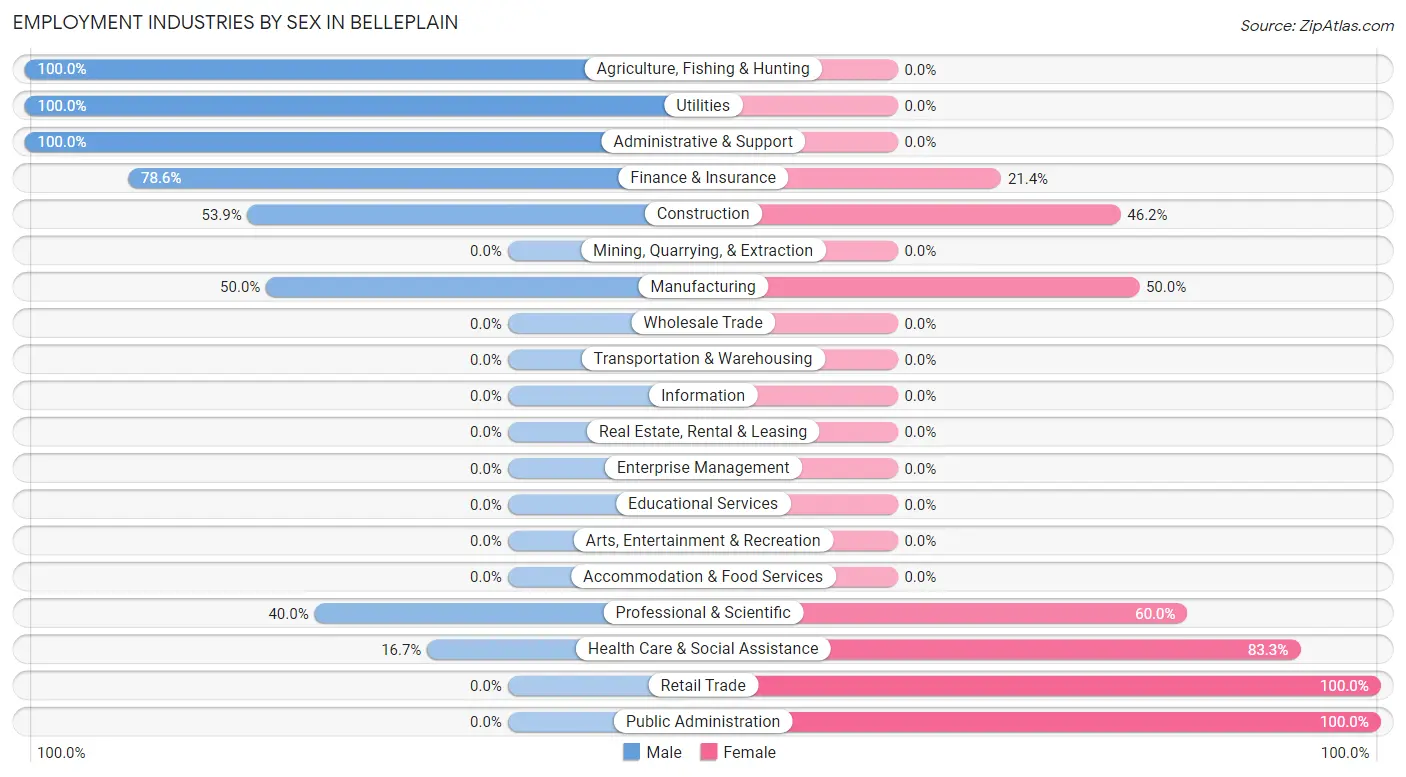
| Industry | Male | Female |
| Agriculture, Fishing & Hunting | 12 (100.0%) | 0 (0.0%) |
| Mining, Quarrying, & Extraction | 0 (0.0%) | 0 (0.0%) |
| Construction | 7 (53.8%) | 6 (46.2%) |
| Manufacturing | 3 (50.0%) | 3 (50.0%) |
| Wholesale Trade | 0 (0.0%) | 0 (0.0%) |
| Retail Trade | 0 (0.0%) | 3 (100.0%) |
| Transportation & Warehousing | 0 (0.0%) | 0 (0.0%) |
| Utilities | 18 (100.0%) | 0 (0.0%) |
| Information | 0 (0.0%) | 0 (0.0%) |
| Finance & Insurance | 11 (78.6%) | 3 (21.4%) |
| Real Estate, Rental & Leasing | 0 (0.0%) | 0 (0.0%) |
| Professional & Scientific | 6 (40.0%) | 9 (60.0%) |
| Enterprise Management | 0 (0.0%) | 0 (0.0%) |
| Administrative & Support | 28 (100.0%) | 0 (0.0%) |
| Educational Services | 0 (0.0%) | 0 (0.0%) |
| Health Care & Social Assistance | 8 (16.7%) | 40 (83.3%) |
| Arts, Entertainment & Recreation | 0 (0.0%) | 0 (0.0%) |
| Accommodation & Food Services | 0 (0.0%) | 0 (0.0%) |
| Public Administration | 0 (0.0%) | 2 (100.0%) |
| Total | 102 (59.3%) | 70 (40.7%) |
Education in Belleplain
School Enrollment in Belleplain
The most common levels of schooling among the 38 students in Belleplain are nursery / preschool (29 | 76.3%), and middle school (9 | 23.7%).
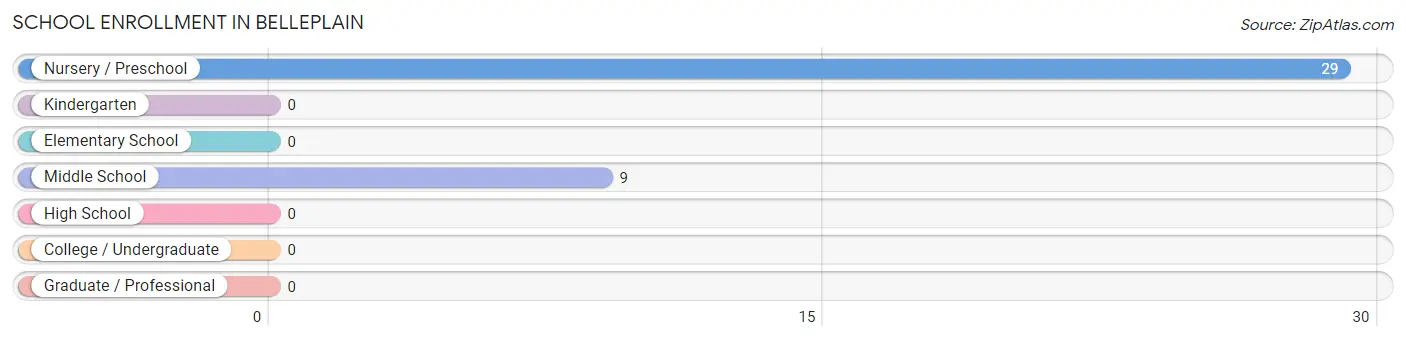
| School Level | # Students | % Students |
| Nursery / Preschool | 29 | 76.3% |
| Kindergarten | 0 | 0.0% |
| Elementary School | 0 | 0.0% |
| Middle School | 9 | 23.7% |
| High School | 0 | 0.0% |
| College / Undergraduate | 0 | 0.0% |
| Graduate / Professional | 0 | 0.0% |
| Total | 38 | 100.0% |
School Enrollment by Age by Funding Source in Belleplain
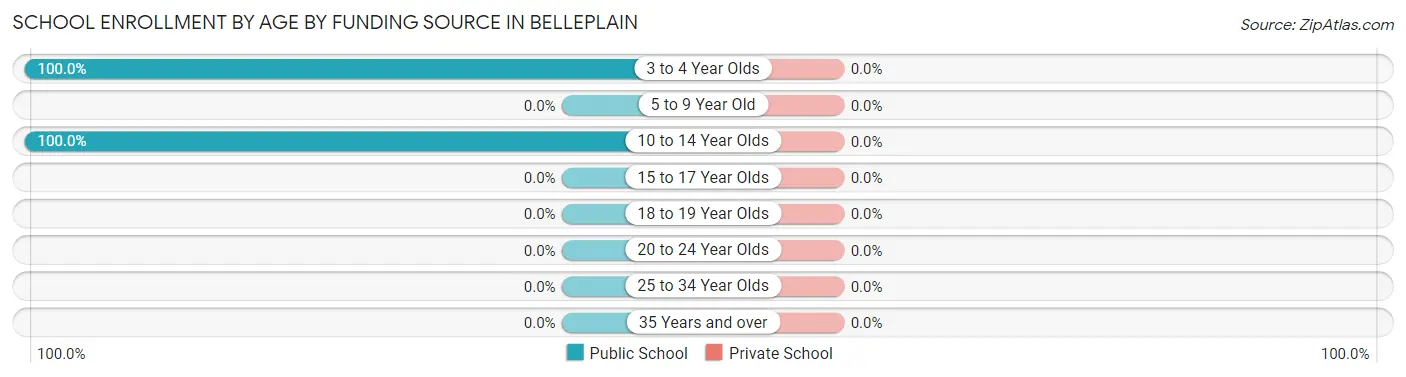
| Age Bracket | Public School | Private School |
| 3 to 4 Year Olds | 29 (100.0%) | 0 (0.0%) |
| 5 to 9 Year Old | 0 (0.0%) | 0 (0.0%) |
| 10 to 14 Year Olds | 9 (100.0%) | 0 (0.0%) |
| 15 to 17 Year Olds | 0 (0.0%) | 0 (0.0%) |
| 18 to 19 Year Olds | 0 (0.0%) | 0 (0.0%) |
| 20 to 24 Year Olds | 0 (0.0%) | 0 (0.0%) |
| 25 to 34 Year Olds | 0 (0.0%) | 0 (0.0%) |
| 35 Years and over | 0 (0.0%) | 0 (0.0%) |
| Total | 38 (100.0%) | 0 (0.0%) |
Educational Attainment by Field of Study in Belleplain
Education (16 | 50.0%), business (6 | 18.8%), arts & humanities (4 | 12.5%), social sciences (3 | 9.4%), and communications (3 | 9.4%) are the most common fields of study among 32 individuals in Belleplain who have obtained a bachelor's degree or higher.
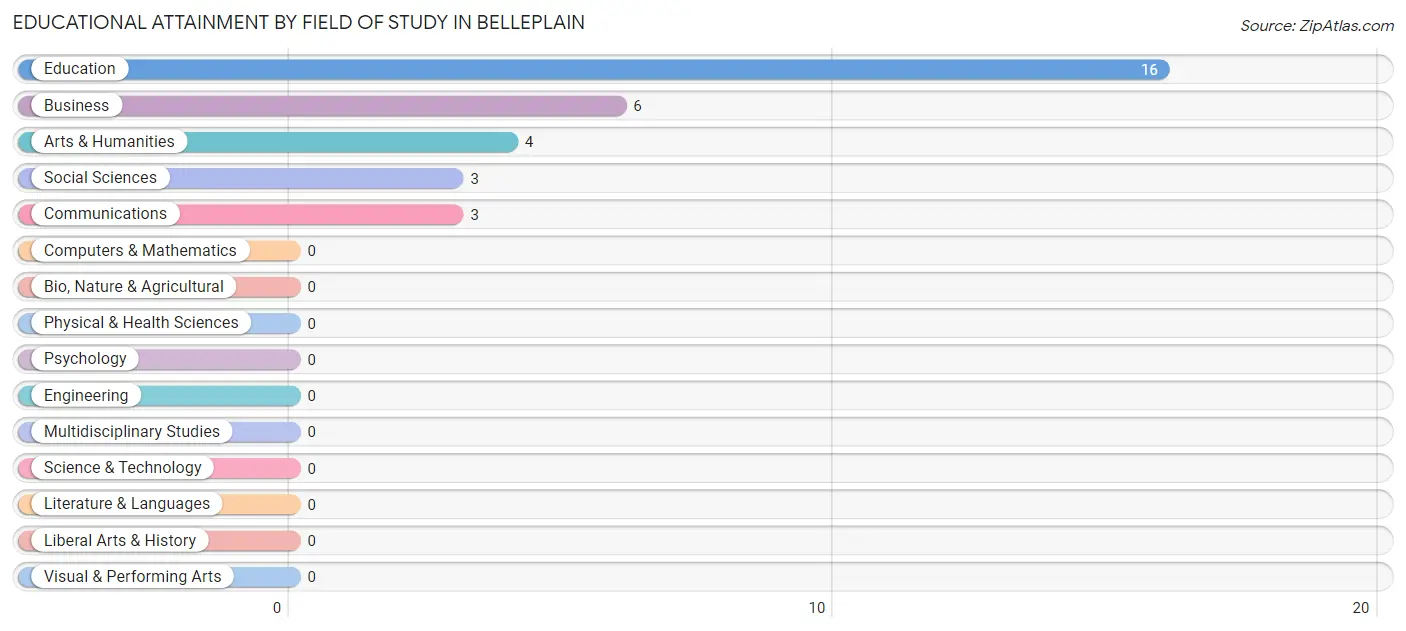
| Field of Study | # Graduates | % Graduates |
| Computers & Mathematics | 0 | 0.0% |
| Bio, Nature & Agricultural | 0 | 0.0% |
| Physical & Health Sciences | 0 | 0.0% |
| Psychology | 0 | 0.0% |
| Social Sciences | 3 | 9.4% |
| Engineering | 0 | 0.0% |
| Multidisciplinary Studies | 0 | 0.0% |
| Science & Technology | 0 | 0.0% |
| Business | 6 | 18.8% |
| Education | 16 | 50.0% |
| Literature & Languages | 0 | 0.0% |
| Liberal Arts & History | 0 | 0.0% |
| Visual & Performing Arts | 0 | 0.0% |
| Communications | 3 | 9.4% |
| Arts & Humanities | 4 | 12.5% |
| Total | 32 | 100.0% |
Transportation & Commute in Belleplain
Vehicle Availability by Sex in Belleplain
The most prevalent vehicle ownership categories in Belleplain are males with 2 vehicles (49, accounting for 48.0%) and females with 2 vehicles (47, making up 70.0%).
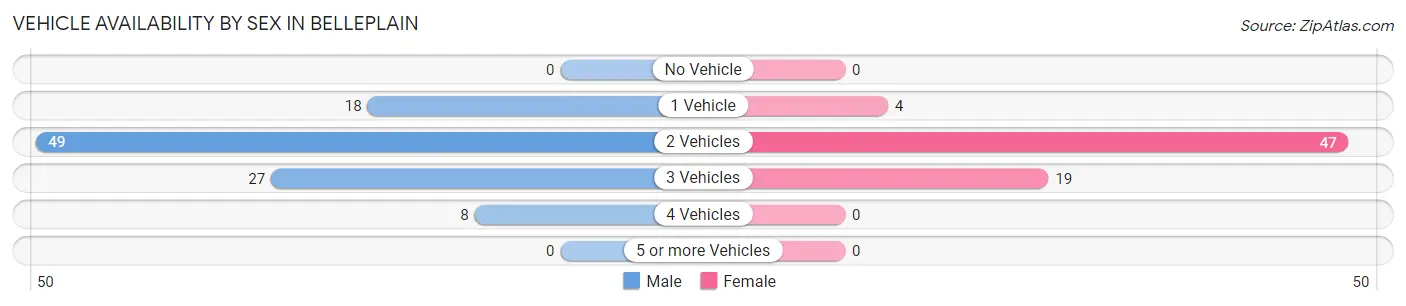
| Vehicles Available | Male | Female |
| No Vehicle | 0 (0.0%) | 0 (0.0%) |
| 1 Vehicle | 18 (17.6%) | 4 (5.7%) |
| 2 Vehicles | 49 (48.0%) | 47 (67.1%) |
| 3 Vehicles | 27 (26.5%) | 19 (27.1%) |
| 4 Vehicles | 8 (7.8%) | 0 (0.0%) |
| 5 or more Vehicles | 0 (0.0%) | 0 (0.0%) |
| Total | 102 (100.0%) | 70 (100.0%) |
Commute Time in Belleplain
The most frequently occuring commute durations in Belleplain are 25 to 29 minutes (57 commuters, 33.1%), 5 to 9 minutes (34 commuters, 19.8%), and 10 to 14 minutes (25 commuters, 14.5%).
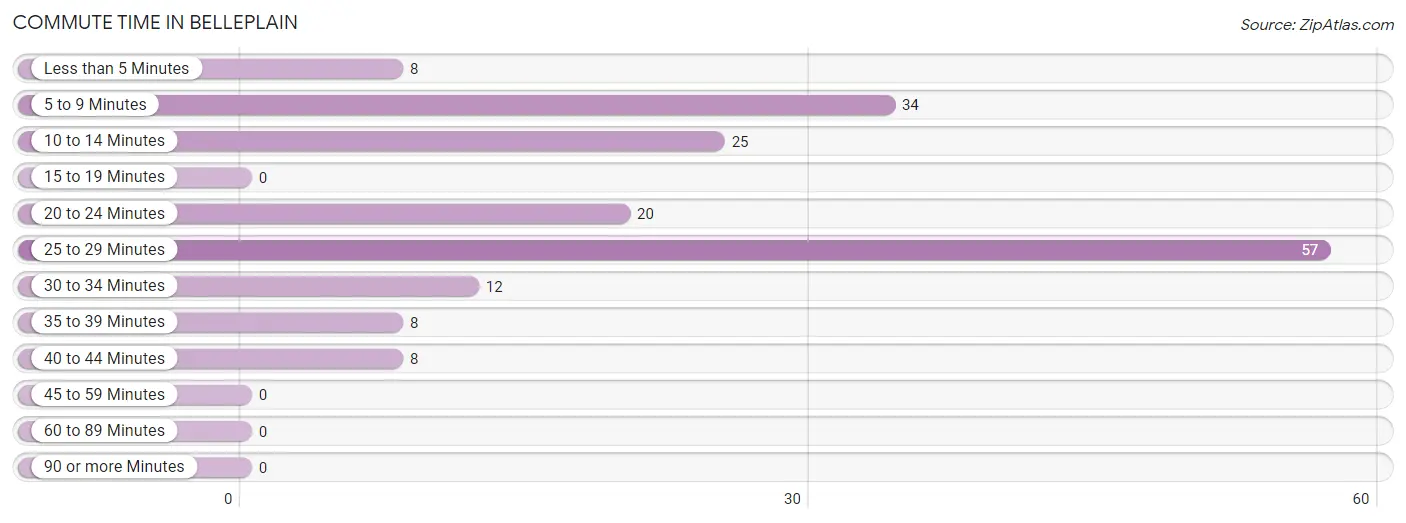
| Commute Time | # Commuters | % Commuters |
| Less than 5 Minutes | 8 | 4.6% |
| 5 to 9 Minutes | 34 | 19.8% |
| 10 to 14 Minutes | 25 | 14.5% |
| 15 to 19 Minutes | 0 | 0.0% |
| 20 to 24 Minutes | 20 | 11.6% |
| 25 to 29 Minutes | 57 | 33.1% |
| 30 to 34 Minutes | 12 | 7.0% |
| 35 to 39 Minutes | 8 | 4.6% |
| 40 to 44 Minutes | 8 | 4.6% |
| 45 to 59 Minutes | 0 | 0.0% |
| 60 to 89 Minutes | 0 | 0.0% |
| 90 or more Minutes | 0 | 0.0% |
Commute Time by Sex in Belleplain
The most common commute times in Belleplain are 5 to 9 minutes (28 commuters, 27.5%) for males and 25 to 29 minutes (39 commuters, 55.7%) for females.
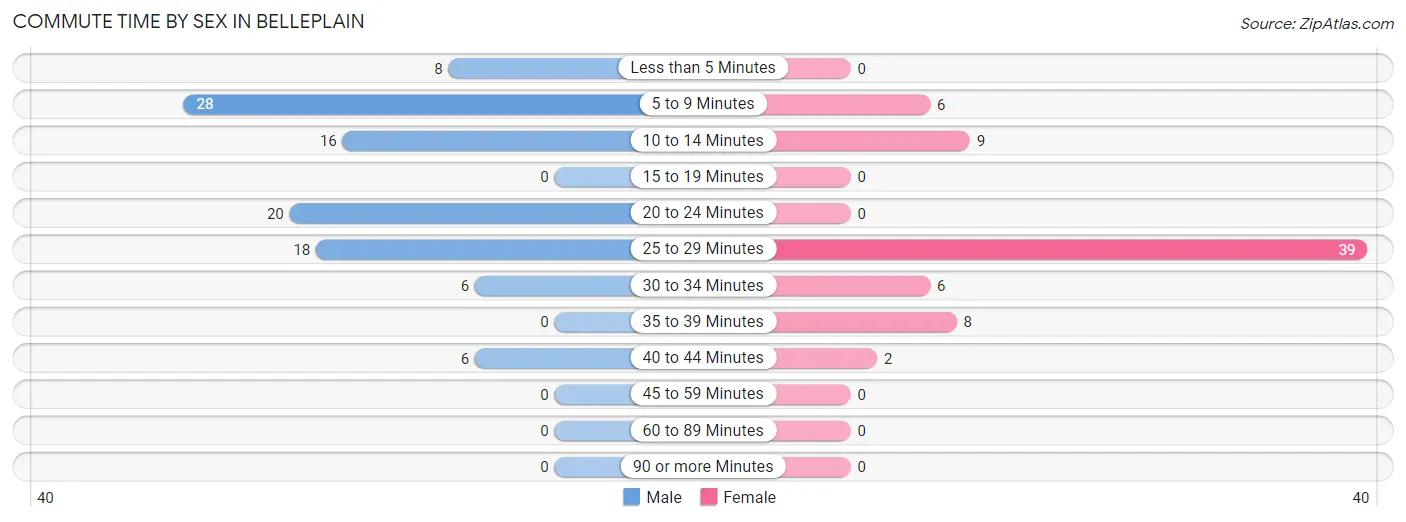
| Commute Time | Male | Female |
| Less than 5 Minutes | 8 (7.8%) | 0 (0.0%) |
| 5 to 9 Minutes | 28 (27.5%) | 6 (8.6%) |
| 10 to 14 Minutes | 16 (15.7%) | 9 (12.9%) |
| 15 to 19 Minutes | 0 (0.0%) | 0 (0.0%) |
| 20 to 24 Minutes | 20 (19.6%) | 0 (0.0%) |
| 25 to 29 Minutes | 18 (17.6%) | 39 (55.7%) |
| 30 to 34 Minutes | 6 (5.9%) | 6 (8.6%) |
| 35 to 39 Minutes | 0 (0.0%) | 8 (11.4%) |
| 40 to 44 Minutes | 6 (5.9%) | 2 (2.9%) |
| 45 to 59 Minutes | 0 (0.0%) | 0 (0.0%) |
| 60 to 89 Minutes | 0 (0.0%) | 0 (0.0%) |
| 90 or more Minutes | 0 (0.0%) | 0 (0.0%) |
Time of Departure to Work by Sex in Belleplain
The most frequent times of departure to work in Belleplain are 4:00 PM to 11:59 PM (25, 24.5%) for males and 6:00 AM to 6:29 AM (32, 45.7%) for females.
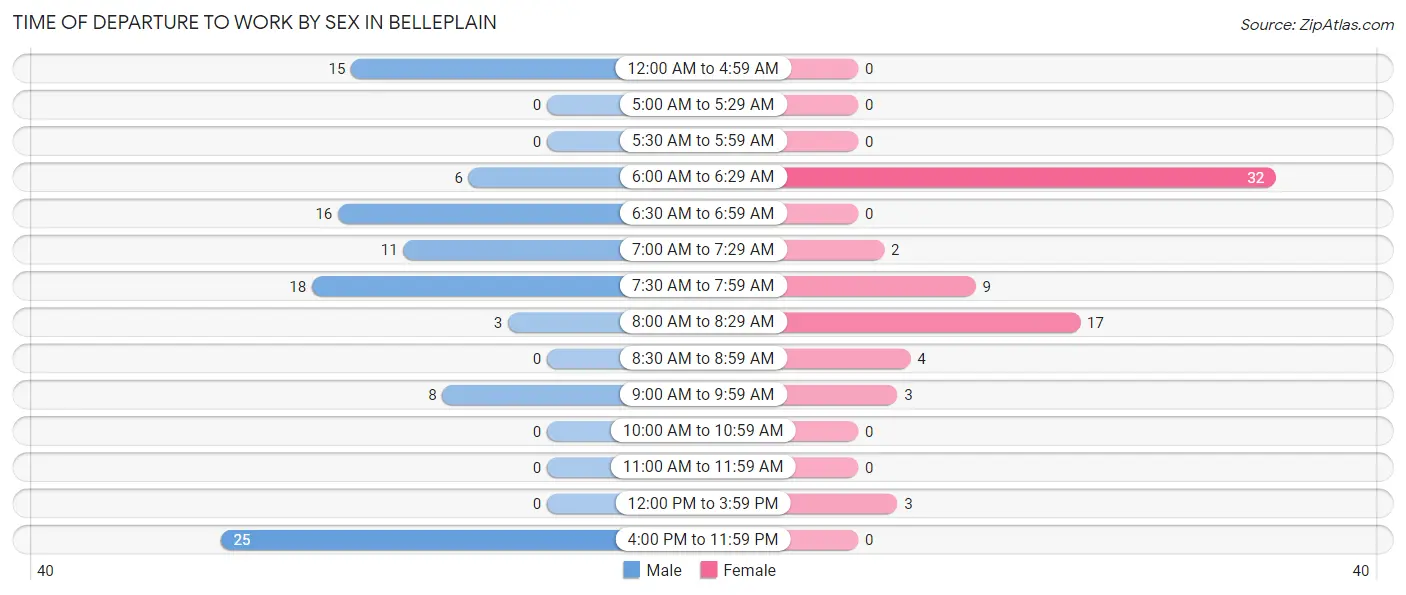
| Time of Departure | Male | Female |
| 12:00 AM to 4:59 AM | 15 (14.7%) | 0 (0.0%) |
| 5:00 AM to 5:29 AM | 0 (0.0%) | 0 (0.0%) |
| 5:30 AM to 5:59 AM | 0 (0.0%) | 0 (0.0%) |
| 6:00 AM to 6:29 AM | 6 (5.9%) | 32 (45.7%) |
| 6:30 AM to 6:59 AM | 16 (15.7%) | 0 (0.0%) |
| 7:00 AM to 7:29 AM | 11 (10.8%) | 2 (2.9%) |
| 7:30 AM to 7:59 AM | 18 (17.6%) | 9 (12.9%) |
| 8:00 AM to 8:29 AM | 3 (2.9%) | 17 (24.3%) |
| 8:30 AM to 8:59 AM | 0 (0.0%) | 4 (5.7%) |
| 9:00 AM to 9:59 AM | 8 (7.8%) | 3 (4.3%) |
| 10:00 AM to 10:59 AM | 0 (0.0%) | 0 (0.0%) |
| 11:00 AM to 11:59 AM | 0 (0.0%) | 0 (0.0%) |
| 12:00 PM to 3:59 PM | 0 (0.0%) | 3 (4.3%) |
| 4:00 PM to 11:59 PM | 25 (24.5%) | 0 (0.0%) |
| Total | 102 (100.0%) | 70 (100.0%) |
Housing Occupancy in Belleplain
Occupancy by Ownership in Belleplain
Of the total 215 dwellings in Belleplain, owner-occupied units account for 183 (85.1%), while renter-occupied units make up 32 (14.9%).
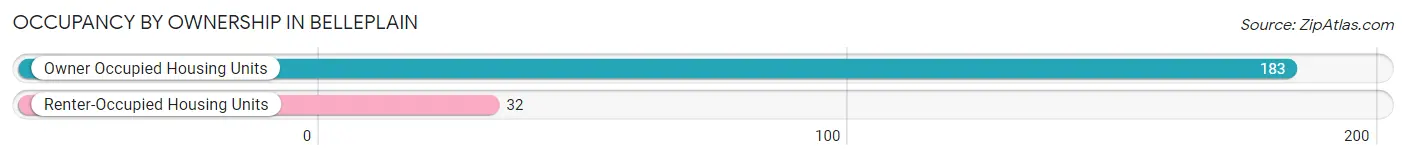
| Occupancy | # Housing Units | % Housing Units |
| Owner Occupied Housing Units | 183 | 85.1% |
| Renter-Occupied Housing Units | 32 | 14.9% |
| Total Occupied Housing Units | 215 | 100.0% |
Occupancy by Household Size in Belleplain
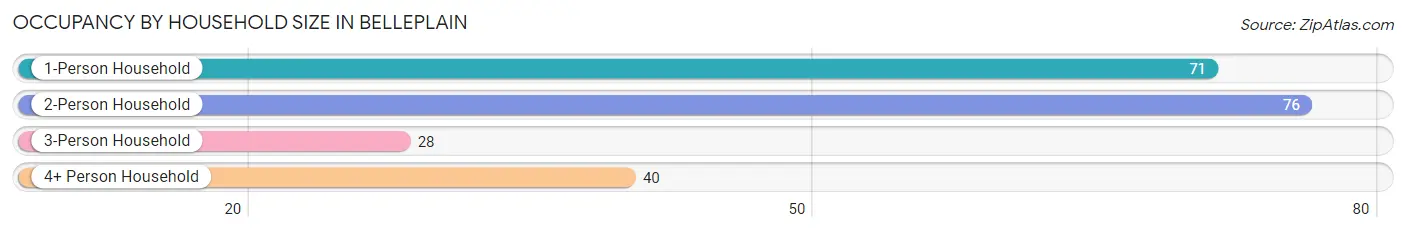
| Household Size | # Housing Units | % Housing Units |
| 1-Person Household | 71 | 33.0% |
| 2-Person Household | 76 | 35.3% |
| 3-Person Household | 28 | 13.0% |
| 4+ Person Household | 40 | 18.6% |
| Total Housing Units | 215 | 100.0% |
Occupancy by Ownership by Household Size in Belleplain
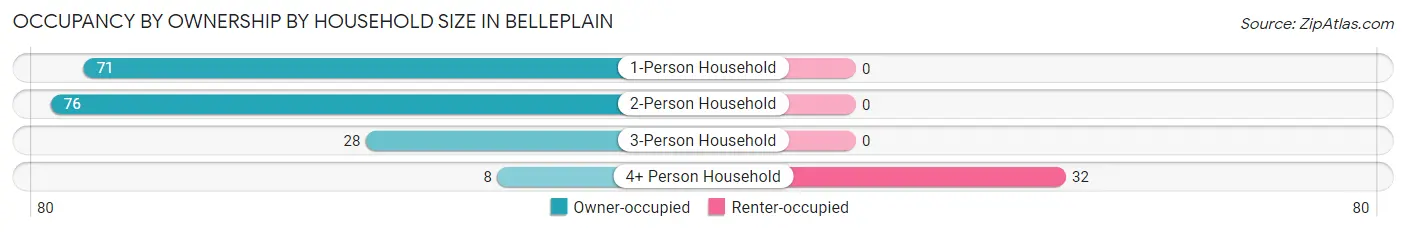
| Household Size | Owner-occupied | Renter-occupied |
| 1-Person Household | 71 (100.0%) | 0 (0.0%) |
| 2-Person Household | 76 (100.0%) | 0 (0.0%) |
| 3-Person Household | 28 (100.0%) | 0 (0.0%) |
| 4+ Person Household | 8 (20.0%) | 32 (80.0%) |
| Total Housing Units | 183 (85.1%) | 32 (14.9%) |
Occupancy by Educational Attainment in Belleplain
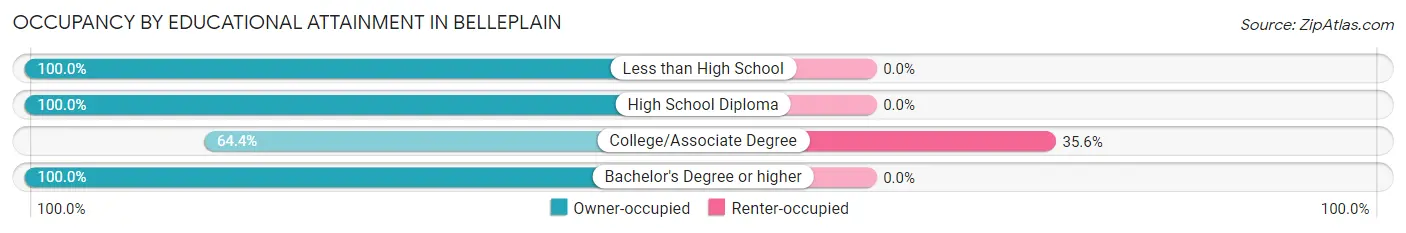
| Household Size | Owner-occupied | Renter-occupied |
| Less than High School | 16 (100.0%) | 0 (0.0%) |
| High School Diploma | 95 (100.0%) | 0 (0.0%) |
| College/Associate Degree | 58 (64.4%) | 32 (35.6%) |
| Bachelor's Degree or higher | 14 (100.0%) | 0 (0.0%) |
Occupancy by Age of Householder in Belleplain
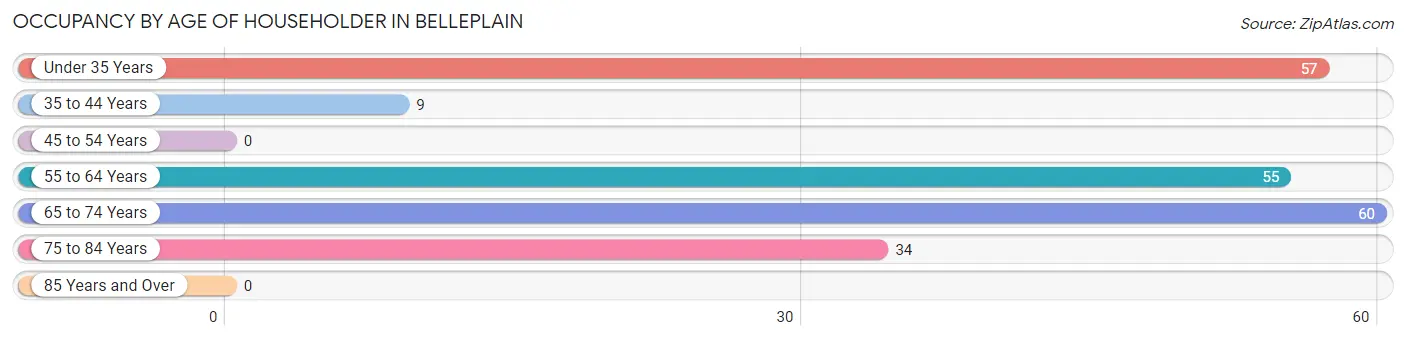
| Age Bracket | # Households | % Households |
| Under 35 Years | 57 | 26.5% |
| 35 to 44 Years | 9 | 4.2% |
| 45 to 54 Years | 0 | 0.0% |
| 55 to 64 Years | 55 | 25.6% |
| 65 to 74 Years | 60 | 27.9% |
| 75 to 84 Years | 34 | 15.8% |
| 85 Years and Over | 0 | 0.0% |
| Total | 215 | 100.0% |
Housing Finances in Belleplain
Median Income by Occupancy in Belleplain
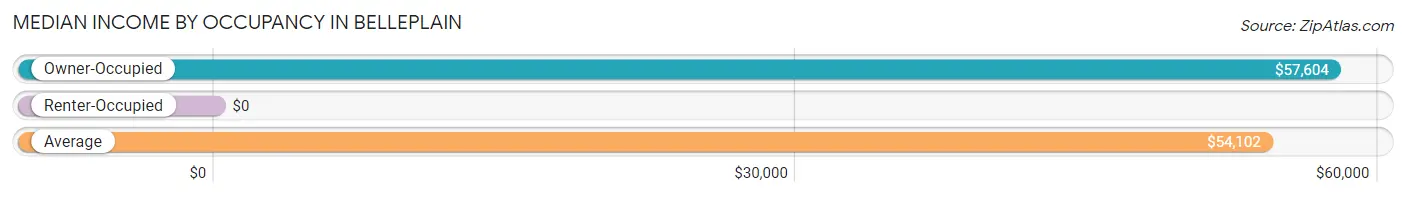
| Occupancy Type | # Households | Median Income |
| Owner-Occupied | 183 (85.1%) | $57,604 |
| Renter-Occupied | 32 (14.9%) | $0 |
| Average | 215 (100.0%) | $54,102 |
Occupancy by Householder Income Bracket in Belleplain
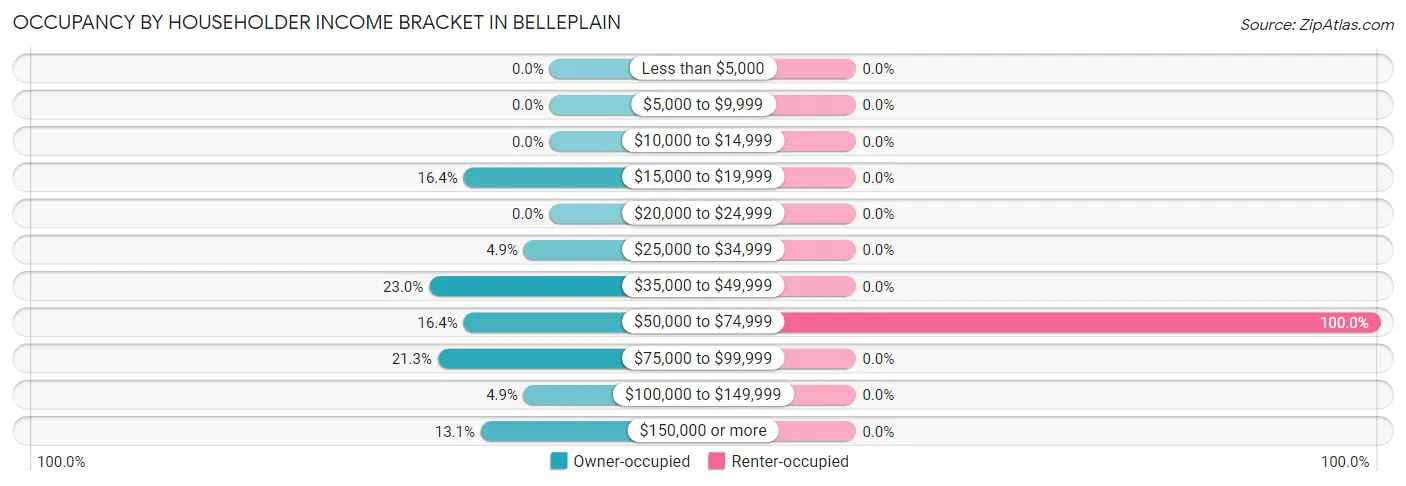
| Income Bracket | Owner-occupied | Renter-occupied |
| Less than $5,000 | 0 (0.0%) | 0 (0.0%) |
| $5,000 to $9,999 | 0 (0.0%) | 0 (0.0%) |
| $10,000 to $14,999 | 0 (0.0%) | 0 (0.0%) |
| $15,000 to $19,999 | 30 (16.4%) | 0 (0.0%) |
| $20,000 to $24,999 | 0 (0.0%) | 0 (0.0%) |
| $25,000 to $34,999 | 9 (4.9%) | 0 (0.0%) |
| $35,000 to $49,999 | 42 (23.0%) | 0 (0.0%) |
| $50,000 to $74,999 | 30 (16.4%) | 32 (100.0%) |
| $75,000 to $99,999 | 39 (21.3%) | 0 (0.0%) |
| $100,000 to $149,999 | 9 (4.9%) | 0 (0.0%) |
| $150,000 or more | 24 (13.1%) | 0 (0.0%) |
| Total | 183 (100.0%) | 32 (100.0%) |
Monthly Housing Cost Tiers in Belleplain
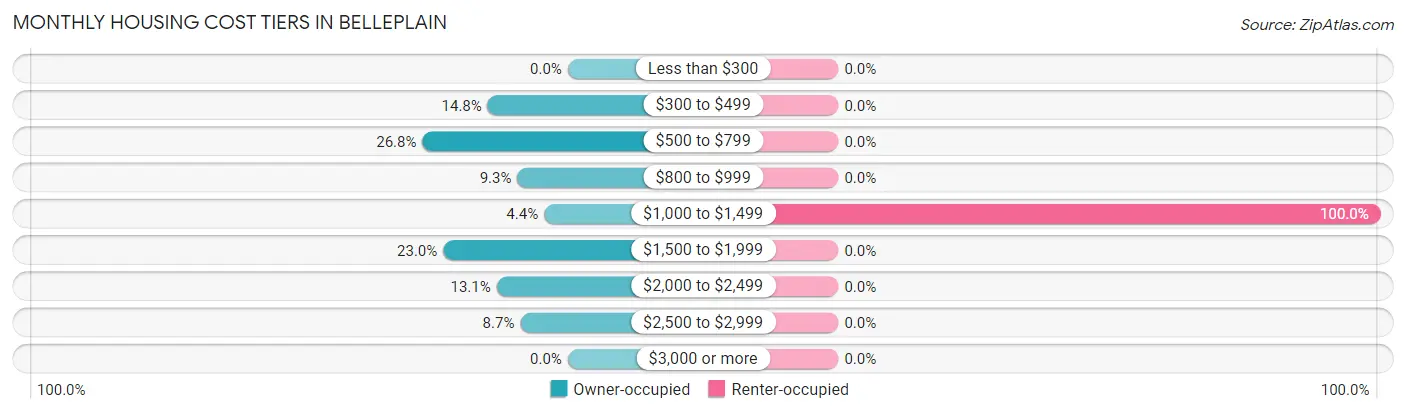
| Monthly Cost | Owner-occupied | Renter-occupied |
| Less than $300 | 0 (0.0%) | 0 (0.0%) |
| $300 to $499 | 27 (14.7%) | 0 (0.0%) |
| $500 to $799 | 49 (26.8%) | 0 (0.0%) |
| $800 to $999 | 17 (9.3%) | 0 (0.0%) |
| $1,000 to $1,499 | 8 (4.4%) | 32 (100.0%) |
| $1,500 to $1,999 | 42 (23.0%) | 0 (0.0%) |
| $2,000 to $2,499 | 24 (13.1%) | 0 (0.0%) |
| $2,500 to $2,999 | 16 (8.7%) | 0 (0.0%) |
| $3,000 or more | 0 (0.0%) | 0 (0.0%) |
| Total | 183 (100.0%) | 32 (100.0%) |
Physical Housing Characteristics in Belleplain
Housing Structures in Belleplain
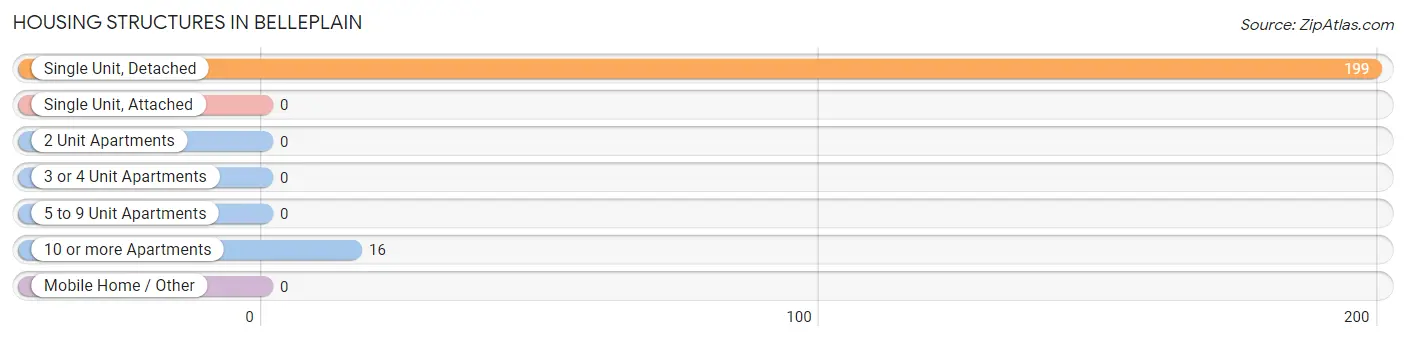
| Structure Type | # Housing Units | % Housing Units |
| Single Unit, Detached | 199 | 92.6% |
| Single Unit, Attached | 0 | 0.0% |
| 2 Unit Apartments | 0 | 0.0% |
| 3 or 4 Unit Apartments | 0 | 0.0% |
| 5 to 9 Unit Apartments | 0 | 0.0% |
| 10 or more Apartments | 16 | 7.4% |
| Mobile Home / Other | 0 | 0.0% |
| Total | 215 | 100.0% |
Housing Structures by Occupancy in Belleplain
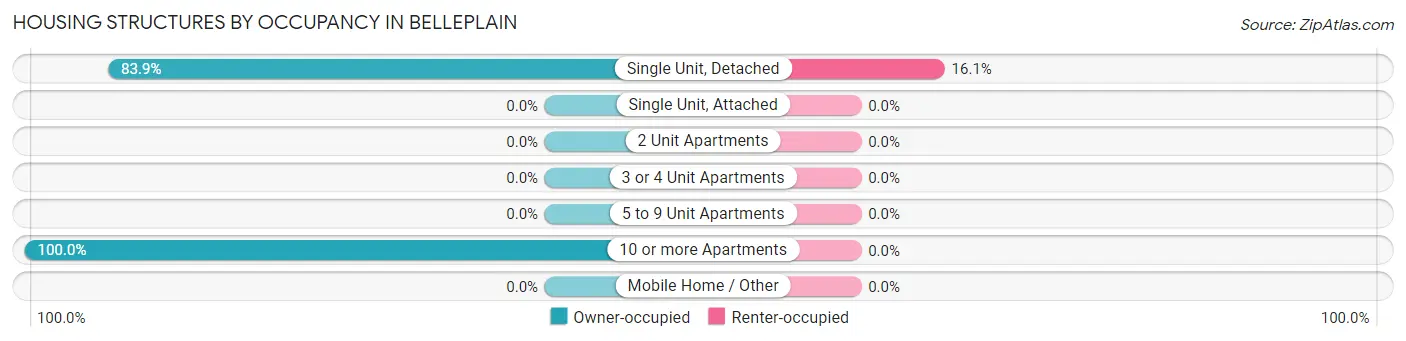
| Structure Type | Owner-occupied | Renter-occupied |
| Single Unit, Detached | 167 (83.9%) | 32 (16.1%) |
| Single Unit, Attached | 0 (0.0%) | 0 (0.0%) |
| 2 Unit Apartments | 0 (0.0%) | 0 (0.0%) |
| 3 or 4 Unit Apartments | 0 (0.0%) | 0 (0.0%) |
| 5 to 9 Unit Apartments | 0 (0.0%) | 0 (0.0%) |
| 10 or more Apartments | 16 (100.0%) | 0 (0.0%) |
| Mobile Home / Other | 0 (0.0%) | 0 (0.0%) |
| Total | 183 (85.1%) | 32 (14.9%) |
Housing Structures by Number of Rooms in Belleplain
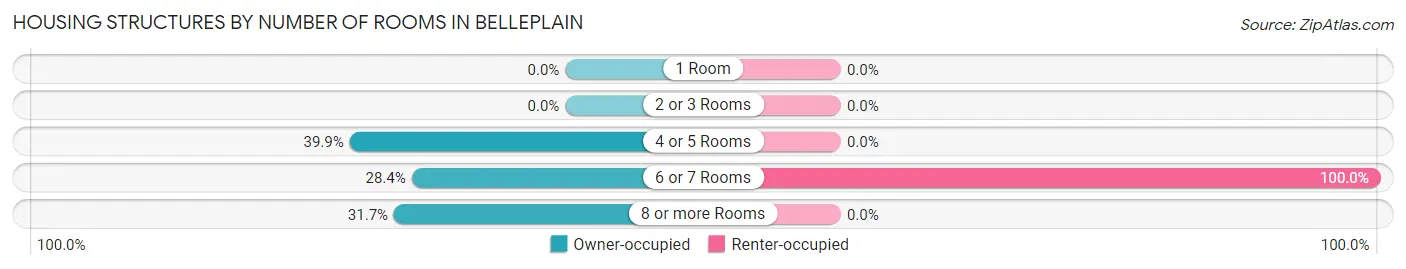
| Number of Rooms | Owner-occupied | Renter-occupied |
| 1 Room | 0 (0.0%) | 0 (0.0%) |
| 2 or 3 Rooms | 0 (0.0%) | 0 (0.0%) |
| 4 or 5 Rooms | 73 (39.9%) | 0 (0.0%) |
| 6 or 7 Rooms | 52 (28.4%) | 32 (100.0%) |
| 8 or more Rooms | 58 (31.7%) | 0 (0.0%) |
| Total | 183 (100.0%) | 32 (100.0%) |
Housing Structure by Heating Type in Belleplain
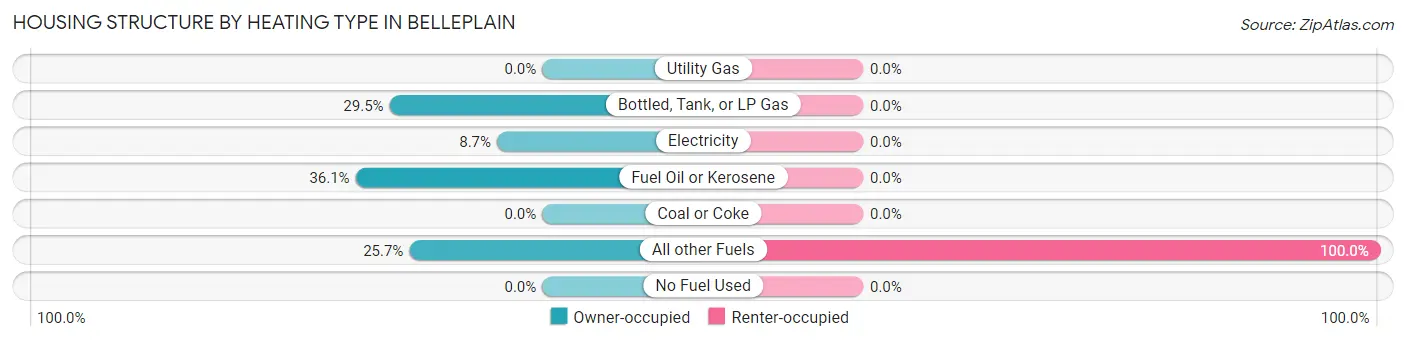
| Heating Type | Owner-occupied | Renter-occupied |
| Utility Gas | 0 (0.0%) | 0 (0.0%) |
| Bottled, Tank, or LP Gas | 54 (29.5%) | 0 (0.0%) |
| Electricity | 16 (8.7%) | 0 (0.0%) |
| Fuel Oil or Kerosene | 66 (36.1%) | 0 (0.0%) |
| Coal or Coke | 0 (0.0%) | 0 (0.0%) |
| All other Fuels | 47 (25.7%) | 32 (100.0%) |
| No Fuel Used | 0 (0.0%) | 0 (0.0%) |
| Total | 183 (100.0%) | 32 (100.0%) |
Household Vehicle Usage in Belleplain
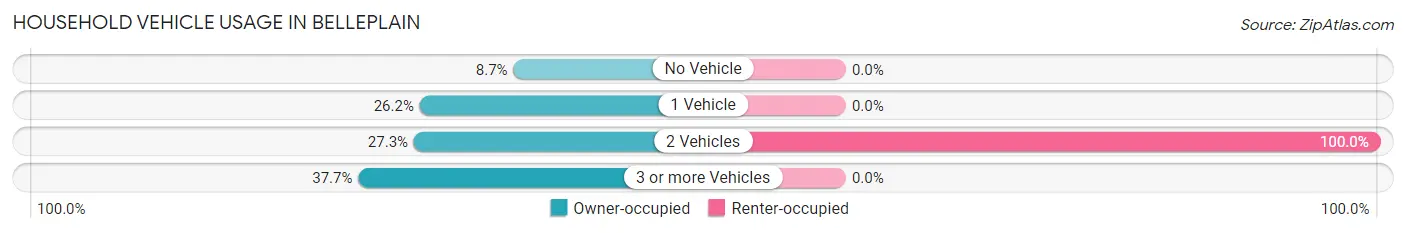
| Vehicles per Household | Owner-occupied | Renter-occupied |
| No Vehicle | 16 (8.7%) | 0 (0.0%) |
| 1 Vehicle | 48 (26.2%) | 0 (0.0%) |
| 2 Vehicles | 50 (27.3%) | 32 (100.0%) |
| 3 or more Vehicles | 69 (37.7%) | 0 (0.0%) |
| Total | 183 (100.0%) | 32 (100.0%) |
Real Estate & Mortgages in Belleplain
Real Estate and Mortgage Overview in Belleplain
| Characteristic | Without Mortgage | With Mortgage |
| Housing Units | 111 | 72 |
| Median Property Value | $273,700 | $253,300 |
| Median Household Income | $45,938 | $14 |
| Monthly Housing Costs | $648 | $0 |
| Real Estate Taxes | $3,816 | $0 |
Property Value by Mortgage Status in Belleplain
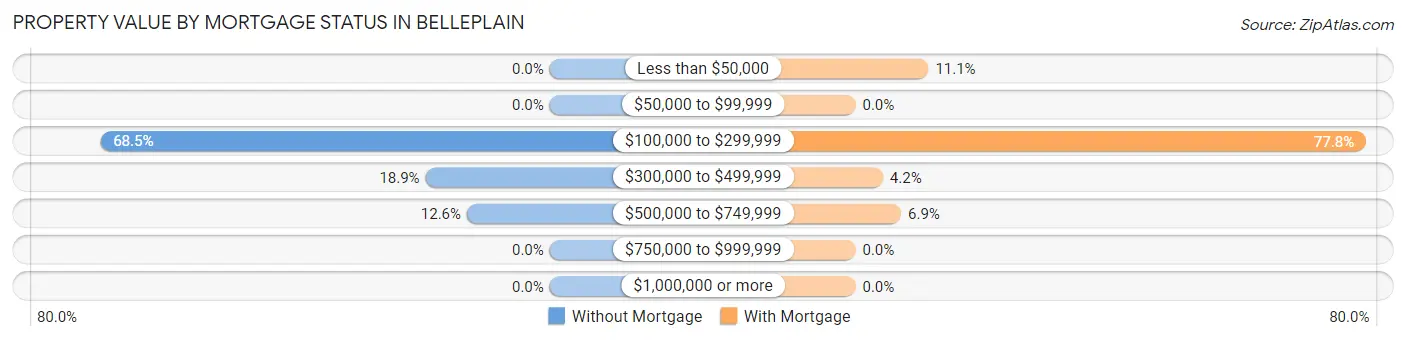
| Property Value | Without Mortgage | With Mortgage |
| Less than $50,000 | 0 (0.0%) | 8 (11.1%) |
| $50,000 to $99,999 | 0 (0.0%) | 0 (0.0%) |
| $100,000 to $299,999 | 76 (68.5%) | 56 (77.8%) |
| $300,000 to $499,999 | 21 (18.9%) | 3 (4.2%) |
| $500,000 to $749,999 | 14 (12.6%) | 5 (6.9%) |
| $750,000 to $999,999 | 0 (0.0%) | 0 (0.0%) |
| $1,000,000 or more | 0 (0.0%) | 0 (0.0%) |
| Total | 111 (100.0%) | 72 (100.0%) |
Household Income by Mortgage Status in Belleplain
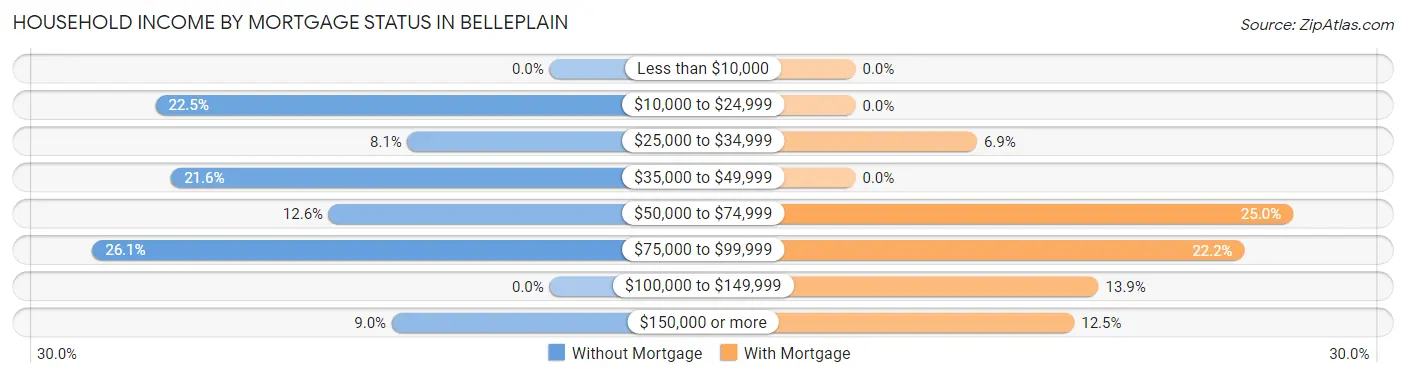
| Household Income | Without Mortgage | With Mortgage |
| Less than $10,000 | 0 (0.0%) | 0 (0.0%) |
| $10,000 to $24,999 | 25 (22.5%) | 0 (0.0%) |
| $25,000 to $34,999 | 9 (8.1%) | 5 (6.9%) |
| $35,000 to $49,999 | 24 (21.6%) | 0 (0.0%) |
| $50,000 to $74,999 | 14 (12.6%) | 18 (25.0%) |
| $75,000 to $99,999 | 29 (26.1%) | 16 (22.2%) |
| $100,000 to $149,999 | 0 (0.0%) | 10 (13.9%) |
| $150,000 or more | 10 (9.0%) | 9 (12.5%) |
| Total | 111 (100.0%) | 72 (100.0%) |
Property Value to Household Income Ratio in Belleplain
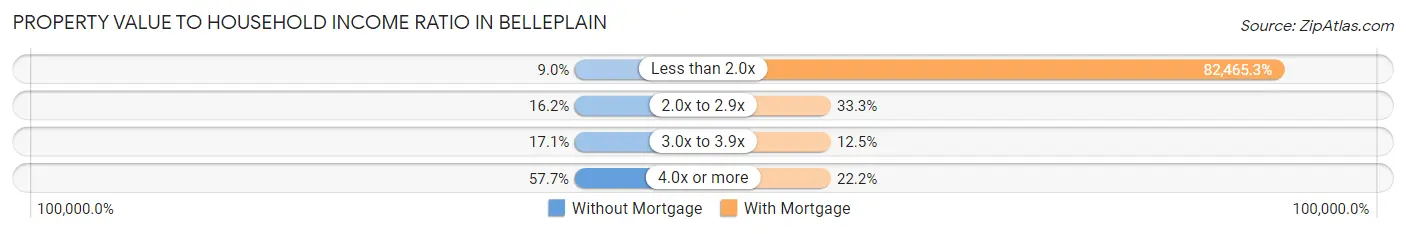
| Value-to-Income Ratio | Without Mortgage | With Mortgage |
| Less than 2.0x | 10 (9.0%) | 59,375 (82,465.3%) |
| 2.0x to 2.9x | 18 (16.2%) | 24 (33.3%) |
| 3.0x to 3.9x | 19 (17.1%) | 9 (12.5%) |
| 4.0x or more | 64 (57.7%) | 16 (22.2%) |
| Total | 111 (100.0%) | 72 (100.0%) |
Real Estate Taxes by Mortgage Status in Belleplain
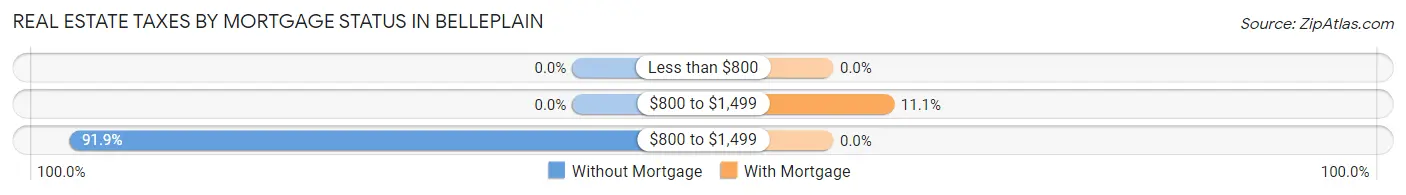
| Property Taxes | Without Mortgage | With Mortgage |
| Less than $800 | 0 (0.0%) | 0 (0.0%) |
| $800 to $1,499 | 0 (0.0%) | 8 (11.1%) |
| $800 to $1,499 | 102 (91.9%) | 0 (0.0%) |
| Total | 111 (100.0%) | 72 (100.0%) |
Health & Disability in Belleplain
Health Insurance Coverage by Age in Belleplain
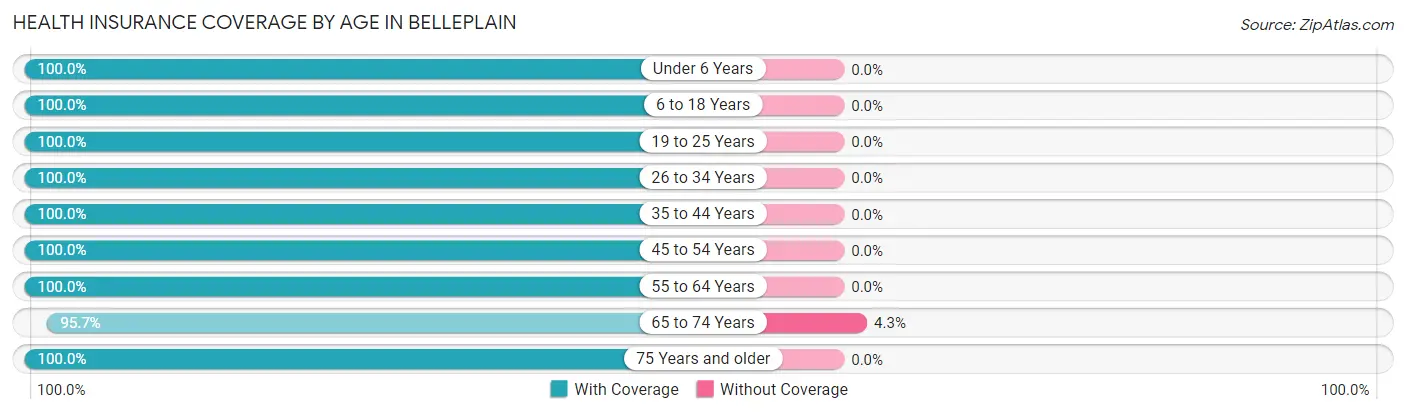
| Age Bracket | With Coverage | Without Coverage |
| Under 6 Years | 91 (100.0%) | 0 (0.0%) |
| 6 to 18 Years | 9 (100.0%) | 0 (0.0%) |
| 19 to 25 Years | 5 (100.0%) | 0 (0.0%) |
| 26 to 34 Years | 72 (100.0%) | 0 (0.0%) |
| 35 to 44 Years | 34 (100.0%) | 0 (0.0%) |
| 45 to 54 Years | 29 (100.0%) | 0 (0.0%) |
| 55 to 64 Years | 83 (100.0%) | 0 (0.0%) |
| 65 to 74 Years | 90 (95.7%) | 4 (4.3%) |
| 75 Years and older | 46 (100.0%) | 0 (0.0%) |
| Total | 459 (99.1%) | 4 (0.9%) |
Health Insurance Coverage by Citizenship Status in Belleplain
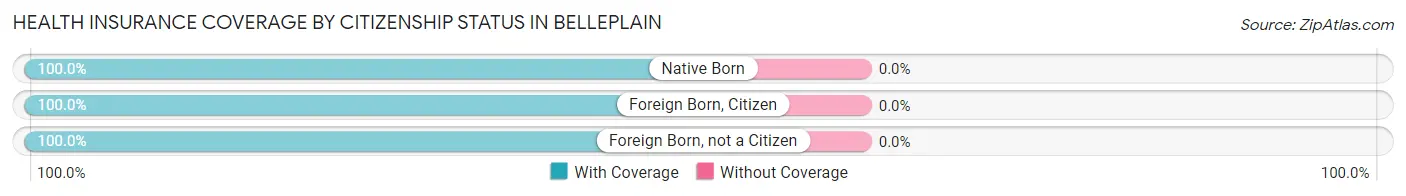
| Citizenship Status | With Coverage | Without Coverage |
| Native Born | 91 (100.0%) | 0 (0.0%) |
| Foreign Born, Citizen | 9 (100.0%) | 0 (0.0%) |
| Foreign Born, not a Citizen | 5 (100.0%) | 0 (0.0%) |
Health Insurance Coverage by Household Income in Belleplain
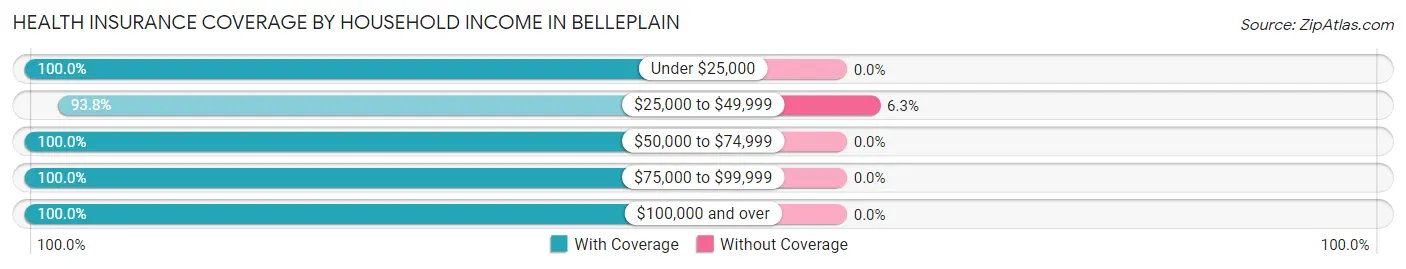
| Household Income | With Coverage | Without Coverage |
| Under $25,000 | 43 (100.0%) | 0 (0.0%) |
| $25,000 to $49,999 | 60 (93.8%) | 4 (6.2%) |
| $50,000 to $74,999 | 189 (100.0%) | 0 (0.0%) |
| $75,000 to $99,999 | 73 (100.0%) | 0 (0.0%) |
| $100,000 and over | 94 (100.0%) | 0 (0.0%) |
Public vs Private Health Insurance Coverage by Age in Belleplain
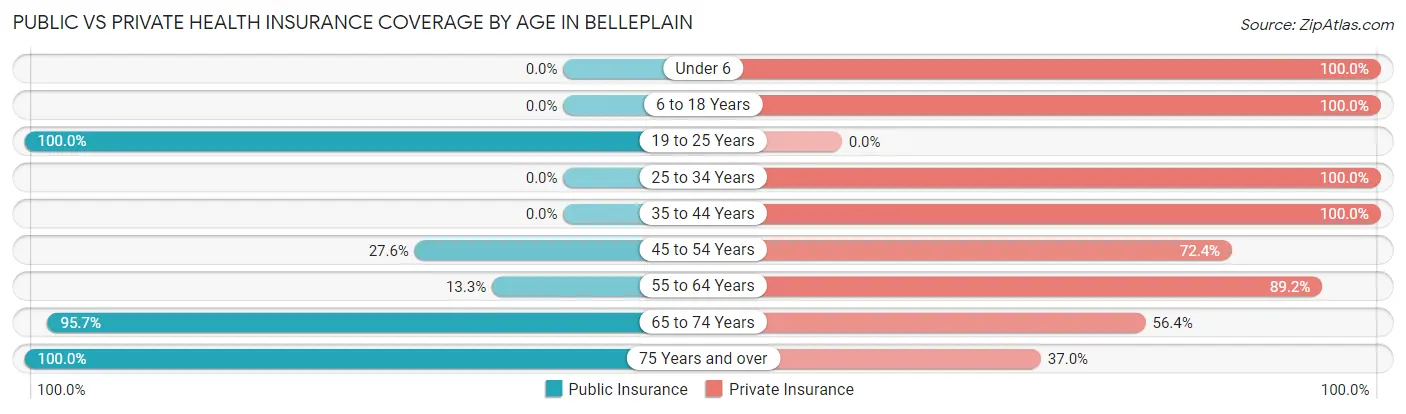
| Age Bracket | Public Insurance | Private Insurance |
| Under 6 | 0 (0.0%) | 91 (100.0%) |
| 6 to 18 Years | 0 (0.0%) | 9 (100.0%) |
| 19 to 25 Years | 5 (100.0%) | 0 (0.0%) |
| 25 to 34 Years | 0 (0.0%) | 72 (100.0%) |
| 35 to 44 Years | 0 (0.0%) | 34 (100.0%) |
| 45 to 54 Years | 8 (27.6%) | 21 (72.4%) |
| 55 to 64 Years | 11 (13.3%) | 74 (89.2%) |
| 65 to 74 Years | 90 (95.7%) | 53 (56.4%) |
| 75 Years and over | 46 (100.0%) | 17 (37.0%) |
| Total | 160 (34.6%) | 371 (80.1%) |
Disability Status by Sex by Age in Belleplain
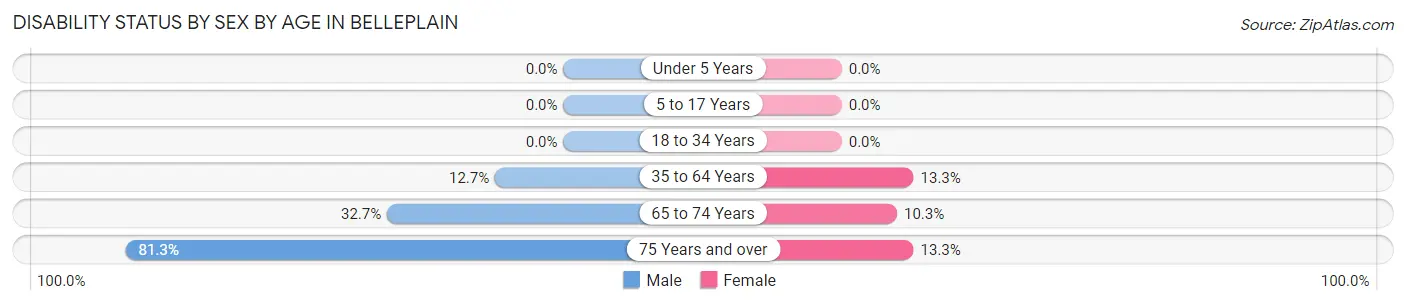
| Age Bracket | Male | Female |
| Under 5 Years | 0 (0.0%) | 0 (0.0%) |
| 5 to 17 Years | 0 (0.0%) | 0 (0.0%) |
| 18 to 34 Years | 0 (0.0%) | 0 (0.0%) |
| 35 to 64 Years | 9 (12.7%) | 10 (13.3%) |
| 65 to 74 Years | 18 (32.7%) | 4 (10.3%) |
| 75 Years and over | 13 (81.2%) | 4 (13.3%) |
Disability Class by Sex by Age in Belleplain
Disability Class: Hearing Difficulty
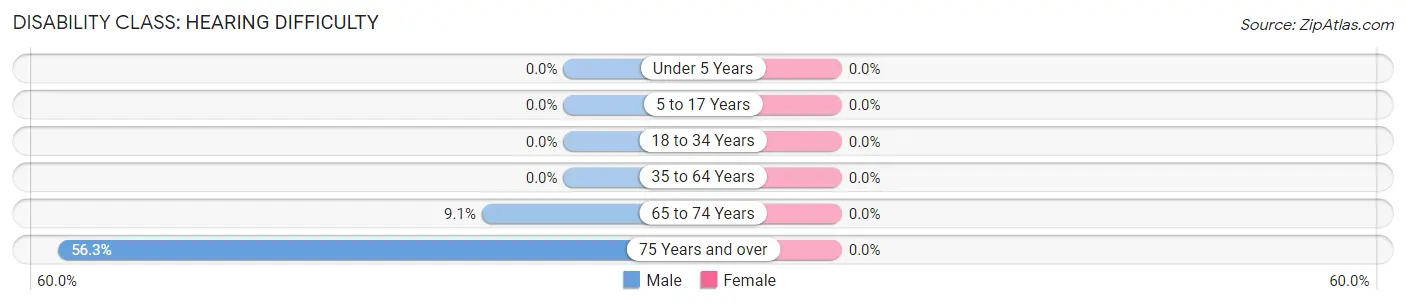
| Age Bracket | Male | Female |
| Under 5 Years | 0 (0.0%) | 0 (0.0%) |
| 5 to 17 Years | 0 (0.0%) | 0 (0.0%) |
| 18 to 34 Years | 0 (0.0%) | 0 (0.0%) |
| 35 to 64 Years | 0 (0.0%) | 0 (0.0%) |
| 65 to 74 Years | 5 (9.1%) | 0 (0.0%) |
| 75 Years and over | 9 (56.2%) | 0 (0.0%) |
Disability Class: Vision Difficulty
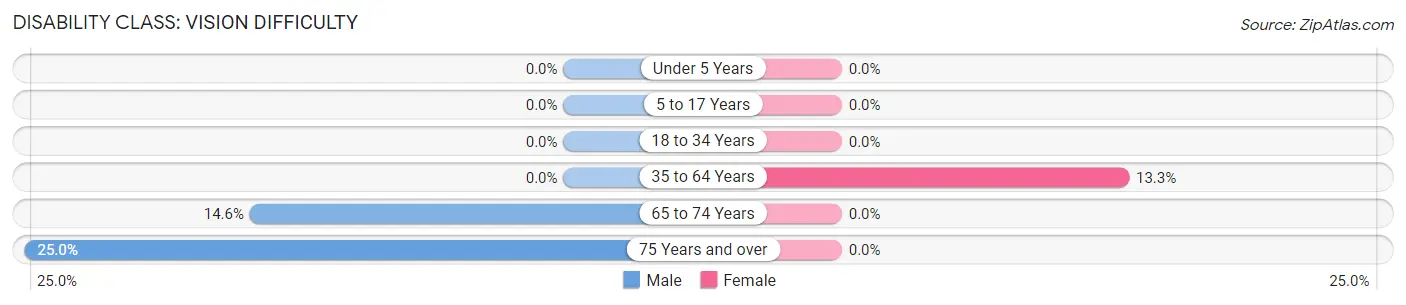
| Age Bracket | Male | Female |
| Under 5 Years | 0 (0.0%) | 0 (0.0%) |
| 5 to 17 Years | 0 (0.0%) | 0 (0.0%) |
| 18 to 34 Years | 0 (0.0%) | 0 (0.0%) |
| 35 to 64 Years | 0 (0.0%) | 10 (13.3%) |
| 65 to 74 Years | 8 (14.5%) | 0 (0.0%) |
| 75 Years and over | 4 (25.0%) | 0 (0.0%) |
Disability Class: Cognitive Difficulty
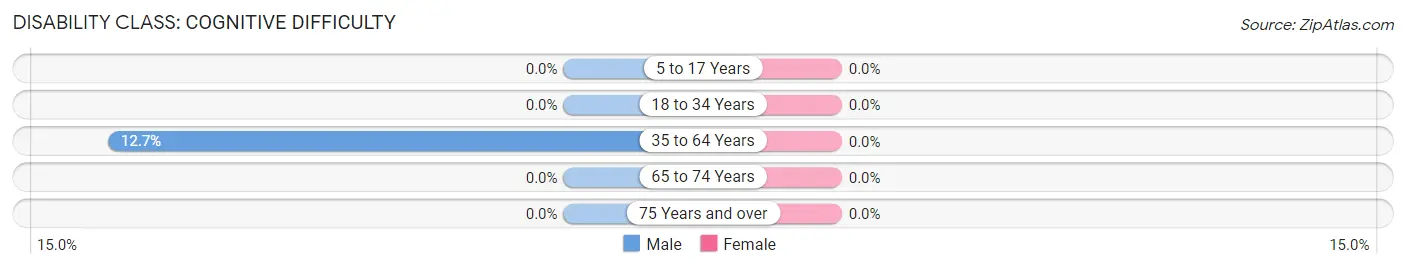
| Age Bracket | Male | Female |
| 5 to 17 Years | 0 (0.0%) | 0 (0.0%) |
| 18 to 34 Years | 0 (0.0%) | 0 (0.0%) |
| 35 to 64 Years | 9 (12.7%) | 0 (0.0%) |
| 65 to 74 Years | 0 (0.0%) | 0 (0.0%) |
| 75 Years and over | 0 (0.0%) | 0 (0.0%) |
Disability Class: Ambulatory Difficulty
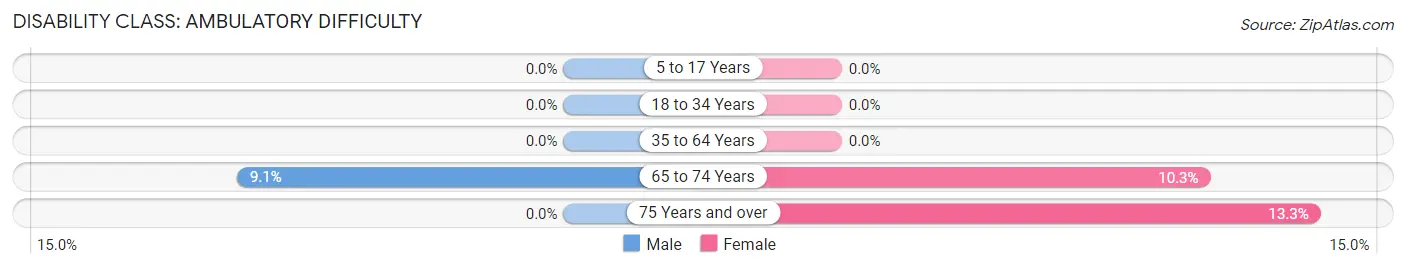
| Age Bracket | Male | Female |
| 5 to 17 Years | 0 (0.0%) | 0 (0.0%) |
| 18 to 34 Years | 0 (0.0%) | 0 (0.0%) |
| 35 to 64 Years | 0 (0.0%) | 0 (0.0%) |
| 65 to 74 Years | 5 (9.1%) | 4 (10.3%) |
| 75 Years and over | 0 (0.0%) | 4 (13.3%) |
Disability Class: Self-Care Difficulty
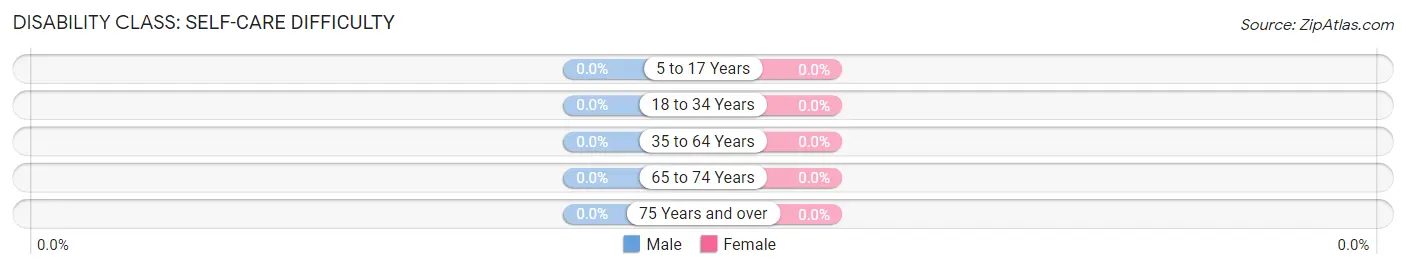
| Age Bracket | Male | Female |
| 5 to 17 Years | 0 (0.0%) | 0 (0.0%) |
| 18 to 34 Years | 0 (0.0%) | 0 (0.0%) |
| 35 to 64 Years | 0 (0.0%) | 0 (0.0%) |
| 65 to 74 Years | 0 (0.0%) | 0 (0.0%) |
| 75 Years and over | 0 (0.0%) | 0 (0.0%) |
Technology Access in Belleplain
Computing Device Access in Belleplain
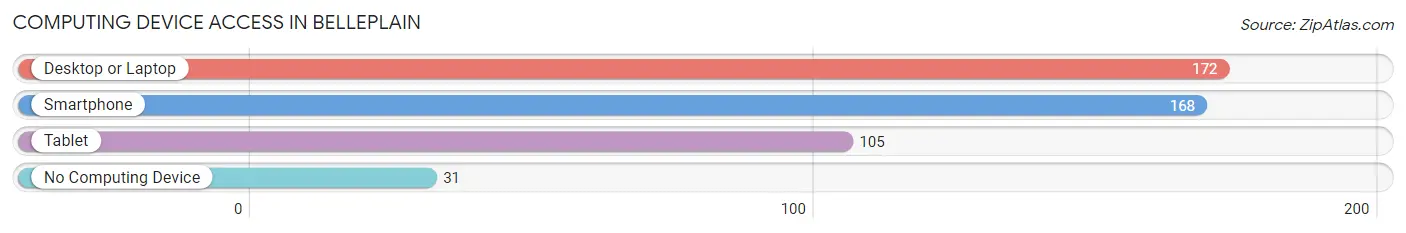
| Device Type | # Households | % Households |
| Desktop or Laptop | 172 | 80.0% |
| Smartphone | 168 | 78.1% |
| Tablet | 105 | 48.8% |
| No Computing Device | 31 | 14.4% |
| Total | 215 | 100.0% |
Internet Access in Belleplain
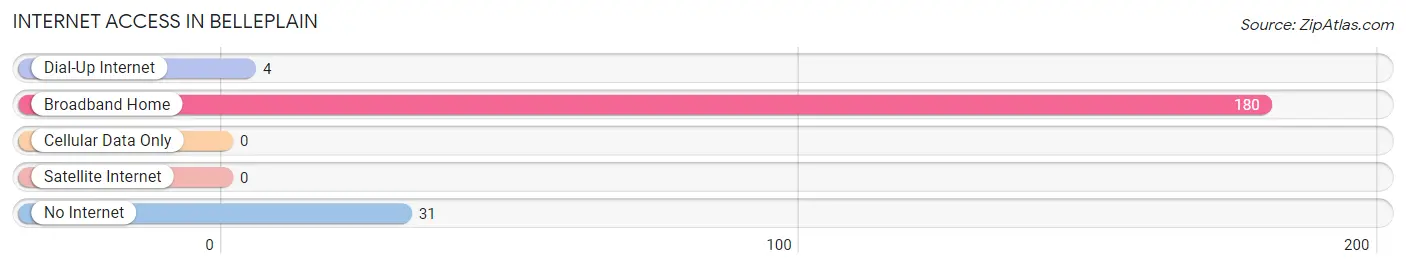
| Internet Type | # Households | % Households |
| Dial-Up Internet | 4 | 1.9% |
| Broadband Home | 180 | 83.7% |
| Cellular Data Only | 0 | 0.0% |
| Satellite Internet | 0 | 0.0% |
| No Internet | 31 | 14.4% |
| Total | 215 | 100.0% |
Belleplain Summary
Belleplain is a small unincorporated community located in Cape May County, New Jersey. It is situated in the southernmost part of the state, just north of the Atlantic Ocean. The community is bordered by the towns of Dennis Township, Woodbine, and Estell Manor. Belleplain is a rural area with a population of just over 1,000 people.
History
Belleplain was first settled in the late 1700s by a group of Quakers from Pennsylvania. The Quakers named the area after the French phrase “belle plaine”, which translates to “beautiful plain”. The area was originally used for farming and logging, and the first post office was established in 1851.
In the late 1800s, the area began to develop as a resort destination. The Belleplain Hotel was built in 1887 and was a popular destination for vacationers. The hotel was destroyed by a fire in the early 1900s, but the area continued to attract visitors.
In the early 1900s, the area began to develop as a summer resort. The Belleplain Beach Club was established in 1910 and was a popular destination for vacationers. The area also became a popular spot for fishing and hunting.
Geography
Belleplain is located in the southernmost part of New Jersey, just north of the Atlantic Ocean. The community is bordered by the towns of Dennis Township, Woodbine, and Estell Manor. The area is mostly rural, with a few small businesses and residential areas.
The area is mostly flat, with some rolling hills. The soil is mostly sandy and loamy, and the climate is humid subtropical. The average temperature in the summer is around 80 degrees Fahrenheit, and the average temperature in the winter is around 40 degrees Fahrenheit.
Economy
The economy of Belleplain is mostly based on tourism and agriculture. The area is a popular destination for vacationers, and there are several small businesses that cater to tourists. The area is also home to several farms, which produce a variety of crops, including corn, soybeans, and wheat.
The area is also home to several small manufacturing businesses, which produce a variety of products, including furniture, clothing, and electronics.
Demographics
As of the 2010 census, the population of Belleplain was 1,072. The population is mostly white (94.3%), with a small percentage of African Americans (2.3%) and Hispanics (2.2%). The median household income is $50,000, and the median age is 44.
Belleplain is a small, rural community with a population of just over 1,000 people. The area is mostly white, with a small percentage of African Americans and Hispanics. The economy is mostly based on tourism and agriculture, and the area is a popular destination for vacationers.
Common Questions
What is Per Capita Income in Belleplain?
Per Capita income in Belleplain is $31,784.
What is the Median Family Income in Belleplain?
Median Family Income in Belleplain is $70,938.
What is the Median Household income in Belleplain?
Median Household Income in Belleplain is $54,102.
What is Income or Wage Gap in Belleplain?
Income or Wage Gap in Belleplain is 4.0%.
Women in Belleplain earn 96.0 cents for every dollar earned by a man.
What is Inequality or Gini Index in Belleplain?
Inequality or Gini Index in Belleplain is 0.37.
What is the Total Population of Belleplain?
Total Population of Belleplain is 463.
What is the Total Male Population of Belleplain?
Total Male Population of Belleplain is 210.
What is the Total Female Population of Belleplain?
Total Female Population of Belleplain is 253.
What is the Ratio of Males per 100 Females in Belleplain?
There are 83.00 Males per 100 Females in Belleplain.
What is the Ratio of Females per 100 Males in Belleplain?
There are 120.48 Females per 100 Males in Belleplain.
What is the Median Population Age in Belleplain?
Median Population Age in Belleplain is 54.2 Years.
What is the Average Family Size in Belleplain
Average Family Size in Belleplain is 2.7 People.
What is the Average Household Size in Belleplain
Average Household Size in Belleplain is 2.1 People.
How Large is the Labor Force in Belleplain?
There are 172 People in the Labor Forcein in Belleplain.
What is the Percentage of People in the Labor Force in Belleplain?
47.4% of People are in the Labor Force in Belleplain.