Richwood, NJ Map & Demographics
Richwood Map
Richwood Overview
$61,926
PER CAPITA INCOME
$200,793
AVG FAMILY INCOME
$201,037
AVG HOUSEHOLD INCOME
47.8%
WAGE / INCOME GAP [ % ]
52.2¢/ $1
WAGE / INCOME GAP [ $ ]
0.35
INEQUALITY / GINI INDEX
3,656
TOTAL POPULATION
1,939
MALE POPULATION
1,717
FEMALE POPULATION
112.93
MALES / 100 FEMALES
88.55
FEMALES / 100 MALES
38.9
MEDIAN AGE
4.0
AVG FAMILY SIZE
3.6
AVG HOUSEHOLD SIZE
1,918
LABOR FORCE [ PEOPLE ]
69.9%
PERCENT IN LABOR FORCE
7.4%
UNEMPLOYMENT RATE
Richwood Area Codes
Income in Richwood
Income Overview in Richwood
Per Capita Income in Richwood is $61,926, while median incomes of families and households are $200,793 and $201,037 respectively.
| Characteristic | Number | Measure |
| Per Capita Income | 3,656 | $61,926 |
| Median Family Income | 826 | $200,793 |
| Mean Family Income | 826 | $223,557 |
| Median Household Income | 1,002 | $201,037 |
| Mean Household Income | 1,002 | $219,211 |
| Income Deficit | 826 | $0 |
| Wage / Income Gap (%) | 3,656 | 47.83% |
| Wage / Income Gap ($) | 3,656 | 52.17¢ per $1 |
| Gini / Inequality Index | 3,656 | 0.35 |
Earnings by Sex in Richwood
Average Earnings in Richwood are $73,482, $115,882 for men and $60,455 for women, a difference of 47.8%.
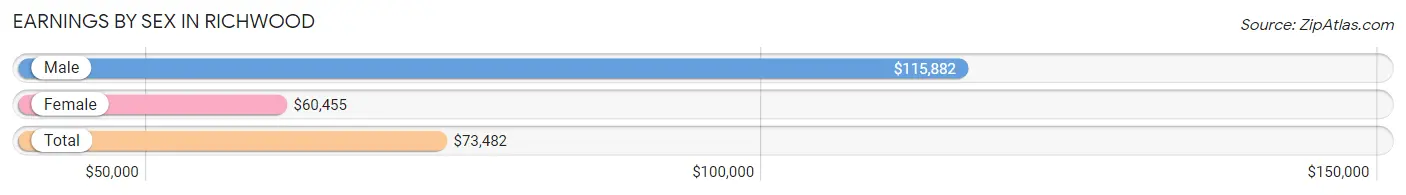
| Sex | Number | Average Earnings |
| Male | 1,030 (52.7%) | $115,882 |
| Female | 924 (47.3%) | $60,455 |
| Total | 1,954 (100.0%) | $73,482 |
Earnings by Sex by Income Bracket in Richwood
The most common earnings brackets in Richwood are $100,000+ for men (606 | 58.8%) and $100,000+ for women (199 | 21.5%).
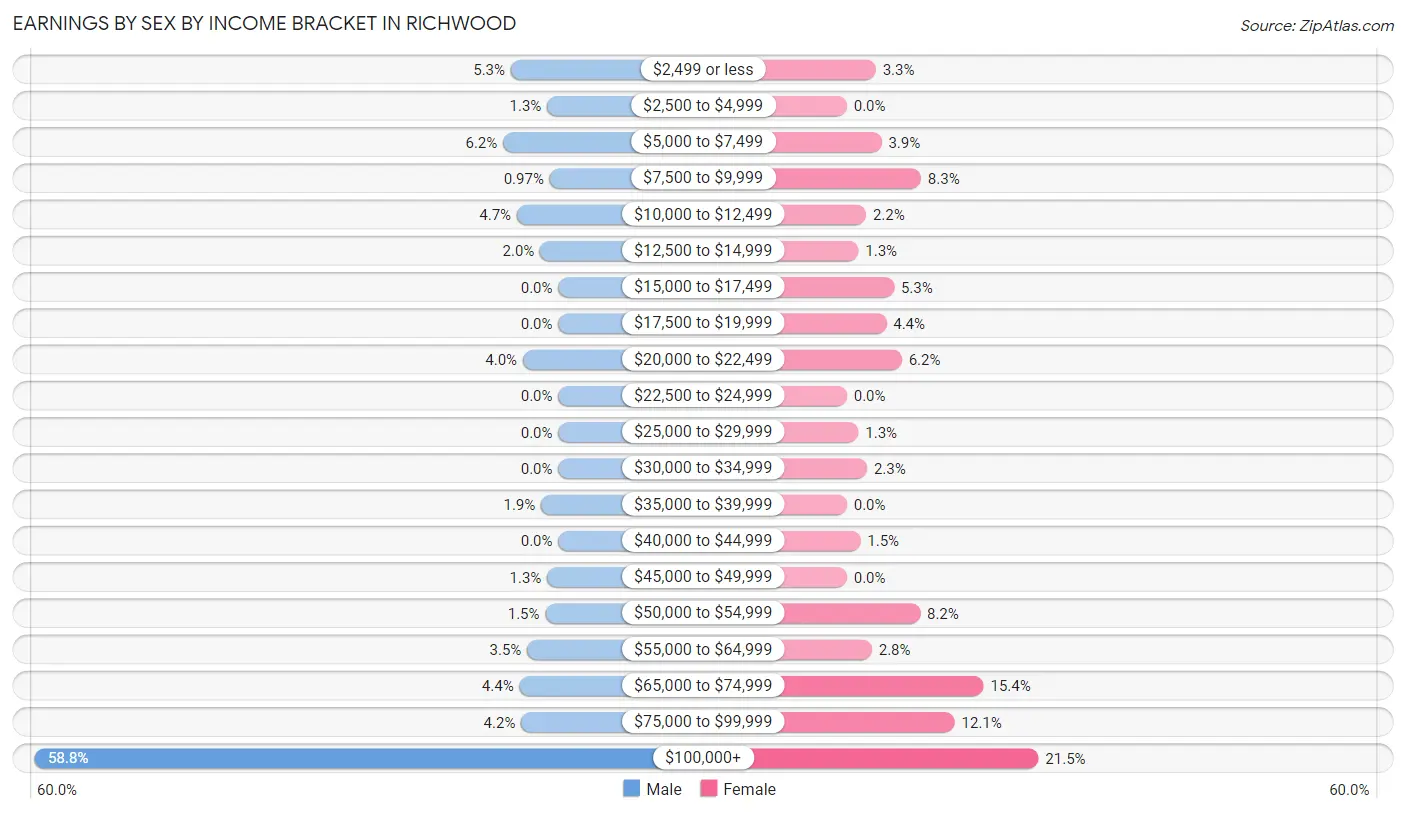
| Income | Male | Female |
| $2,499 or less | 55 (5.3%) | 30 (3.3%) |
| $2,500 to $4,999 | 13 (1.3%) | 0 (0.0%) |
| $5,000 to $7,499 | 64 (6.2%) | 36 (3.9%) |
| $7,500 to $9,999 | 10 (1.0%) | 77 (8.3%) |
| $10,000 to $12,499 | 48 (4.7%) | 20 (2.2%) |
| $12,500 to $14,999 | 21 (2.0%) | 12 (1.3%) |
| $15,000 to $17,499 | 0 (0.0%) | 49 (5.3%) |
| $17,500 to $19,999 | 0 (0.0%) | 41 (4.4%) |
| $20,000 to $22,499 | 41 (4.0%) | 57 (6.2%) |
| $22,500 to $24,999 | 0 (0.0%) | 0 (0.0%) |
| $25,000 to $29,999 | 0 (0.0%) | 12 (1.3%) |
| $30,000 to $34,999 | 0 (0.0%) | 21 (2.3%) |
| $35,000 to $39,999 | 20 (1.9%) | 0 (0.0%) |
| $40,000 to $44,999 | 0 (0.0%) | 14 (1.5%) |
| $45,000 to $49,999 | 13 (1.3%) | 0 (0.0%) |
| $50,000 to $54,999 | 15 (1.5%) | 76 (8.2%) |
| $55,000 to $64,999 | 36 (3.5%) | 26 (2.8%) |
| $65,000 to $74,999 | 45 (4.4%) | 142 (15.4%) |
| $75,000 to $99,999 | 43 (4.2%) | 112 (12.1%) |
| $100,000+ | 606 (58.8%) | 199 (21.5%) |
| Total | 1,030 (100.0%) | 924 (100.0%) |
Earnings by Sex by Educational Attainment in Richwood
Average earnings in Richwood are $142,432 for men and $66,088 for women, a difference of 53.6%. Men with an educational attainment of graduate degree enjoy the highest average annual earnings of $193,306, while those with college or associate's degree education earn the least with $81,196. Women with an educational attainment of graduate degree earn the most with the average annual earnings of $86,607, while those with bachelor's degree education have the smallest earnings of $65,645.
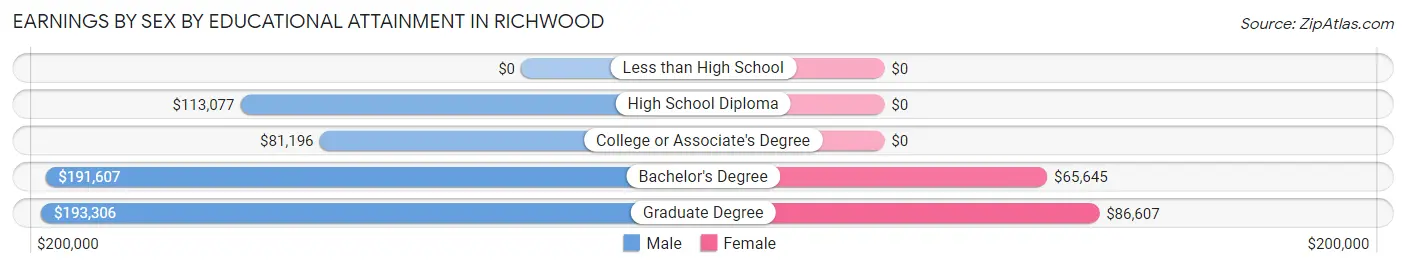
| Educational Attainment | Male Income | Female Income |
| Less than High School | - | - |
| High School Diploma | $113,077 | $0 |
| College or Associate's Degree | $81,196 | $0 |
| Bachelor's Degree | $191,607 | $65,645 |
| Graduate Degree | $193,306 | $86,607 |
| Total | $142,432 | $66,088 |
Family Income in Richwood
Family Income Brackets in Richwood
According to the Richwood family income data, there are 426 families falling into the $200,000+ income range, which is the most common income bracket and makes up 51.6% of all families.
| Income Bracket | # Families | % Families |
| Less than $10,000 | 13 | 1.6% |
| $10,000 to $14,999 | 0 | 0.0% |
| $15,000 to $24,999 | 0 | 0.0% |
| $25,000 to $34,999 | 0 | 0.0% |
| $35,000 to $49,999 | 0 | 0.0% |
| $50,000 to $74,999 | 61 | 7.4% |
| $75,000 to $99,999 | 86 | 10.4% |
| $100,000 to $149,999 | 103 | 12.5% |
| $150,000 to $199,999 | 137 | 16.6% |
| $200,000+ | 426 | 51.6% |
Family Income by Famaliy Size in Richwood
6-person families (102 | 12.3%) account for the highest median family income in Richwood with $250,001 per family, while 2-person families (208 | 25.2%) have the highest median income of $66,528 per family member.
| Income Bracket | # Families | Median Income |
| 2-Person Families | 208 (25.2%) | $133,056 |
| 3-Person Families | 171 (20.7%) | $107,043 |
| 4-Person Families | 214 (25.9%) | $237,500 |
| 5-Person Families | 131 (15.9%) | $226,103 |
| 6-Person Families | 102 (12.3%) | $250,001 |
| 7+ Person Families | 0 (0.0%) | $0 |
| Total | 826 (100.0%) | $200,793 |
Family Income by Number of Earners in Richwood
The median family income in Richwood is $200,793, with families comprising 3+ earners (168) having the highest median family income of $250,001, while families with no earners (82) have the lowest median family income of $85,670, accounting for 20.3% and 9.9% of families, respectively.
| Number of Earners | # Families | Median Income |
| No Earners | 82 (9.9%) | $85,670 |
| 1 Earner | 138 (16.7%) | $147,361 |
| 2 Earners | 438 (53.0%) | $206,833 |
| 3+ Earners | 168 (20.3%) | $250,001 |
| Total | 826 (100.0%) | $200,793 |
Household Income in Richwood
Household Income Brackets in Richwood
With 518 households falling in the category, the $200,000+ income range is the most frequent in Richwood, accounting for 51.7% of all households.
| Income Bracket | # Households | % Households |
| Less than $10,000 | 0 | 0.0% |
| $10,000 to $14,999 | 0 | 0.0% |
| $15,000 to $24,999 | 15 | 1.5% |
| $25,000 to $34,999 | 68 | 6.8% |
| $35,000 to $49,999 | 15 | 1.5% |
| $50,000 to $74,999 | 46 | 4.6% |
| $75,000 to $99,999 | 86 | 8.6% |
| $100,000 to $149,999 | 108 | 10.8% |
| $150,000 to $199,999 | 146 | 14.6% |
| $200,000+ | 518 | 51.7% |
Household Income by Householder Age in Richwood
The median household income in Richwood is $201,037, with the highest median household income of $226,103 found in the 45 to 64 years age bracket for the primary householder. A total of 495 households (49.4%) fall into this category. Meanwhile, the 15 to 24 years age bracket for the primary householder has the lowest median household income of $0, with 12 households (1.2%) in this group.
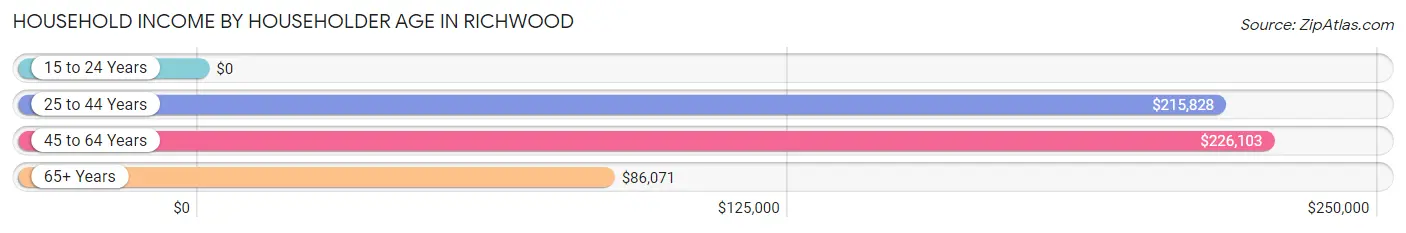
| Income Bracket | # Households | Median Income |
| 15 to 24 Years | 12 (1.2%) | $0 |
| 25 to 44 Years | 335 (33.4%) | $215,828 |
| 45 to 64 Years | 495 (49.4%) | $226,103 |
| 65+ Years | 160 (16.0%) | $86,071 |
| Total | 1,002 (100.0%) | $201,037 |
Poverty in Richwood
Income Below Poverty by Sex and Age in Richwood
With 3.2% poverty level for males and 6.4% for females among the residents of Richwood, 18 to 24 year old males and 35 to 44 year old females are the most vulnerable to poverty, with 30 males (11.9%) and 77 females (23.4%) in their respective age groups living below the poverty level.
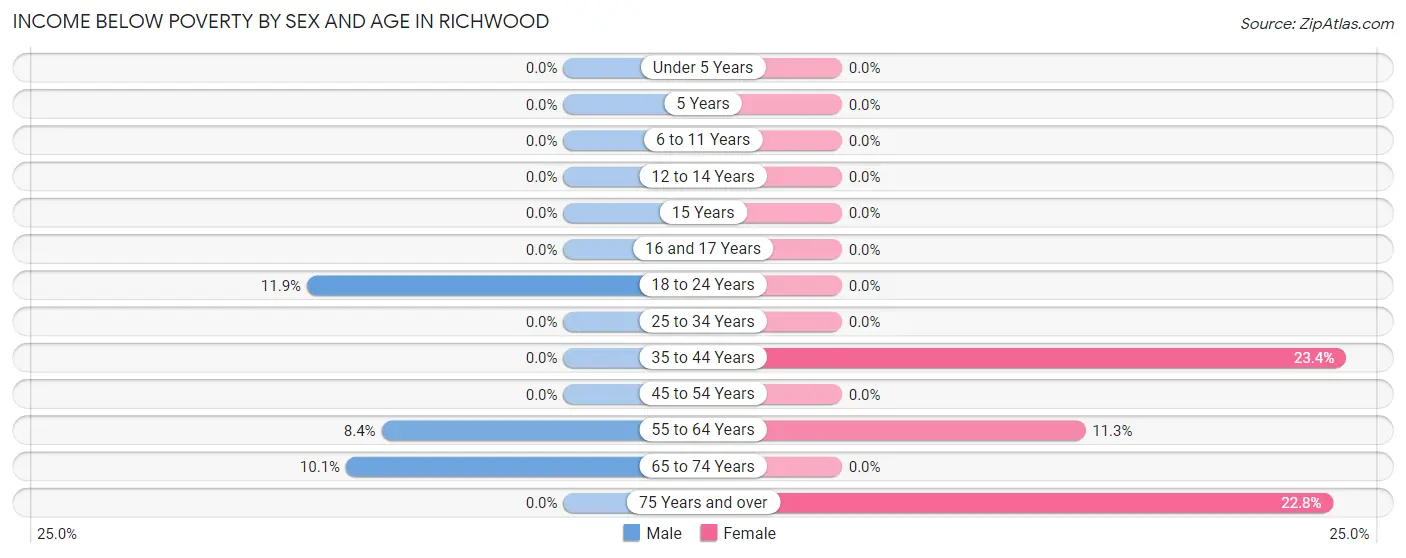
| Age Bracket | Male | Female |
| Under 5 Years | 0 (0.0%) | 0 (0.0%) |
| 5 Years | 0 (0.0%) | 0 (0.0%) |
| 6 to 11 Years | 0 (0.0%) | 0 (0.0%) |
| 12 to 14 Years | 0 (0.0%) | 0 (0.0%) |
| 15 Years | 0 (0.0%) | 0 (0.0%) |
| 16 and 17 Years | 0 (0.0%) | 0 (0.0%) |
| 18 to 24 Years | 30 (11.9%) | 0 (0.0%) |
| 25 to 34 Years | 0 (0.0%) | 0 (0.0%) |
| 35 to 44 Years | 0 (0.0%) | 77 (23.4%) |
| 45 to 54 Years | 0 (0.0%) | 0 (0.0%) |
| 55 to 64 Years | 20 (8.4%) | 20 (11.3%) |
| 65 to 74 Years | 11 (10.1%) | 0 (0.0%) |
| 75 Years and over | 0 (0.0%) | 13 (22.8%) |
| Total | 61 (3.2%) | 110 (6.4%) |
Income Above Poverty by Sex and Age in Richwood
According to the poverty statistics in Richwood, males aged under 5 years and females aged under 5 years are the age groups that are most secure financially, with 100.0% of males and 100.0% of females in these age groups living above the poverty line.
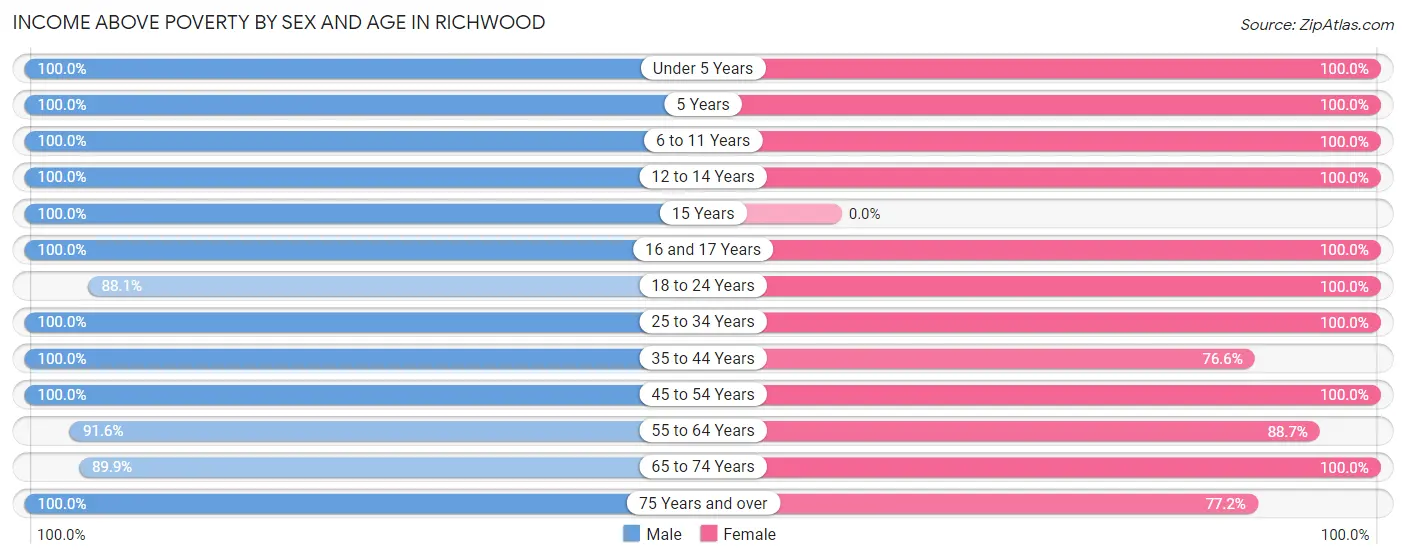
| Age Bracket | Male | Female |
| Under 5 Years | 34 (100.0%) | 54 (100.0%) |
| 5 Years | 40 (100.0%) | 40 (100.0%) |
| 6 to 11 Years | 263 (100.0%) | 212 (100.0%) |
| 12 to 14 Years | 126 (100.0%) | 112 (100.0%) |
| 15 Years | 31 (100.0%) | 0 (0.0%) |
| 16 and 17 Years | 60 (100.0%) | 20 (100.0%) |
| 18 to 24 Years | 222 (88.1%) | 150 (100.0%) |
| 25 to 34 Years | 120 (100.0%) | 157 (100.0%) |
| 35 to 44 Years | 313 (100.0%) | 252 (76.6%) |
| 45 to 54 Years | 296 (100.0%) | 311 (100.0%) |
| 55 to 64 Years | 217 (91.6%) | 157 (88.7%) |
| 65 to 74 Years | 98 (89.9%) | 98 (100.0%) |
| 75 Years and over | 58 (100.0%) | 44 (77.2%) |
| Total | 1,878 (96.9%) | 1,607 (93.6%) |
Income Below Poverty Among Married-Couple Families in Richwood
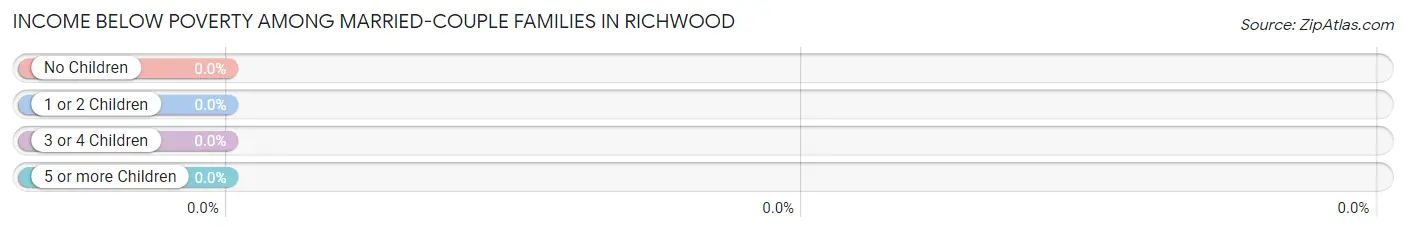
| Children | Above Poverty | Below Poverty |
| No Children | 289 (100.0%) | 0 (0.0%) |
| 1 or 2 Children | 381 (100.0%) | 0 (0.0%) |
| 3 or 4 Children | 78 (100.0%) | 0 (0.0%) |
| 5 or more Children | 0 (0.0%) | 0 (0.0%) |
| Total | 748 (100.0%) | 0 (0.0%) |
Income Below Poverty Among Single-Parent Households in Richwood
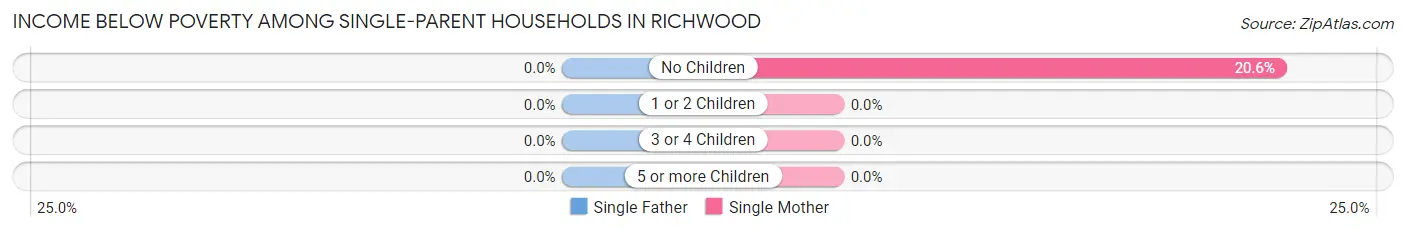
| Children | Single Father | Single Mother |
| No Children | 0 (0.0%) | 13 (20.6%) |
| 1 or 2 Children | 0 (0.0%) | 0 (0.0%) |
| 3 or 4 Children | 0 (0.0%) | 0 (0.0%) |
| 5 or more Children | 0 (0.0%) | 0 (0.0%) |
| Total | 0 (0.0%) | 13 (16.7%) |
Income Below Poverty Among Married-Couple vs Single-Parent Households in Richwood
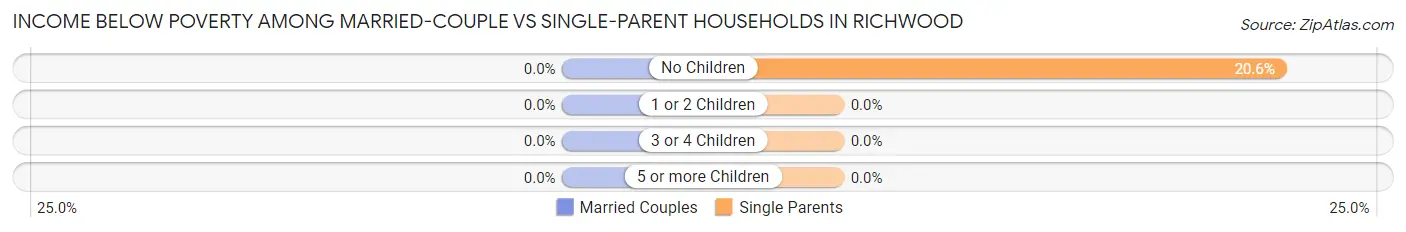
| Children | Married-Couple Families | Single-Parent Households |
| No Children | 0 (0.0%) | 13 (20.6%) |
| 1 or 2 Children | 0 (0.0%) | 0 (0.0%) |
| 3 or 4 Children | 0 (0.0%) | 0 (0.0%) |
| 5 or more Children | 0 (0.0%) | 0 (0.0%) |
| Total | 0 (0.0%) | 13 (16.7%) |
Race in Richwood
The most populous races in Richwood are White / Caucasian (3,363 | 92.0%), Two or more Races (178 | 4.9%), and Hispanic or Latino (174 | 4.8%).
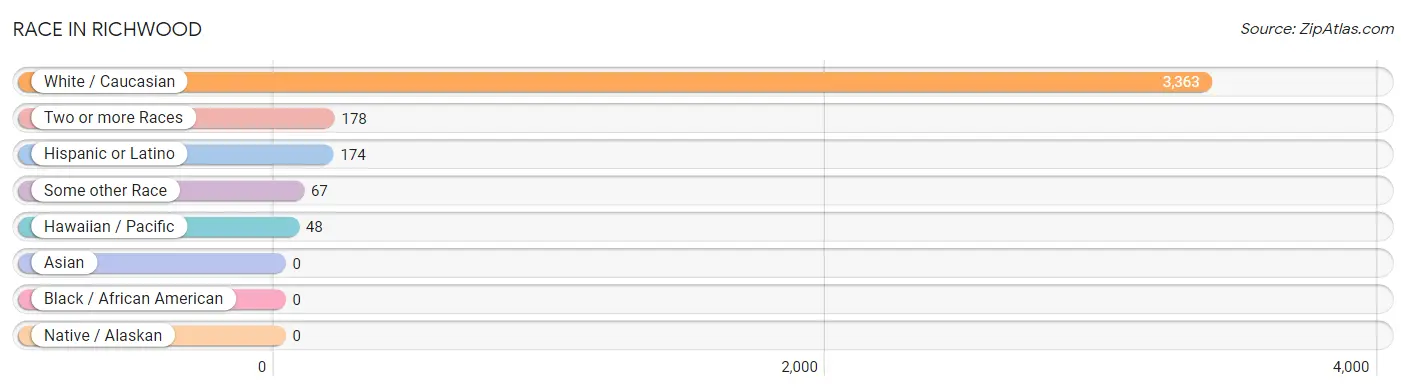
| Race | # Population | % Population |
| Asian | 0 | 0.0% |
| Black / African American | 0 | 0.0% |
| Hawaiian / Pacific | 48 | 1.3% |
| Hispanic or Latino | 174 | 4.8% |
| Native / Alaskan | 0 | 0.0% |
| White / Caucasian | 3,363 | 92.0% |
| Two or more Races | 178 | 4.9% |
| Some other Race | 67 | 1.8% |
| Total | 3,656 | 100.0% |
Ancestry in Richwood
The most populous ancestries reported in Richwood are Italian (1,039 | 28.4%), Irish (980 | 26.8%), German (486 | 13.3%), Polish (404 | 11.1%), and English (343 | 9.4%), together accounting for 89.0% of all Richwood residents.
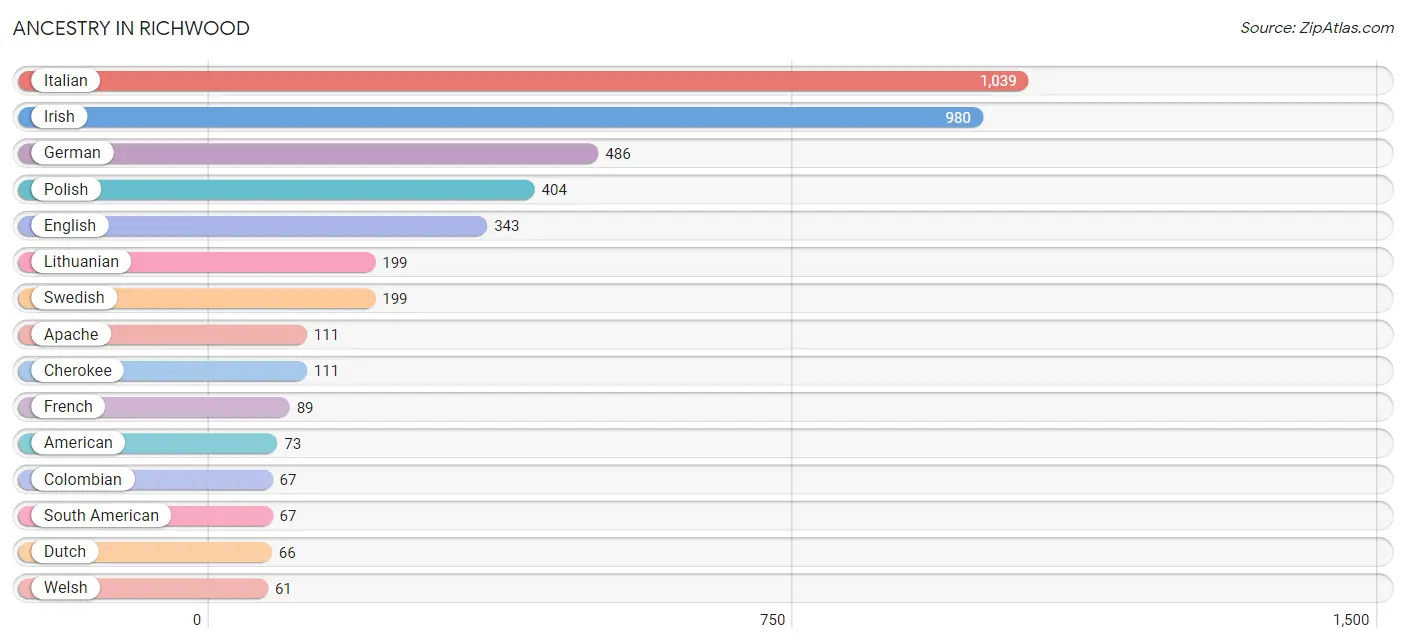
| Ancestry | # Population | % Population |
| American | 73 | 2.0% |
| Apache | 111 | 3.0% |
| Central American | 21 | 0.6% |
| Cherokee | 111 | 3.0% |
| Colombian | 67 | 1.8% |
| Costa Rican | 21 | 0.6% |
| Croatian | 14 | 0.4% |
| Dutch | 66 | 1.8% |
| Eastern European | 13 | 0.4% |
| English | 343 | 9.4% |
| French | 89 | 2.4% |
| French Canadian | 28 | 0.8% |
| German | 486 | 13.3% |
| Guamanian / Chamorro | 48 | 1.3% |
| Irish | 980 | 26.8% |
| Italian | 1,039 | 28.4% |
| Lithuanian | 199 | 5.4% |
| Mexican | 26 | 0.7% |
| Norwegian | 14 | 0.4% |
| Polish | 404 | 11.1% |
| Puerto Rican | 60 | 1.6% |
| Scandinavian | 14 | 0.4% |
| Scotch-Irish | 28 | 0.8% |
| Scottish | 51 | 1.4% |
| Serbian | 17 | 0.5% |
| Slavic | 45 | 1.2% |
| South American | 67 | 1.8% |
| Swedish | 199 | 5.4% |
| Ukrainian | 10 | 0.3% |
| Welsh | 61 | 1.7% | View All 30 Rows |
Immigrants in Richwood
The most numerous immigrant groups reported in Richwood came from Europe (37 | 1.0%), Italy (37 | 1.0%), and Southern Europe (37 | 1.0%), together accounting for 3.0% of all Richwood residents.
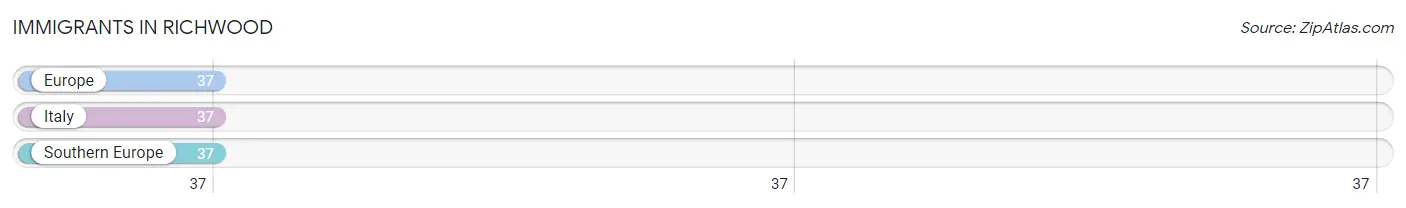
| Immigration Origin | # Population | % Population |
| Europe | 37 | 1.0% |
| Italy | 37 | 1.0% |
| Southern Europe | 37 | 1.0% | View All 3 Rows |
Sex and Age in Richwood
Sex and Age in Richwood
The most populous age groups in Richwood are 5 to 9 Years (262 | 13.5%) for men and 45 to 49 Years (240 | 14.0%) for women.
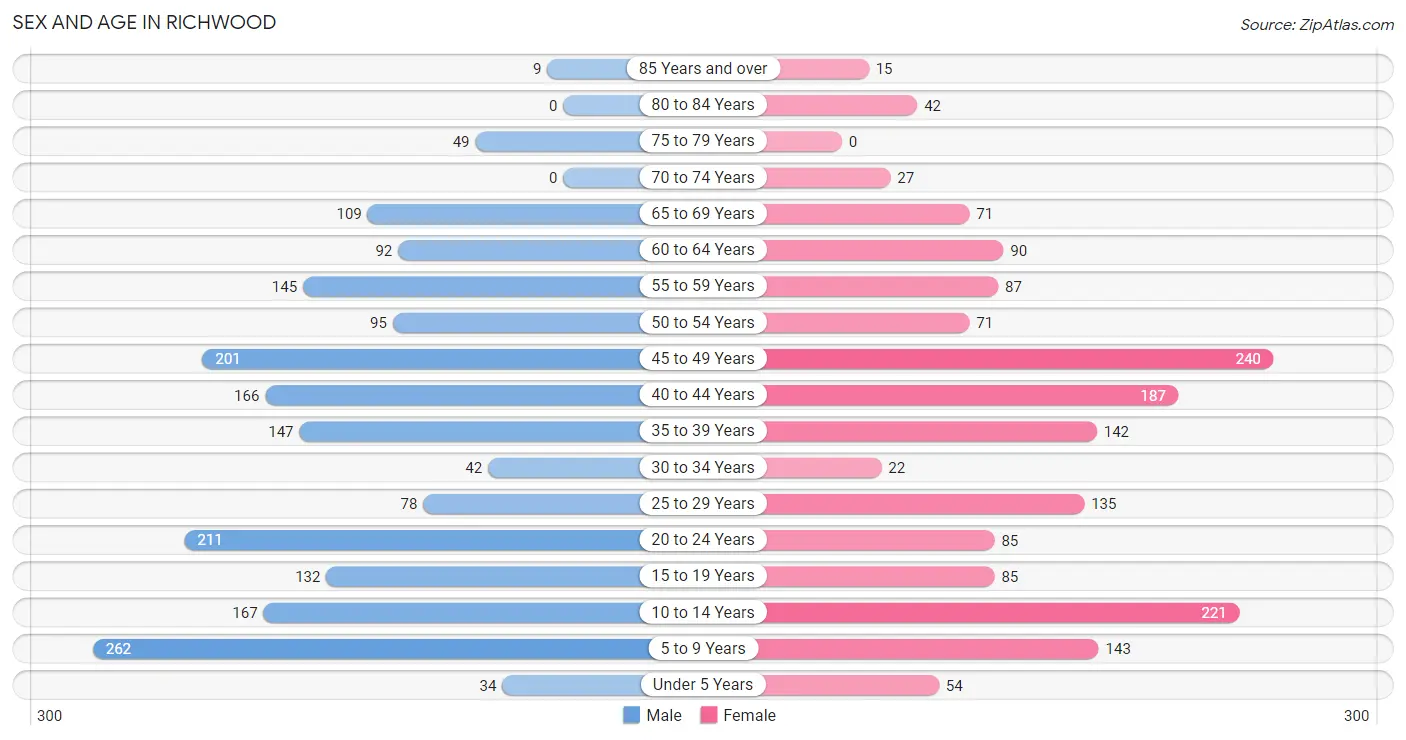
| Age Bracket | Male | Female |
| Under 5 Years | 34 (1.8%) | 54 (3.2%) |
| 5 to 9 Years | 262 (13.5%) | 143 (8.3%) |
| 10 to 14 Years | 167 (8.6%) | 221 (12.9%) |
| 15 to 19 Years | 132 (6.8%) | 85 (5.0%) |
| 20 to 24 Years | 211 (10.9%) | 85 (5.0%) |
| 25 to 29 Years | 78 (4.0%) | 135 (7.9%) |
| 30 to 34 Years | 42 (2.2%) | 22 (1.3%) |
| 35 to 39 Years | 147 (7.6%) | 142 (8.3%) |
| 40 to 44 Years | 166 (8.6%) | 187 (10.9%) |
| 45 to 49 Years | 201 (10.4%) | 240 (14.0%) |
| 50 to 54 Years | 95 (4.9%) | 71 (4.1%) |
| 55 to 59 Years | 145 (7.5%) | 87 (5.1%) |
| 60 to 64 Years | 92 (4.7%) | 90 (5.2%) |
| 65 to 69 Years | 109 (5.6%) | 71 (4.1%) |
| 70 to 74 Years | 0 (0.0%) | 27 (1.6%) |
| 75 to 79 Years | 49 (2.5%) | 0 (0.0%) |
| 80 to 84 Years | 0 (0.0%) | 42 (2.5%) |
| 85 Years and over | 9 (0.5%) | 15 (0.9%) |
| Total | 1,939 (100.0%) | 1,717 (100.0%) |
Families and Households in Richwood
Median Family Size in Richwood
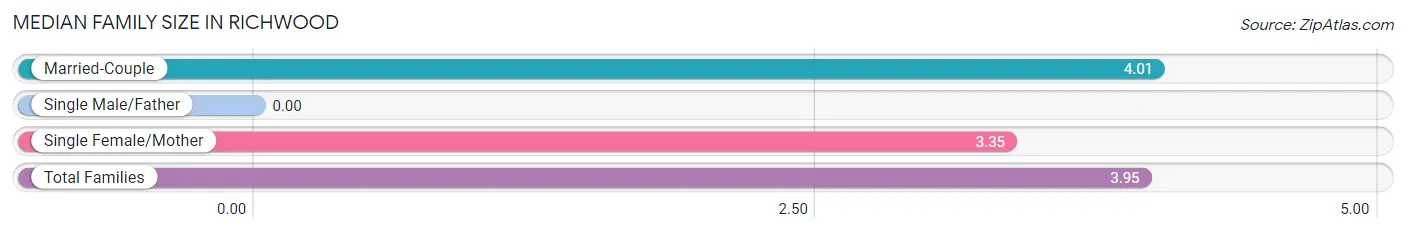
| Family Type | # Families | Family Size |
| Married-Couple | 748 (90.6%) | 4.01 |
| Single Male/Father | 0 (0.0%) | - |
| Single Female/Mother | 78 (9.4%) | 3.35 |
| Total Families | 826 (100.0%) | 3.95 |
Median Household Size in Richwood
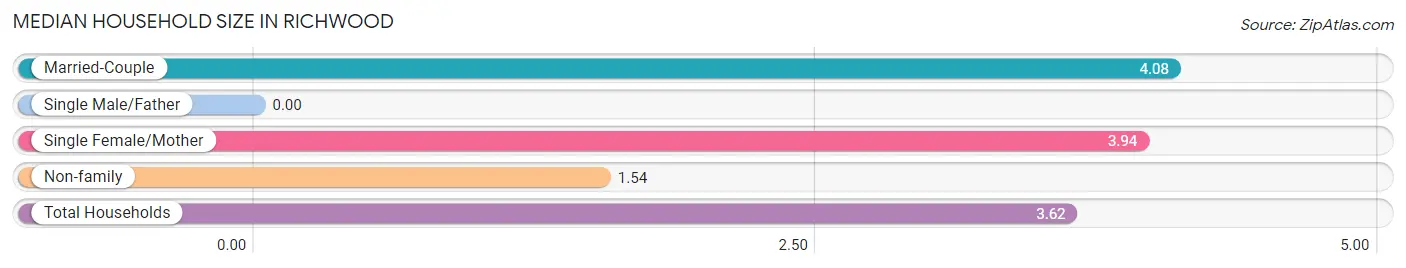
| Household Type | # Households | Household Size |
| Married-Couple | 748 (74.7%) | 4.08 |
| Single Male/Father | 0 (0.0%) | - |
| Single Female/Mother | 78 (7.8%) | 3.94 |
| Non-family | 176 (17.6%) | 1.54 |
| Total Households | 1,002 (100.0%) | 3.62 |
Household Size by Marriage Status in Richwood
Out of a total of 1,002 households in Richwood, 826 (82.4%) are family households, while 176 (17.6%) are nonfamily households. The most numerous type of family households are 4-person households, comprising 213, and the most common type of nonfamily households are 2-person households, comprising 91.
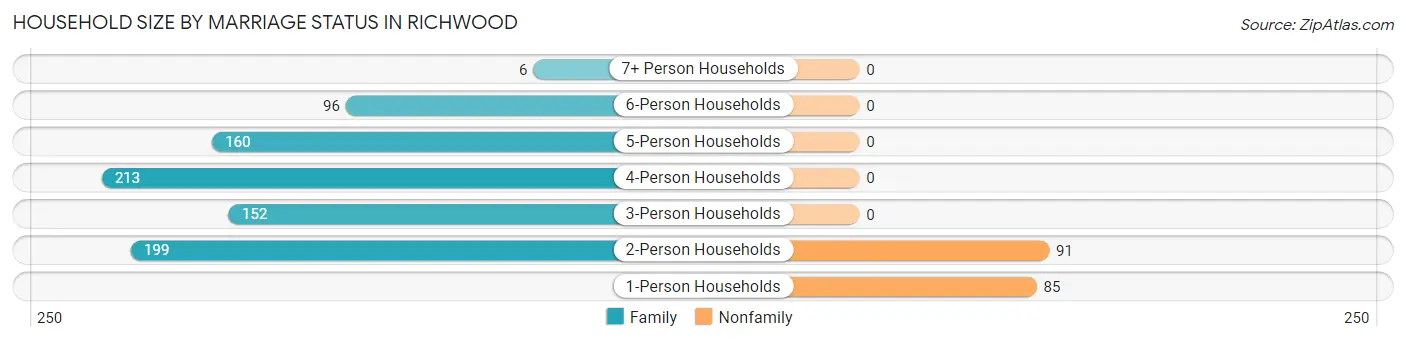
| Household Size | Family Households | Nonfamily Households |
| 1-Person Households | - | 85 (8.5%) |
| 2-Person Households | 199 (19.9%) | 91 (9.1%) |
| 3-Person Households | 152 (15.2%) | 0 (0.0%) |
| 4-Person Households | 213 (21.3%) | 0 (0.0%) |
| 5-Person Households | 160 (16.0%) | 0 (0.0%) |
| 6-Person Households | 96 (9.6%) | 0 (0.0%) |
| 7+ Person Households | 6 (0.6%) | 0 (0.0%) |
| Total | 826 (82.4%) | 176 (17.6%) |
Female Fertility in Richwood
Fertility by Age in Richwood
Average fertility rate in Richwood is 31.0 births per 1,000 women. Women in the age bracket of 35 to 50 years have the highest fertility rate with 48.0 births per 1,000 women. Women in the age bracket of 35 to 50 years acount for 100.0% of all women with births.
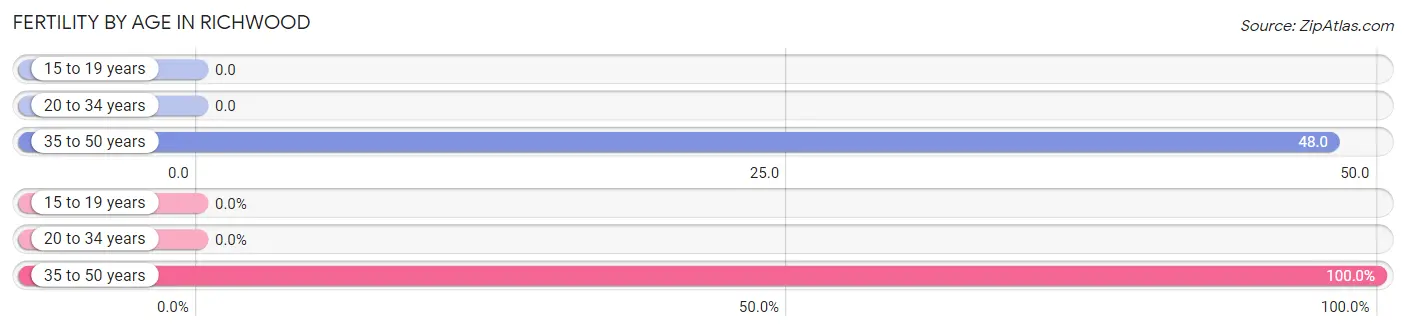
| Age Bracket | Women with Births | Births / 1,000 Women |
| 15 to 19 years | 0 (0.0%) | 0.0 |
| 20 to 34 years | 0 (0.0%) | 0.0 |
| 35 to 50 years | 28 (100.0%) | 48.0 |
| Total | 28 (100.0%) | 31.0 |
Fertility by Age by Marriage Status in Richwood
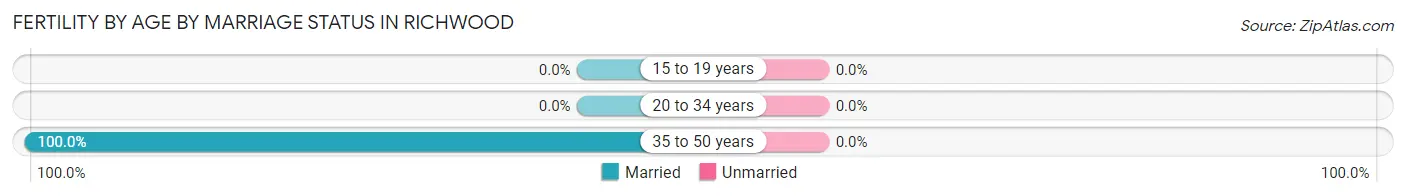
| Age Bracket | Married | Unmarried |
| 15 to 19 years | 0 (0.0%) | 0 (0.0%) |
| 20 to 34 years | 0 (0.0%) | 0 (0.0%) |
| 35 to 50 years | 28 (100.0%) | 0 (0.0%) |
| Total | 28 (100.0%) | 0 (0.0%) |
Fertility by Education in Richwood
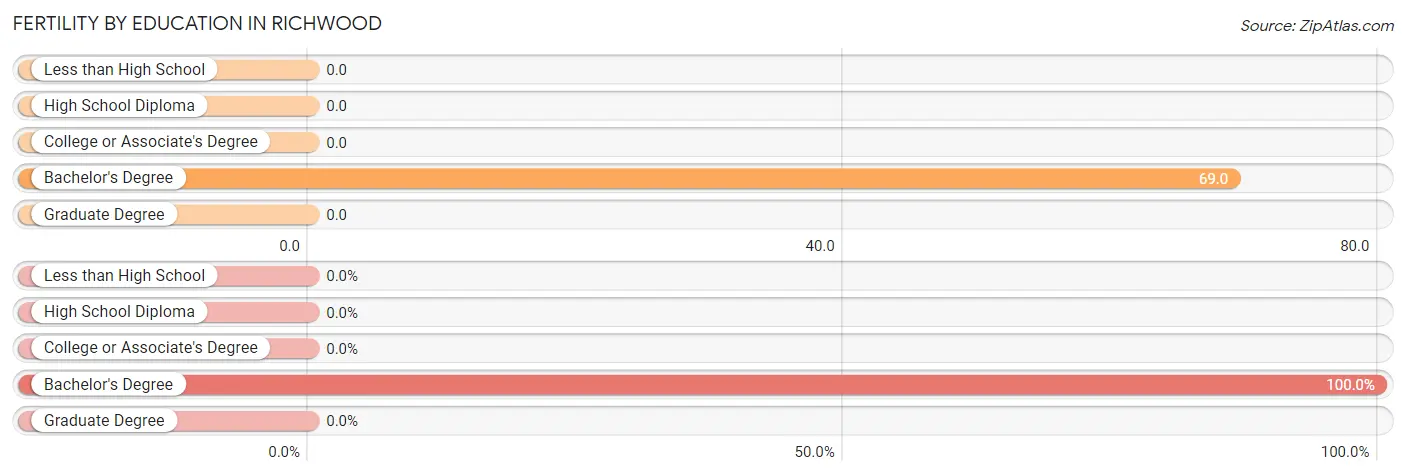
| Educational Attainment | Women with Births | Births / 1,000 Women |
| Less than High School | 0 (0.0%) | 0.0 |
| High School Diploma | 0 (0.0%) | 0.0 |
| College or Associate's Degree | 0 (0.0%) | 0.0 |
| Bachelor's Degree | 28 (100.0%) | 69.0 |
| Graduate Degree | 0 (0.0%) | 0.0 |
| Total | 28 (100.0%) | 31.0 |
Fertility by Education by Marriage Status in Richwood
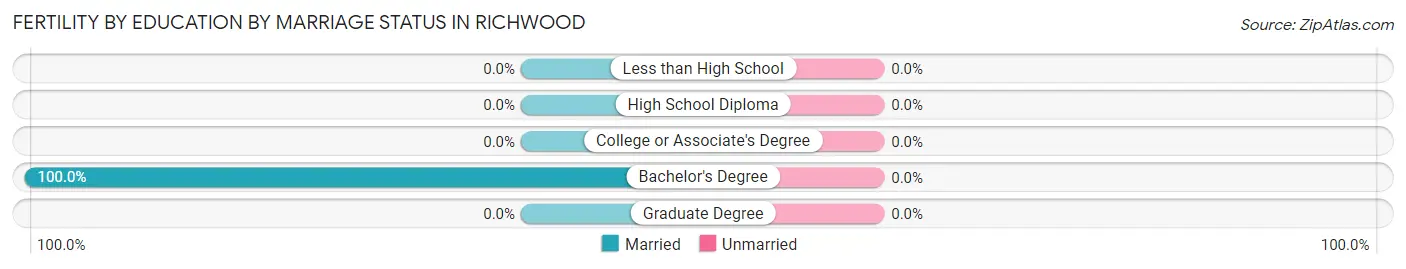
| Educational Attainment | Married | Unmarried |
| Less than High School | 0 (0.0%) | 0 (0.0%) |
| High School Diploma | 0 (0.0%) | 0 (0.0%) |
| College or Associate's Degree | 0 (0.0%) | 0 (0.0%) |
| Bachelor's Degree | 28 (100.0%) | 0 (0.0%) |
| Graduate Degree | 0 (0.0%) | 0 (0.0%) |
| Total | 28 (100.0%) | 0 (0.0%) |
Employment Characteristics in Richwood
Employment by Class of Employer in Richwood
Among the 1,764 employed individuals in Richwood, private company employees (978 | 55.4%), self-employed (not incorporated) (258 | 14.6%), and local government employees (222 | 12.6%) make up the most common classes of employment.
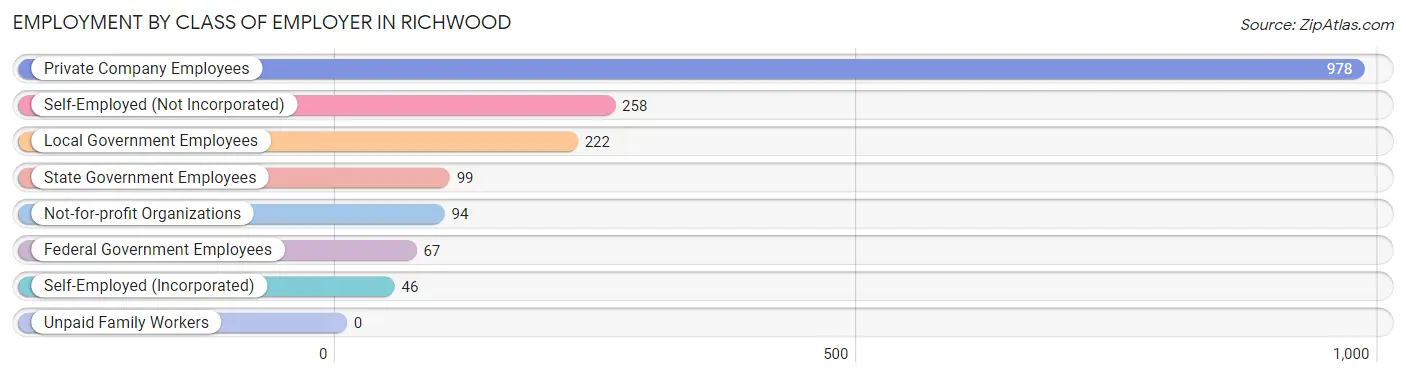
| Employer Class | # Employees | % Employees |
| Private Company Employees | 978 | 55.4% |
| Self-Employed (Incorporated) | 46 | 2.6% |
| Self-Employed (Not Incorporated) | 258 | 14.6% |
| Not-for-profit Organizations | 94 | 5.3% |
| Local Government Employees | 222 | 12.6% |
| State Government Employees | 99 | 5.6% |
| Federal Government Employees | 67 | 3.8% |
| Unpaid Family Workers | 0 | 0.0% |
| Total | 1,764 | 100.0% |
Employment Status by Age in Richwood
According to the labor force statistics for Richwood, out of the total population over 16 years of age (2,744), 69.9% or 1,918 individuals are in the labor force, with 7.4% or 142 of them unemployed. The age group with the highest labor force participation rate is 35 to 44 years, with 99.1% or 636 individuals in the labor force. Within the labor force, the 55 to 59 years age range has the highest percentage of unemployed individuals, with 28.9% or 55 of them being unemployed.
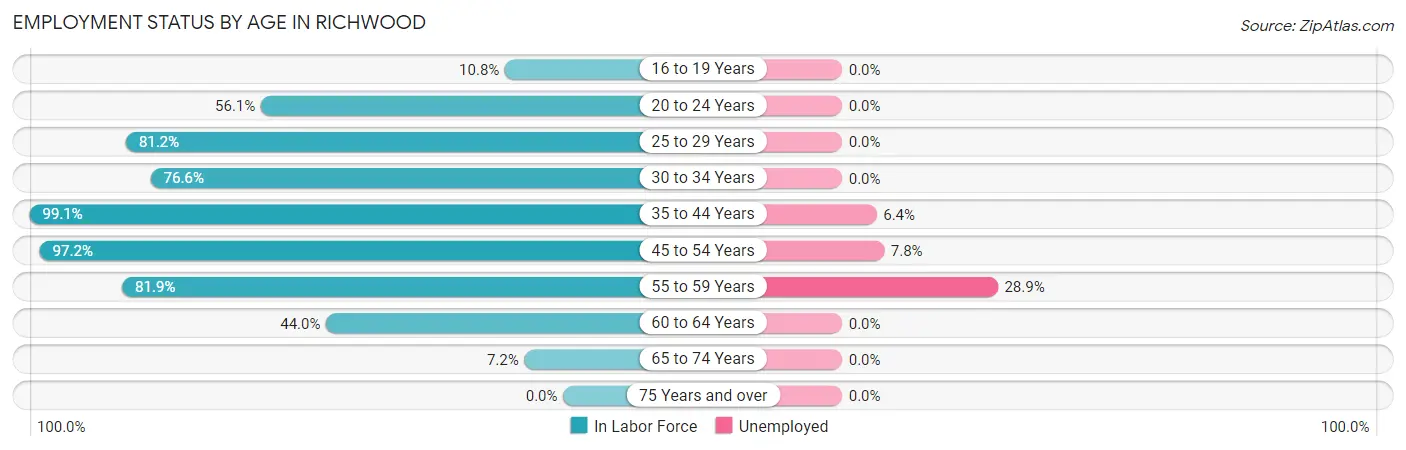
| Age Bracket | In Labor Force | Unemployed |
| 16 to 19 Years | 20 (10.8%) | 0 (0.0%) |
| 20 to 24 Years | 166 (56.1%) | 0 (0.0%) |
| 25 to 29 Years | 173 (81.2%) | 0 (0.0%) |
| 30 to 34 Years | 49 (76.6%) | 0 (0.0%) |
| 35 to 44 Years | 636 (99.1%) | 41 (6.4%) |
| 45 to 54 Years | 590 (97.2%) | 46 (7.8%) |
| 55 to 59 Years | 190 (81.9%) | 55 (28.9%) |
| 60 to 64 Years | 80 (44.0%) | 0 (0.0%) |
| 65 to 74 Years | 15 (7.2%) | 0 (0.0%) |
| 75 Years and over | 0 (0.0%) | 0 (0.0%) |
| Total | 1,918 (69.9%) | 142 (7.4%) |
Employment Status by Educational Attainment in Richwood
According to labor force statistics for Richwood, 88.6% of individuals (1,719) out of the total population between 25 and 64 years of age (1,940) are in the labor force, with 8.3% or 143 of them being unemployed. The group with the highest labor force participation rate are those with the educational attainment of bachelor's degree or higher, with 94.3% or 1,367 individuals in the labor force. Within the labor force, individuals with bachelor's degree or higher education have the highest percentage of unemployment, with 10.4% or 142 of them being unemployed.
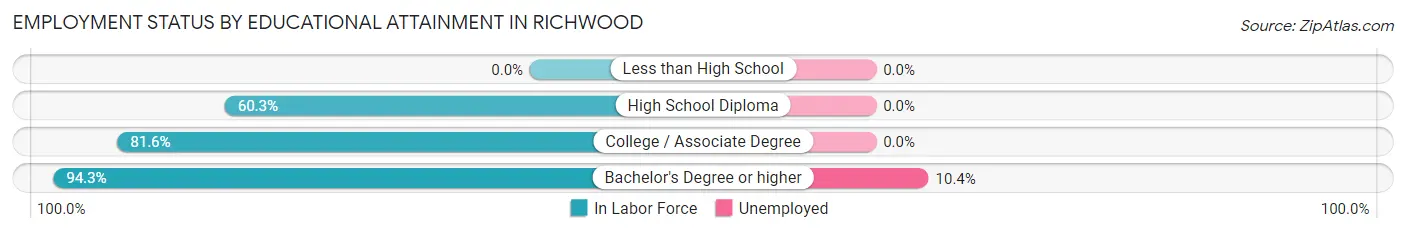
| Educational Attainment | In Labor Force | Unemployed |
| Less than High School | 0 (0.0%) | 0 (0.0%) |
| High School Diploma | 120 (60.3%) | 0 (0.0%) |
| College / Associate Degree | 231 (81.6%) | 0 (0.0%) |
| Bachelor's Degree or higher | 1,367 (94.3%) | 151 (10.4%) |
| Total | 1,719 (88.6%) | 161 (8.3%) |
Employment Occupations by Sex in Richwood
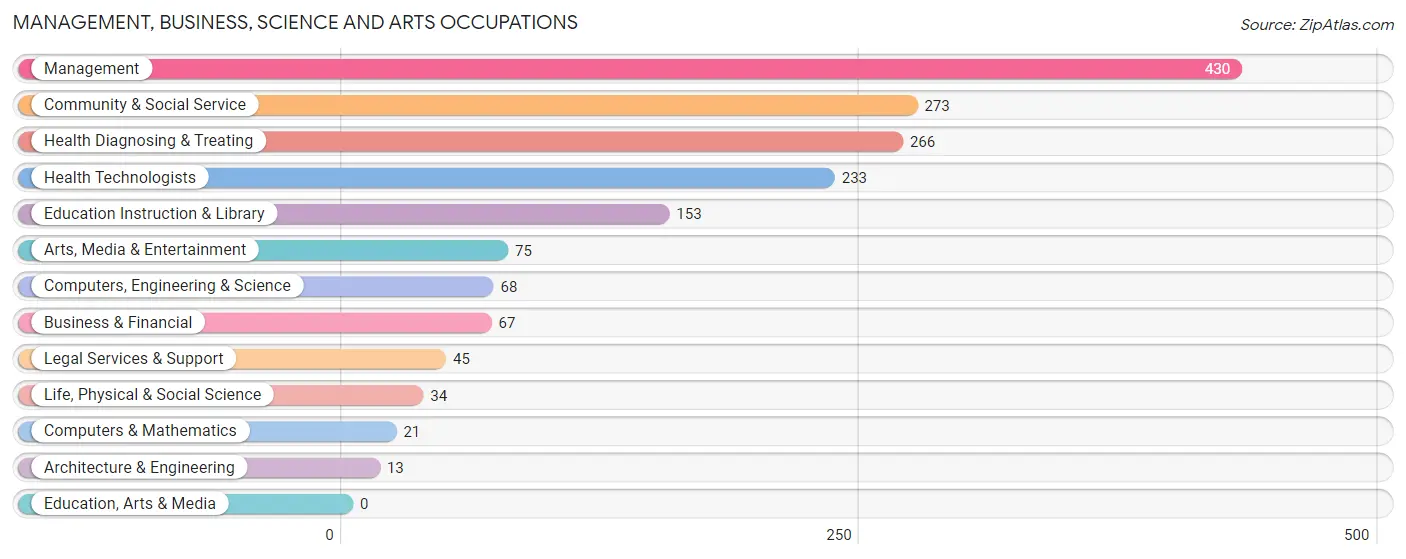
Management, Business, Science and Arts Occupations
The most common Management, Business, Science and Arts occupations in Richwood are Management (430 | 24.2%), Community & Social Service (273 | 15.4%), Health Diagnosing & Treating (266 | 15.0%), Health Technologists (233 | 13.1%), and Education Instruction & Library (153 | 8.6%).
Management, Business, Science and Arts Occupations by Sex
Within the Management, Business, Science and Arts occupations in Richwood, the most male-oriented occupations are Computers & Mathematics (100.0%), Legal Services & Support (100.0%), and Business & Financial (79.1%), while the most female-oriented occupations are Architecture & Engineering (100.0%), Life, Physical & Social Science (100.0%), and Education Instruction & Library (100.0%).
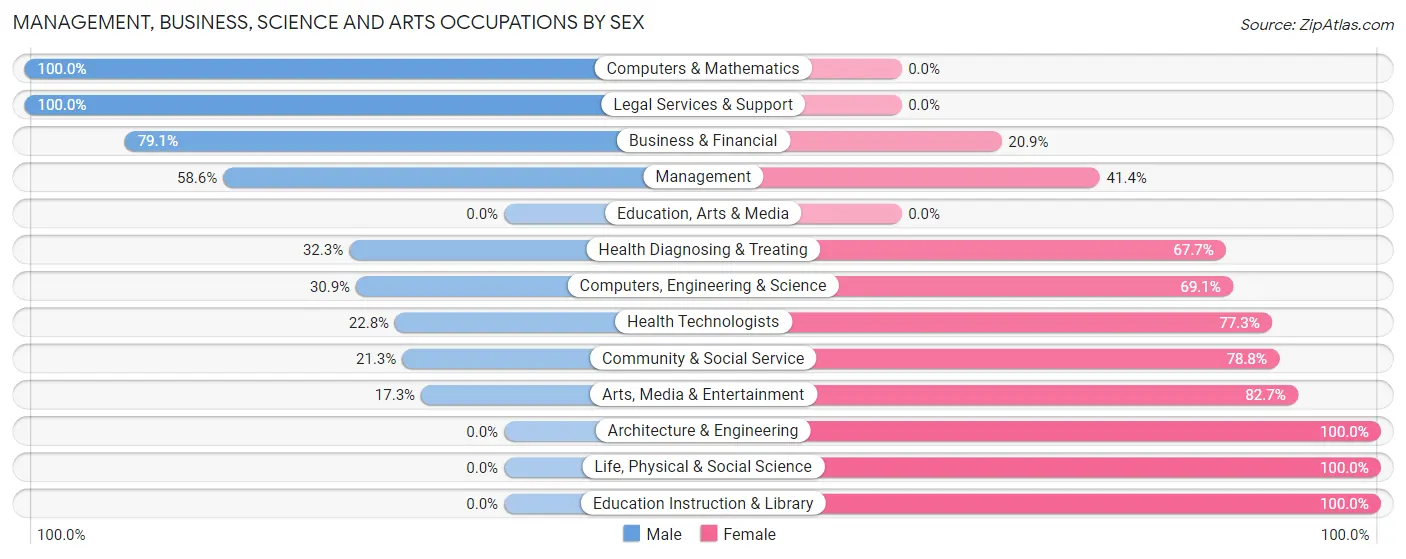
| Occupation | Male | Female |
| Management | 252 (58.6%) | 178 (41.4%) |
| Business & Financial | 53 (79.1%) | 14 (20.9%) |
| Computers, Engineering & Science | 21 (30.9%) | 47 (69.1%) |
| Computers & Mathematics | 21 (100.0%) | 0 (0.0%) |
| Architecture & Engineering | 0 (0.0%) | 13 (100.0%) |
| Life, Physical & Social Science | 0 (0.0%) | 34 (100.0%) |
| Community & Social Service | 58 (21.2%) | 215 (78.7%) |
| Education, Arts & Media | 0 (0.0%) | 0 (0.0%) |
| Legal Services & Support | 45 (100.0%) | 0 (0.0%) |
| Education Instruction & Library | 0 (0.0%) | 153 (100.0%) |
| Arts, Media & Entertainment | 13 (17.3%) | 62 (82.7%) |
| Health Diagnosing & Treating | 86 (32.3%) | 180 (67.7%) |
| Health Technologists | 53 (22.8%) | 180 (77.2%) |
| Total (Category) | 470 (42.6%) | 634 (57.4%) |
| Total (Overall) | 911 (51.3%) | 866 (48.7%) |
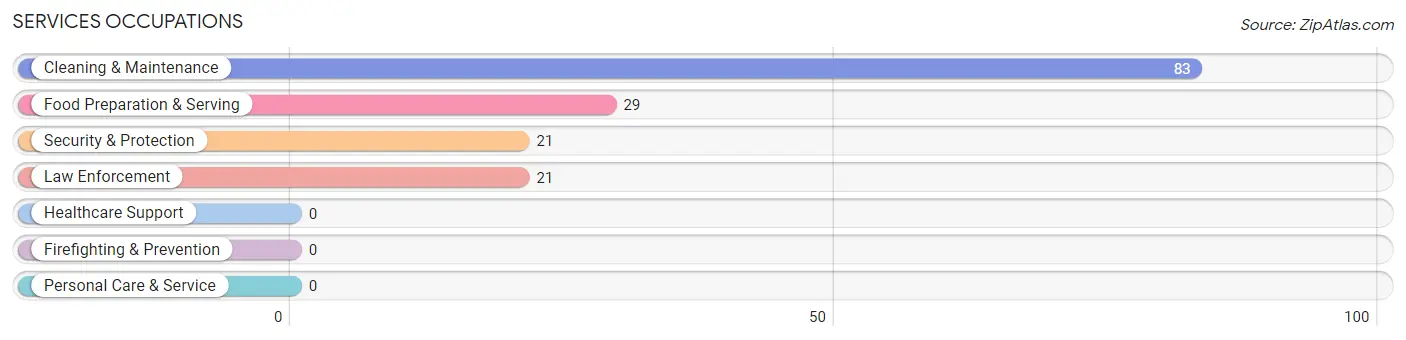
Services Occupations
The most common Services occupations in Richwood are Cleaning & Maintenance (83 | 4.7%), Food Preparation & Serving (29 | 1.6%), Security & Protection (21 | 1.2%), and Law Enforcement (21 | 1.2%).
Services Occupations by Sex
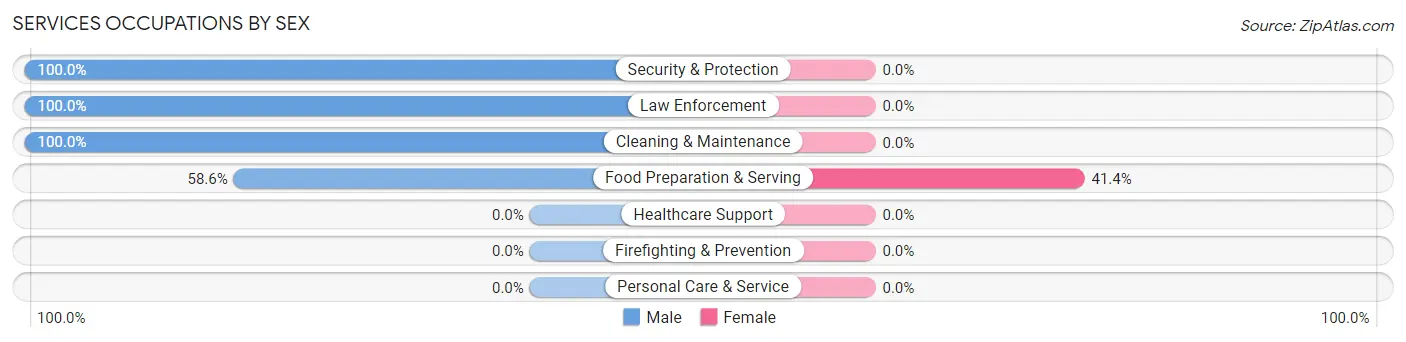
| Occupation | Male | Female |
| Healthcare Support | 0 (0.0%) | 0 (0.0%) |
| Security & Protection | 21 (100.0%) | 0 (0.0%) |
| Firefighting & Prevention | 0 (0.0%) | 0 (0.0%) |
| Law Enforcement | 21 (100.0%) | 0 (0.0%) |
| Food Preparation & Serving | 17 (58.6%) | 12 (41.4%) |
| Cleaning & Maintenance | 83 (100.0%) | 0 (0.0%) |
| Personal Care & Service | 0 (0.0%) | 0 (0.0%) |
| Total (Category) | 121 (91.0%) | 12 (9.0%) |
| Total (Overall) | 911 (51.3%) | 866 (48.7%) |
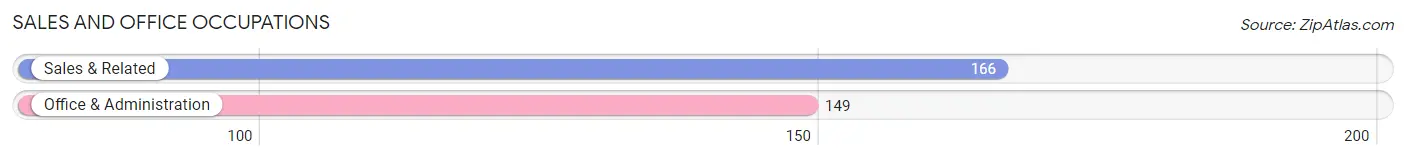
Sales and Office Occupations
The most common Sales and Office occupations in Richwood are Sales & Related (166 | 9.3%), and Office & Administration (149 | 8.4%).
Sales and Office Occupations by Sex
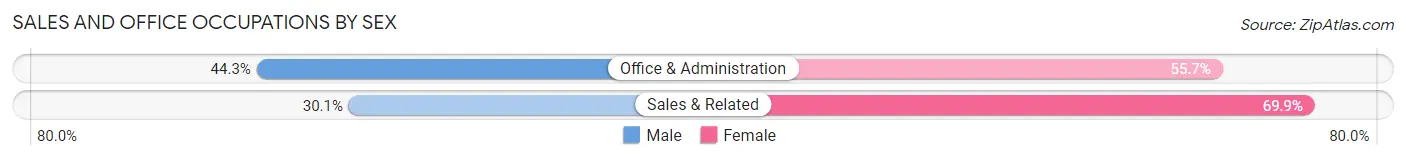
| Occupation | Male | Female |
| Sales & Related | 50 (30.1%) | 116 (69.9%) |
| Office & Administration | 66 (44.3%) | 83 (55.7%) |
| Total (Category) | 116 (36.8%) | 199 (63.2%) |
| Total (Overall) | 911 (51.3%) | 866 (48.7%) |
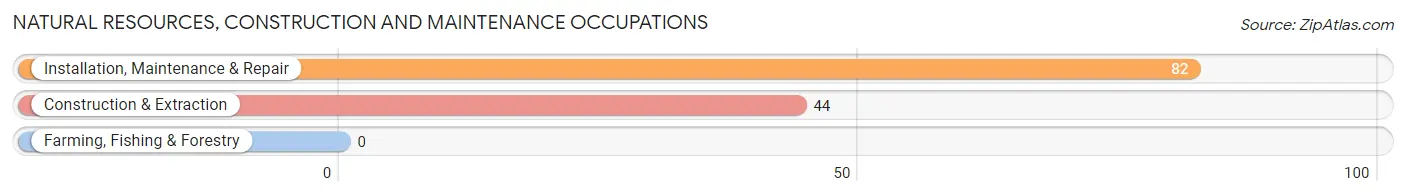
Natural Resources, Construction and Maintenance Occupations
The most common Natural Resources, Construction and Maintenance occupations in Richwood are Installation, Maintenance & Repair (82 | 4.6%), and Construction & Extraction (44 | 2.5%).
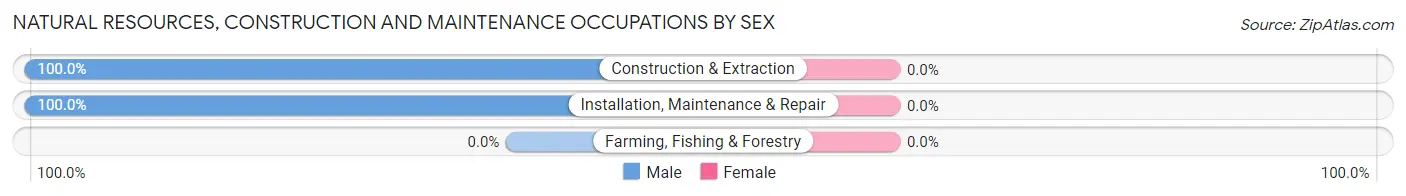
Natural Resources, Construction and Maintenance Occupations by Sex
| Occupation | Male | Female |
| Farming, Fishing & Forestry | 0 (0.0%) | 0 (0.0%) |
| Construction & Extraction | 44 (100.0%) | 0 (0.0%) |
| Installation, Maintenance & Repair | 82 (100.0%) | 0 (0.0%) |
| Total (Category) | 126 (100.0%) | 0 (0.0%) |
| Total (Overall) | 911 (51.3%) | 866 (48.7%) |
Production, Transportation and Moving Occupations
The most common Production, Transportation and Moving occupations in Richwood are Transportation (48 | 2.7%), Production (38 | 2.1%), and Material Moving (13 | 0.7%).
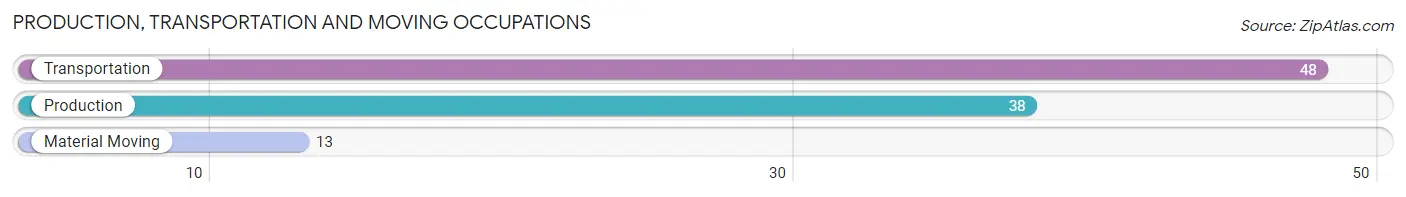
Production, Transportation and Moving Occupations by Sex
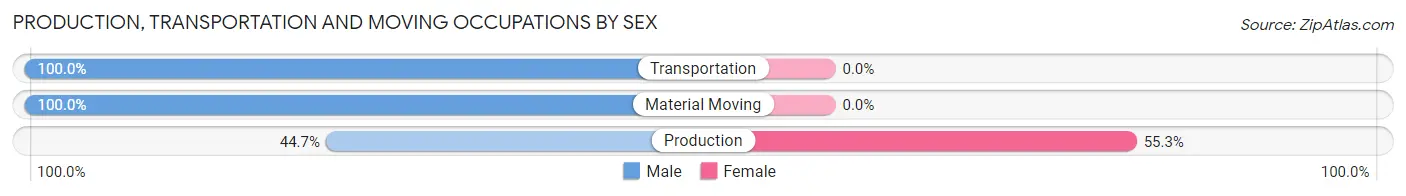
| Occupation | Male | Female |
| Production | 17 (44.7%) | 21 (55.3%) |
| Transportation | 48 (100.0%) | 0 (0.0%) |
| Material Moving | 13 (100.0%) | 0 (0.0%) |
| Total (Category) | 78 (78.8%) | 21 (21.2%) |
| Total (Overall) | 911 (51.3%) | 866 (48.7%) |
Employment Industries by Sex in Richwood
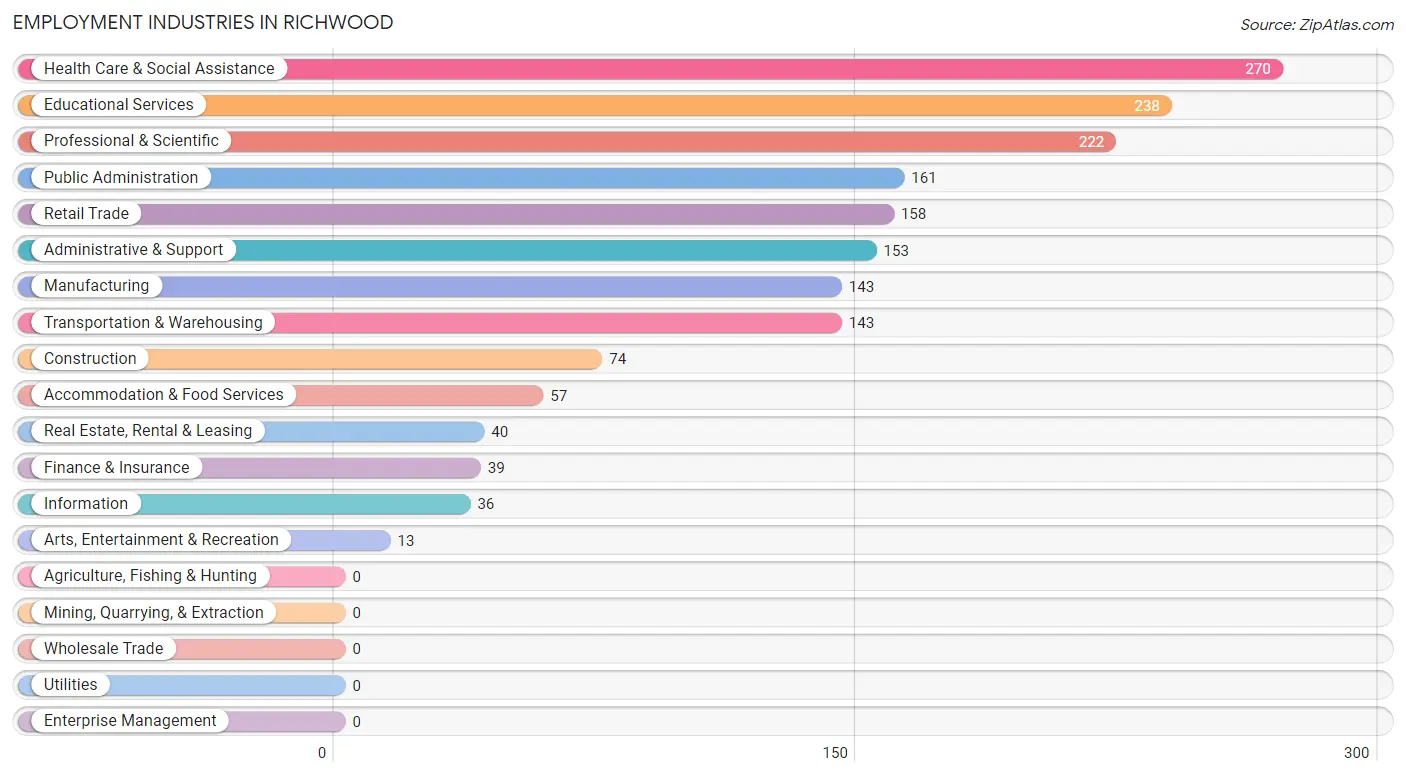
Employment Industries in Richwood
The major employment industries in Richwood include Health Care & Social Assistance (270 | 15.2%), Educational Services (238 | 13.4%), Professional & Scientific (222 | 12.5%), Public Administration (161 | 9.1%), and Retail Trade (158 | 8.9%).
Employment Industries by Sex in Richwood
The Richwood industries that see more men than women are Construction (100.0%), Finance & Insurance (100.0%), and Arts, Entertainment & Recreation (100.0%), whereas the industries that tend to have a higher number of women are Educational Services (81.5%), Accommodation & Food Services (78.9%), and Retail Trade (73.4%).
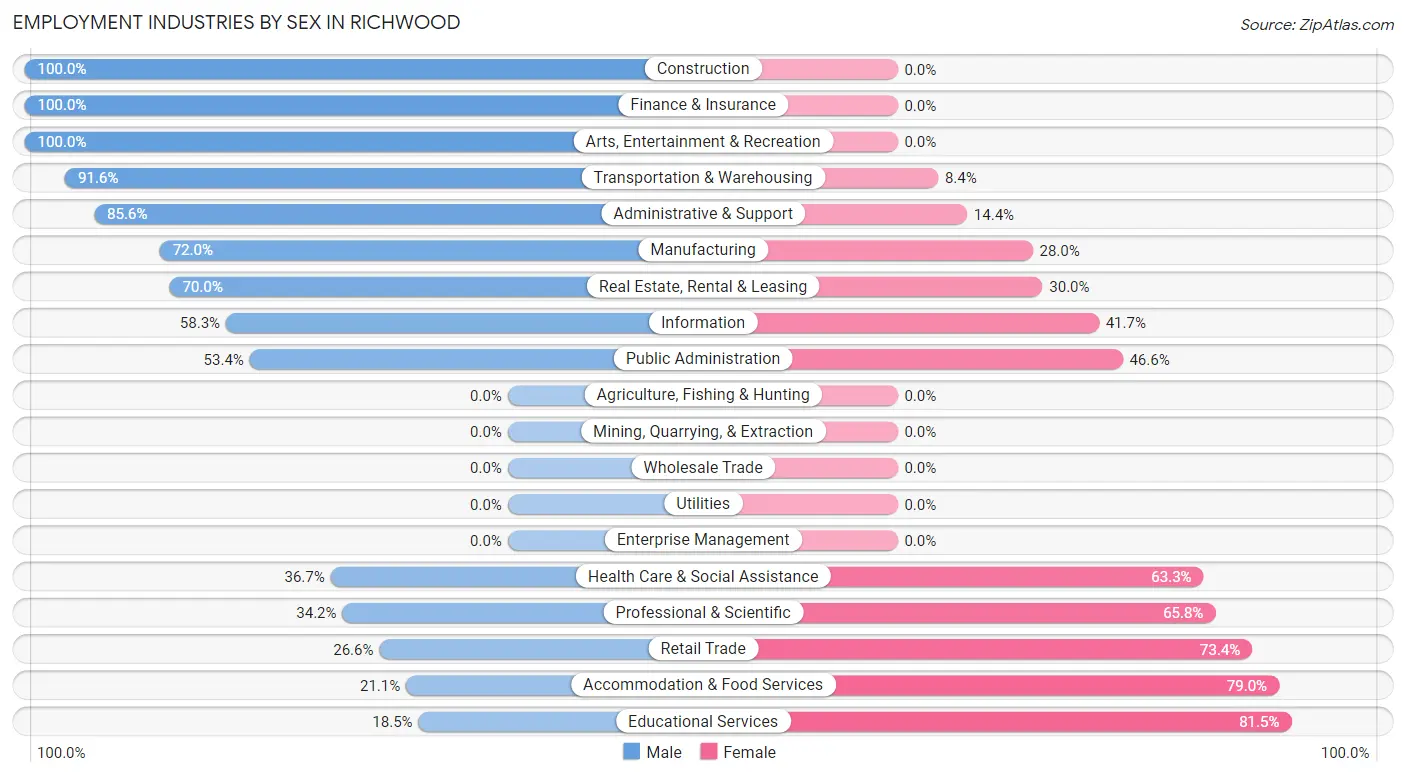
| Industry | Male | Female |
| Agriculture, Fishing & Hunting | 0 (0.0%) | 0 (0.0%) |
| Mining, Quarrying, & Extraction | 0 (0.0%) | 0 (0.0%) |
| Construction | 74 (100.0%) | 0 (0.0%) |
| Manufacturing | 103 (72.0%) | 40 (28.0%) |
| Wholesale Trade | 0 (0.0%) | 0 (0.0%) |
| Retail Trade | 42 (26.6%) | 116 (73.4%) |
| Transportation & Warehousing | 131 (91.6%) | 12 (8.4%) |
| Utilities | 0 (0.0%) | 0 (0.0%) |
| Information | 21 (58.3%) | 15 (41.7%) |
| Finance & Insurance | 39 (100.0%) | 0 (0.0%) |
| Real Estate, Rental & Leasing | 28 (70.0%) | 12 (30.0%) |
| Professional & Scientific | 76 (34.2%) | 146 (65.8%) |
| Enterprise Management | 0 (0.0%) | 0 (0.0%) |
| Administrative & Support | 131 (85.6%) | 22 (14.4%) |
| Educational Services | 44 (18.5%) | 194 (81.5%) |
| Health Care & Social Assistance | 99 (36.7%) | 171 (63.3%) |
| Arts, Entertainment & Recreation | 13 (100.0%) | 0 (0.0%) |
| Accommodation & Food Services | 12 (21.0%) | 45 (78.9%) |
| Public Administration | 86 (53.4%) | 75 (46.6%) |
| Total | 911 (51.3%) | 866 (48.7%) |
Education in Richwood
School Enrollment in Richwood
The most common levels of schooling among the 1,412 students in Richwood are middle school (365 | 25.9%), college / undergraduate (347 | 24.6%), and elementary school (222 | 15.7%).
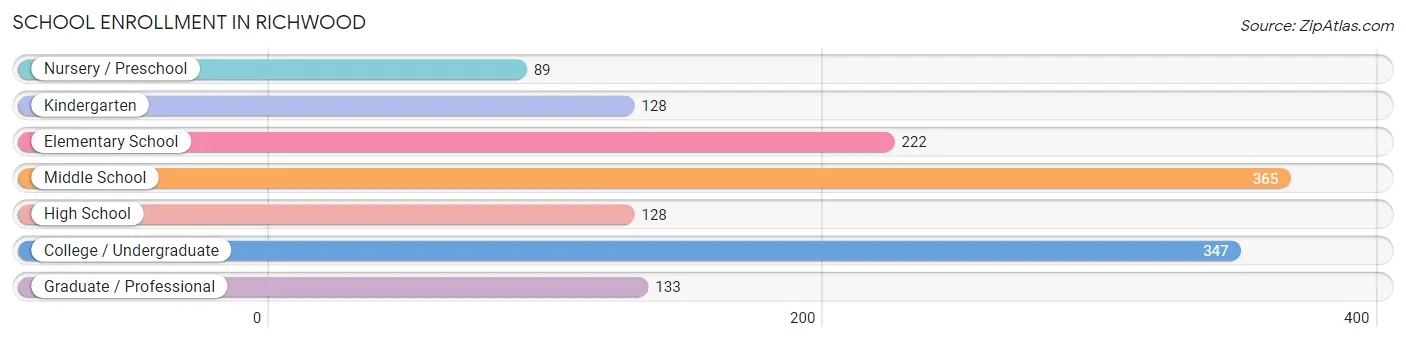
| School Level | # Students | % Students |
| Nursery / Preschool | 89 | 6.3% |
| Kindergarten | 128 | 9.1% |
| Elementary School | 222 | 15.7% |
| Middle School | 365 | 25.9% |
| High School | 128 | 9.1% |
| College / Undergraduate | 347 | 24.6% |
| Graduate / Professional | 133 | 9.4% |
| Total | 1,412 | 100.0% |
School Enrollment by Age by Funding Source in Richwood
Out of a total of 1,412 students who are enrolled in schools in Richwood, 483 (34.2%) attend a private institution, while the remaining 929 (65.8%) are enrolled in public schools. The age group of 3 to 4 year olds has the highest likelihood of being enrolled in private schools, with 34 (100.0% in the age bracket) enrolled. Conversely, the age group of 35 years and over has the lowest likelihood of being enrolled in a private school, with 14 (100.0% in the age bracket) attending a public institution.
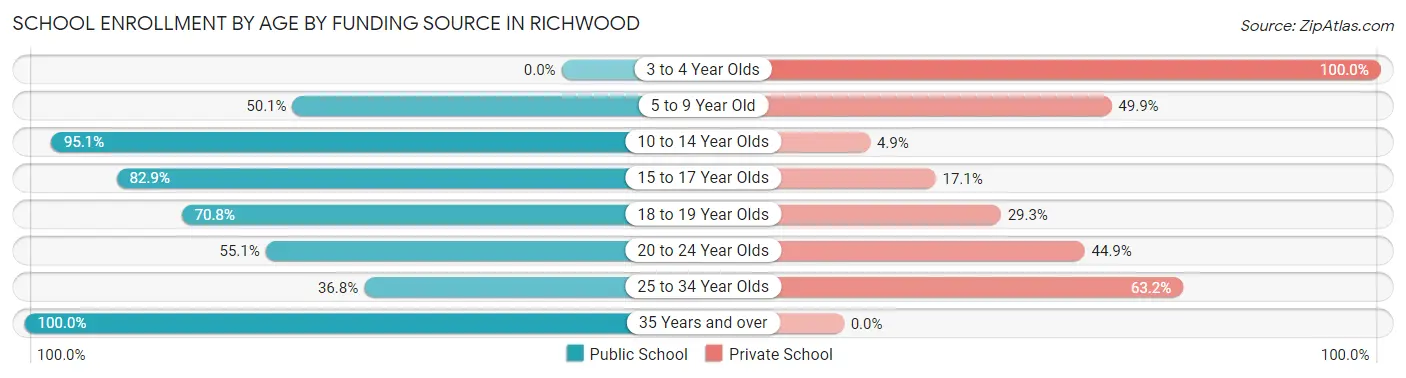
| Age Bracket | Public School | Private School |
| 3 to 4 Year Olds | 0 (0.0%) | 34 (100.0%) |
| 5 to 9 Year Old | 200 (50.1%) | 199 (49.9%) |
| 10 to 14 Year Olds | 369 (95.1%) | 19 (4.9%) |
| 15 to 17 Year Olds | 92 (82.9%) | 19 (17.1%) |
| 18 to 19 Year Olds | 75 (70.8%) | 31 (29.2%) |
| 20 to 24 Year Olds | 140 (55.1%) | 114 (44.9%) |
| 25 to 34 Year Olds | 39 (36.8%) | 67 (63.2%) |
| 35 Years and over | 14 (100.0%) | 0 (0.0%) |
| Total | 929 (65.8%) | 483 (34.2%) |
Educational Attainment by Field of Study in Richwood
Science & technology (250 | 15.9%), business (212 | 13.5%), engineering (208 | 13.2%), education (200 | 12.7%), and liberal arts & history (166 | 10.5%) are the most common fields of study among 1,575 individuals in Richwood who have obtained a bachelor's degree or higher.
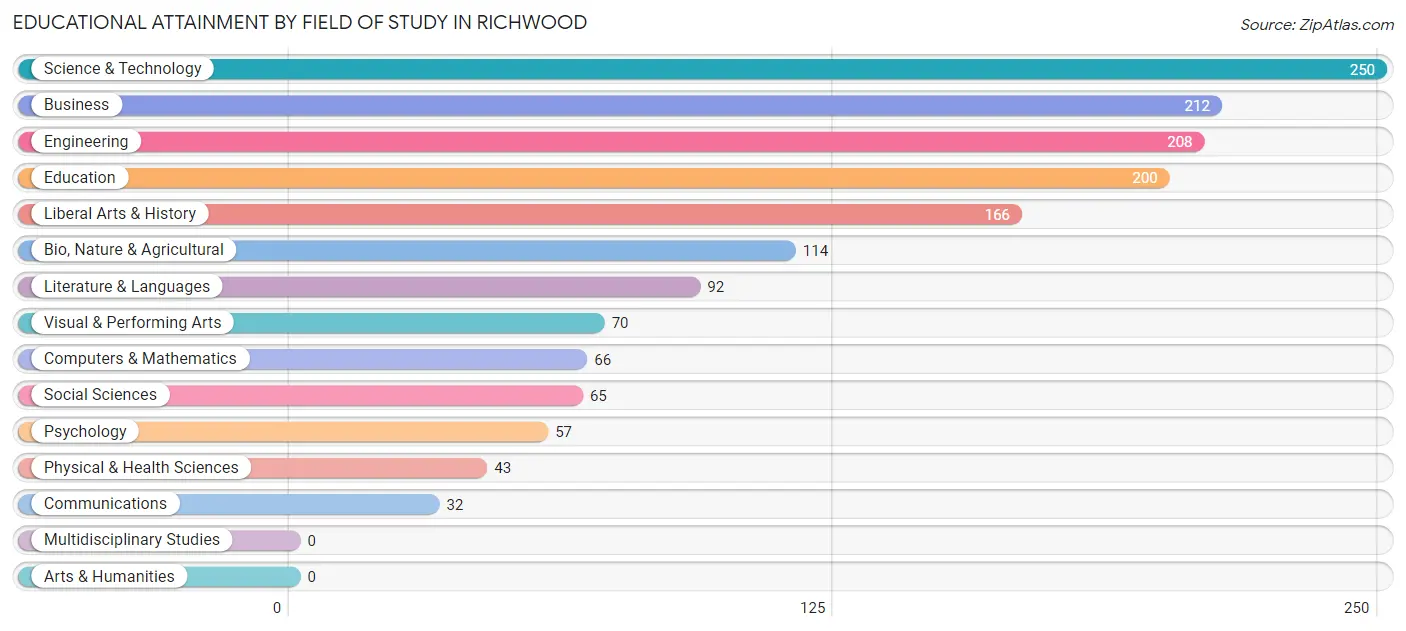
| Field of Study | # Graduates | % Graduates |
| Computers & Mathematics | 66 | 4.2% |
| Bio, Nature & Agricultural | 114 | 7.2% |
| Physical & Health Sciences | 43 | 2.7% |
| Psychology | 57 | 3.6% |
| Social Sciences | 65 | 4.1% |
| Engineering | 208 | 13.2% |
| Multidisciplinary Studies | 0 | 0.0% |
| Science & Technology | 250 | 15.9% |
| Business | 212 | 13.5% |
| Education | 200 | 12.7% |
| Literature & Languages | 92 | 5.8% |
| Liberal Arts & History | 166 | 10.5% |
| Visual & Performing Arts | 70 | 4.4% |
| Communications | 32 | 2.0% |
| Arts & Humanities | 0 | 0.0% |
| Total | 1,575 | 100.0% |
Transportation & Commute in Richwood
Vehicle Availability by Sex in Richwood
The most prevalent vehicle ownership categories in Richwood are males with 2 vehicles (334, accounting for 37.2%) and females with 2 vehicles (252, making up 39.3%).
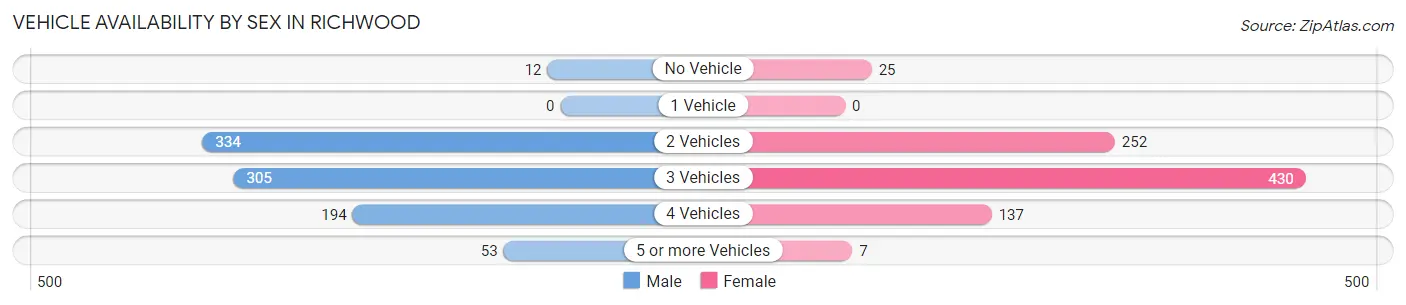
| Vehicles Available | Male | Female |
| No Vehicle | 12 (1.3%) | 25 (2.9%) |
| 1 Vehicle | 0 (0.0%) | 0 (0.0%) |
| 2 Vehicles | 334 (37.2%) | 252 (29.6%) |
| 3 Vehicles | 305 (34.0%) | 430 (50.5%) |
| 4 Vehicles | 194 (21.6%) | 137 (16.1%) |
| 5 or more Vehicles | 53 (5.9%) | 7 (0.8%) |
| Total | 898 (100.0%) | 851 (100.0%) |
Commute Time in Richwood
The most frequently occuring commute durations in Richwood are 30 to 34 minutes (299 commuters, 21.4%), 10 to 14 minutes (212 commuters, 15.2%), and 20 to 24 minutes (185 commuters, 13.3%).
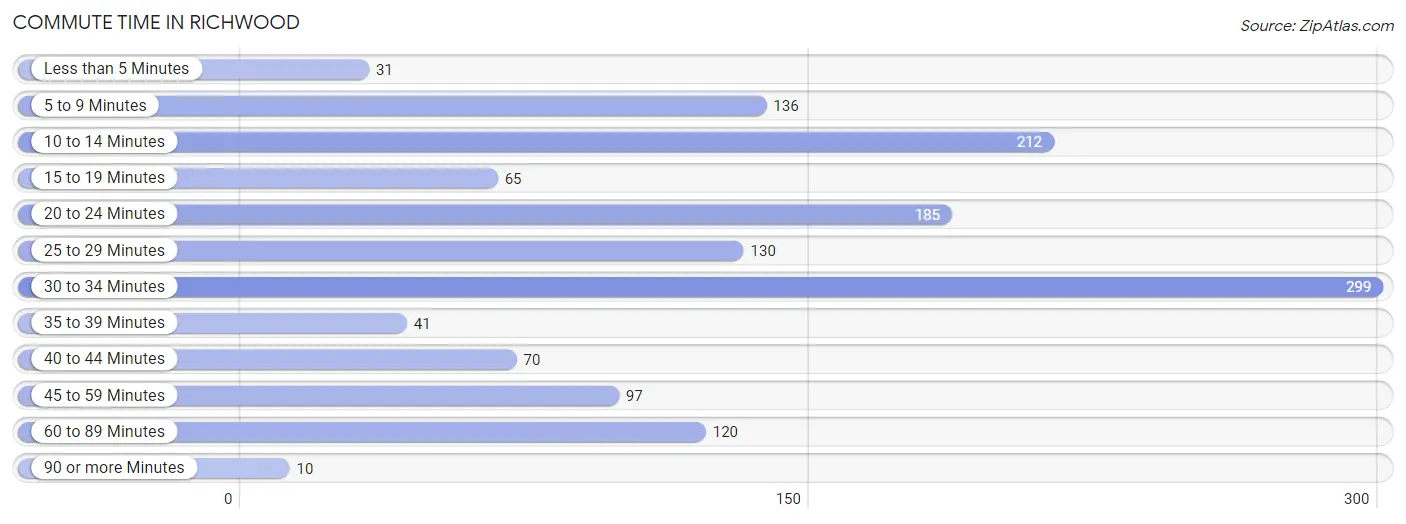
| Commute Time | # Commuters | % Commuters |
| Less than 5 Minutes | 31 | 2.2% |
| 5 to 9 Minutes | 136 | 9.7% |
| 10 to 14 Minutes | 212 | 15.2% |
| 15 to 19 Minutes | 65 | 4.7% |
| 20 to 24 Minutes | 185 | 13.3% |
| 25 to 29 Minutes | 130 | 9.3% |
| 30 to 34 Minutes | 299 | 21.4% |
| 35 to 39 Minutes | 41 | 2.9% |
| 40 to 44 Minutes | 70 | 5.0% |
| 45 to 59 Minutes | 97 | 7.0% |
| 60 to 89 Minutes | 120 | 8.6% |
| 90 or more Minutes | 10 | 0.7% |
Commute Time by Sex in Richwood
The most common commute times in Richwood are 30 to 34 minutes (176 commuters, 22.7%) for males and 30 to 34 minutes (123 commuters, 19.9%) for females.
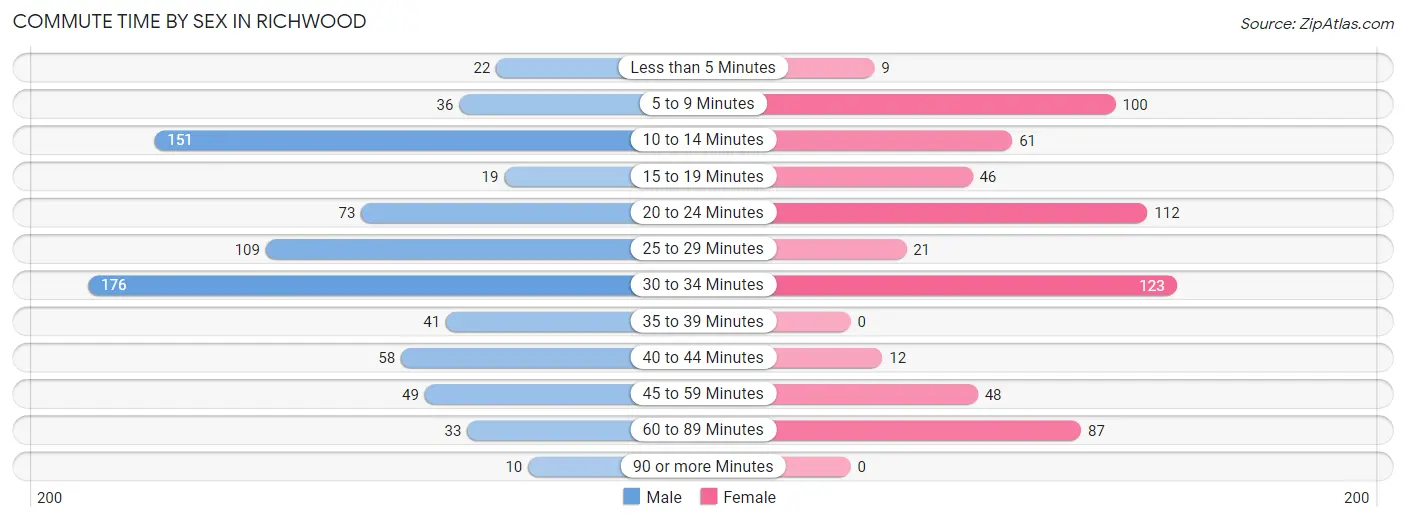
| Commute Time | Male | Female |
| Less than 5 Minutes | 22 (2.8%) | 9 (1.5%) |
| 5 to 9 Minutes | 36 (4.6%) | 100 (16.2%) |
| 10 to 14 Minutes | 151 (19.4%) | 61 (9.9%) |
| 15 to 19 Minutes | 19 (2.5%) | 46 (7.4%) |
| 20 to 24 Minutes | 73 (9.4%) | 112 (18.1%) |
| 25 to 29 Minutes | 109 (14.0%) | 21 (3.4%) |
| 30 to 34 Minutes | 176 (22.7%) | 123 (19.9%) |
| 35 to 39 Minutes | 41 (5.3%) | 0 (0.0%) |
| 40 to 44 Minutes | 58 (7.5%) | 12 (1.9%) |
| 45 to 59 Minutes | 49 (6.3%) | 48 (7.7%) |
| 60 to 89 Minutes | 33 (4.3%) | 87 (14.1%) |
| 90 or more Minutes | 10 (1.3%) | 0 (0.0%) |
Time of Departure to Work by Sex in Richwood
The most frequent times of departure to work in Richwood are 8:00 AM to 8:29 AM (167, 21.5%) for males and 7:00 AM to 7:29 AM (198, 32.0%) for females.
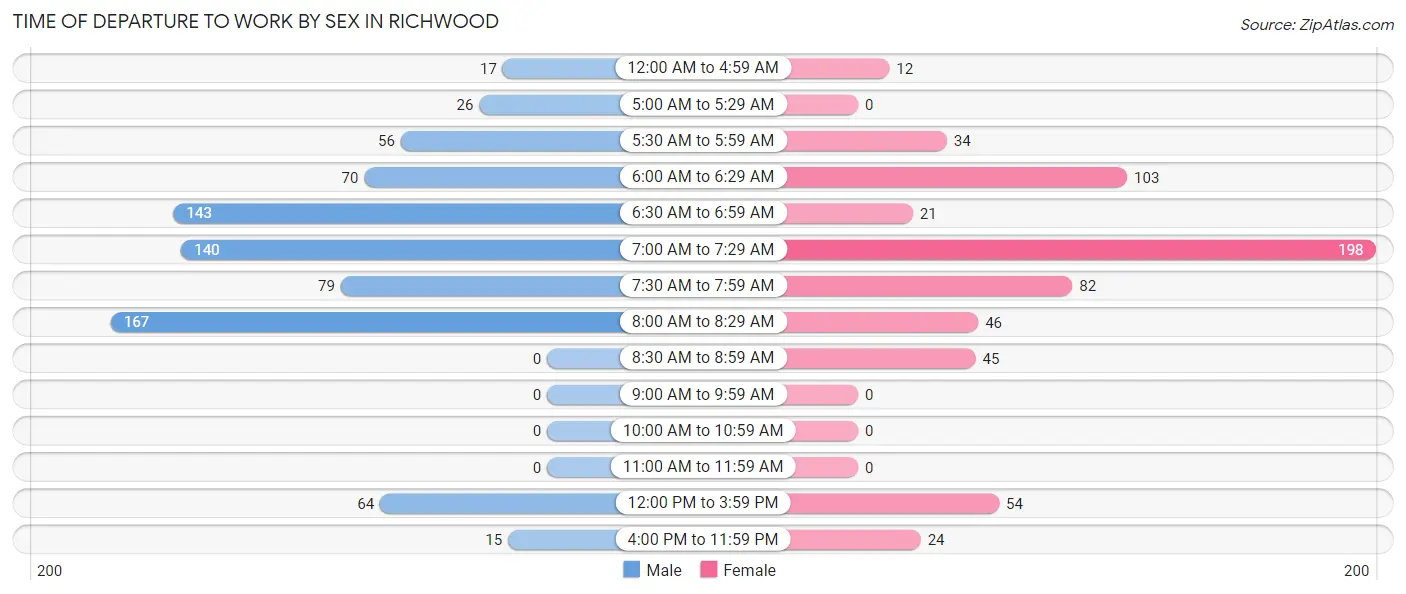
| Time of Departure | Male | Female |
| 12:00 AM to 4:59 AM | 17 (2.2%) | 12 (1.9%) |
| 5:00 AM to 5:29 AM | 26 (3.4%) | 0 (0.0%) |
| 5:30 AM to 5:59 AM | 56 (7.2%) | 34 (5.5%) |
| 6:00 AM to 6:29 AM | 70 (9.0%) | 103 (16.6%) |
| 6:30 AM to 6:59 AM | 143 (18.4%) | 21 (3.4%) |
| 7:00 AM to 7:29 AM | 140 (18.0%) | 198 (32.0%) |
| 7:30 AM to 7:59 AM | 79 (10.2%) | 82 (13.3%) |
| 8:00 AM to 8:29 AM | 167 (21.5%) | 46 (7.4%) |
| 8:30 AM to 8:59 AM | 0 (0.0%) | 45 (7.3%) |
| 9:00 AM to 9:59 AM | 0 (0.0%) | 0 (0.0%) |
| 10:00 AM to 10:59 AM | 0 (0.0%) | 0 (0.0%) |
| 11:00 AM to 11:59 AM | 0 (0.0%) | 0 (0.0%) |
| 12:00 PM to 3:59 PM | 64 (8.2%) | 54 (8.7%) |
| 4:00 PM to 11:59 PM | 15 (1.9%) | 24 (3.9%) |
| Total | 777 (100.0%) | 619 (100.0%) |
Housing Occupancy in Richwood
Occupancy by Ownership in Richwood
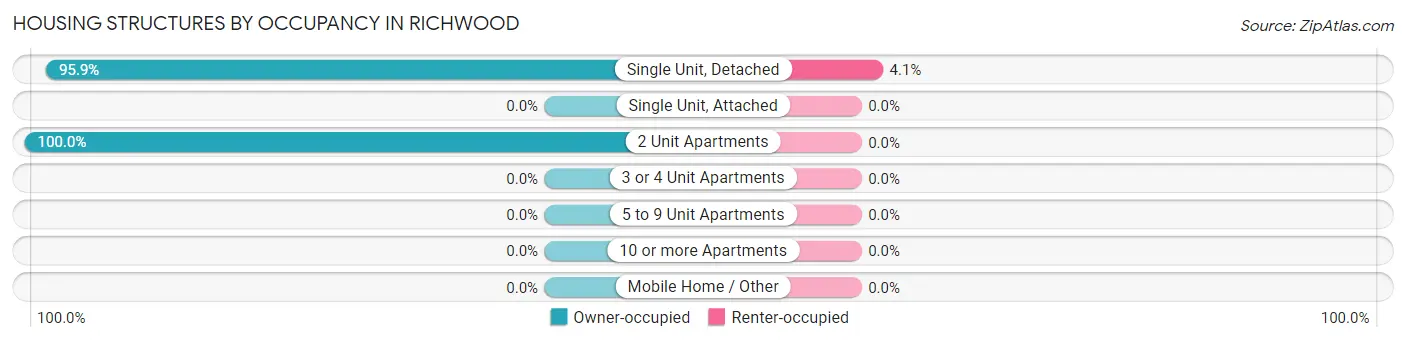
Of the total 1,002 dwellings in Richwood, owner-occupied units account for 961 (95.9%), while renter-occupied units make up 41 (4.1%).
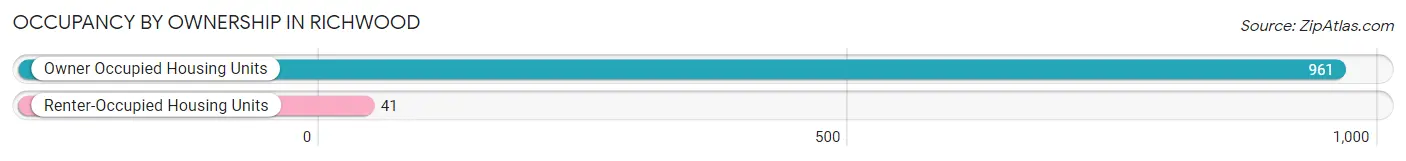
| Occupancy | # Housing Units | % Housing Units |
| Owner Occupied Housing Units | 961 | 95.9% |
| Renter-Occupied Housing Units | 41 | 4.1% |
| Total Occupied Housing Units | 1,002 | 100.0% |
Occupancy by Household Size in Richwood
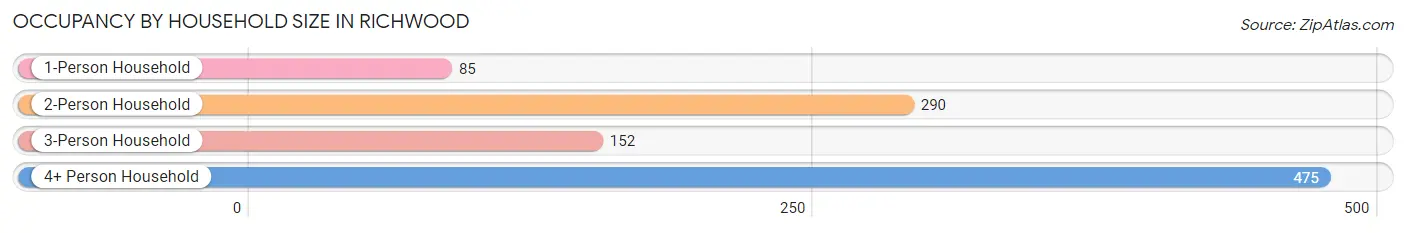
| Household Size | # Housing Units | % Housing Units |
| 1-Person Household | 85 | 8.5% |
| 2-Person Household | 290 | 28.9% |
| 3-Person Household | 152 | 15.2% |
| 4+ Person Household | 475 | 47.4% |
| Total Housing Units | 1,002 | 100.0% |
Occupancy by Ownership by Household Size in Richwood
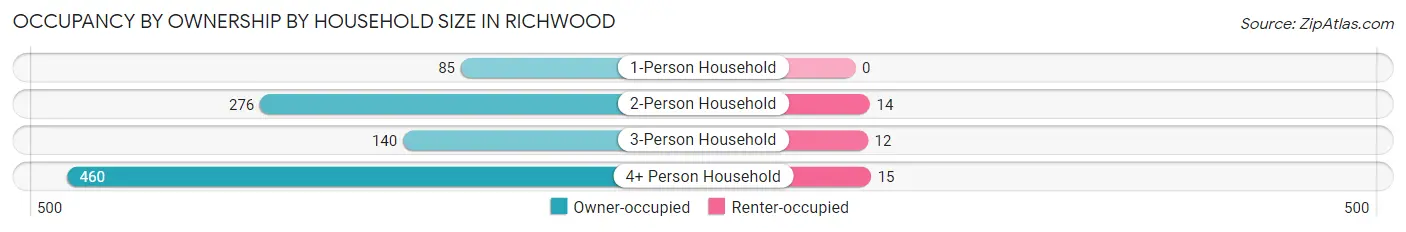
| Household Size | Owner-occupied | Renter-occupied |
| 1-Person Household | 85 (100.0%) | 0 (0.0%) |
| 2-Person Household | 276 (95.2%) | 14 (4.8%) |
| 3-Person Household | 140 (92.1%) | 12 (7.9%) |
| 4+ Person Household | 460 (96.8%) | 15 (3.2%) |
| Total Housing Units | 961 (95.9%) | 41 (4.1%) |
Occupancy by Educational Attainment in Richwood
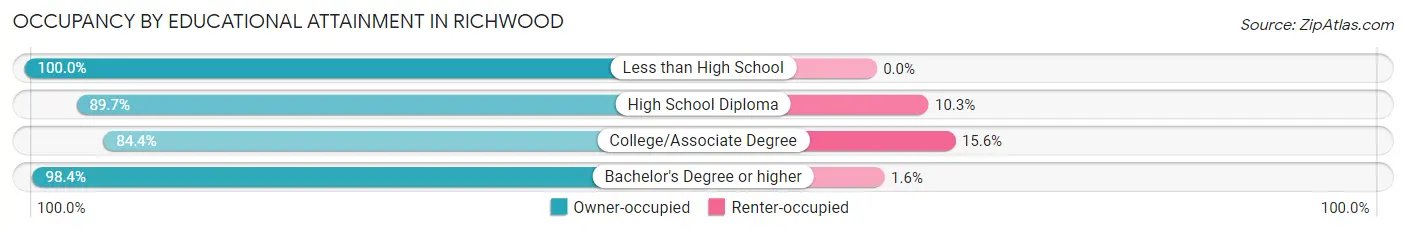
| Household Size | Owner-occupied | Renter-occupied |
| Less than High School | 12 (100.0%) | 0 (0.0%) |
| High School Diploma | 122 (89.7%) | 14 (10.3%) |
| College/Associate Degree | 81 (84.4%) | 15 (15.6%) |
| Bachelor's Degree or higher | 746 (98.4%) | 12 (1.6%) |
Occupancy by Age of Householder in Richwood
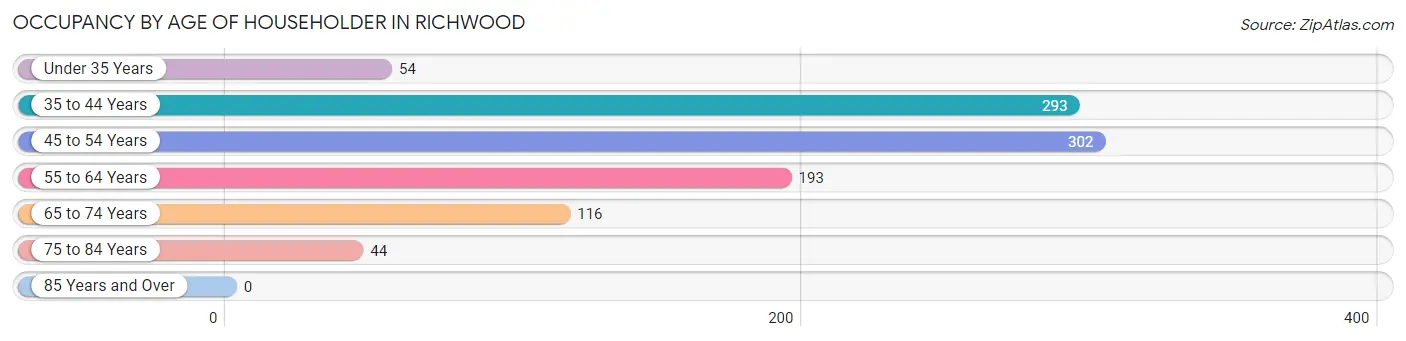
| Age Bracket | # Households | % Households |
| Under 35 Years | 54 | 5.4% |
| 35 to 44 Years | 293 | 29.2% |
| 45 to 54 Years | 302 | 30.1% |
| 55 to 64 Years | 193 | 19.3% |
| 65 to 74 Years | 116 | 11.6% |
| 75 to 84 Years | 44 | 4.4% |
| 85 Years and Over | 0 | 0.0% |
| Total | 1,002 | 100.0% |
Housing Finances in Richwood
Median Income by Occupancy in Richwood
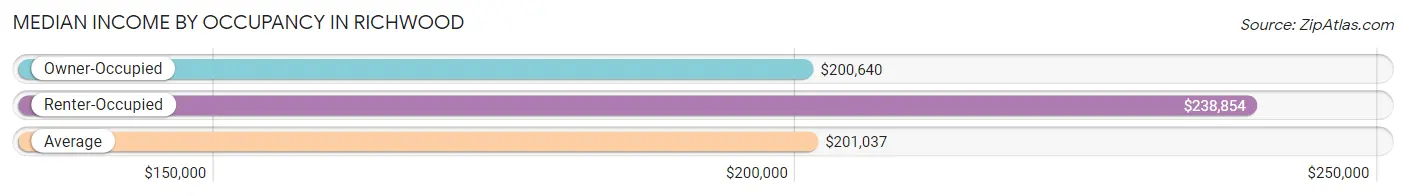
| Occupancy Type | # Households | Median Income |
| Owner-Occupied | 961 (95.9%) | $200,640 |
| Renter-Occupied | 41 (4.1%) | $238,854 |
| Average | 1,002 (100.0%) | $201,037 |
Occupancy by Householder Income Bracket in Richwood
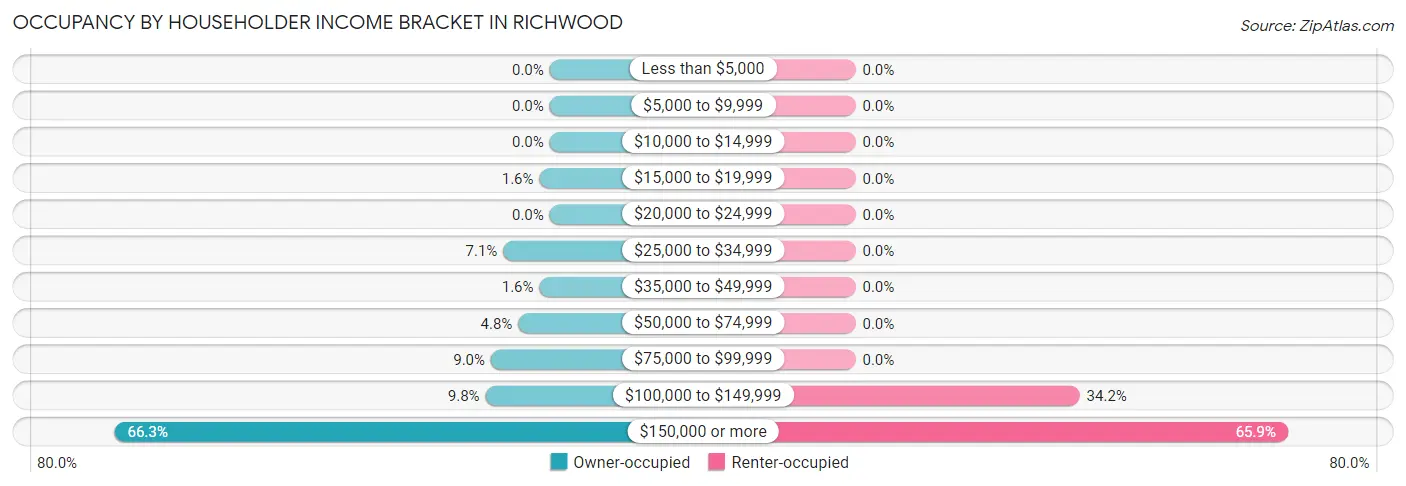
| Income Bracket | Owner-occupied | Renter-occupied |
| Less than $5,000 | 0 (0.0%) | 0 (0.0%) |
| $5,000 to $9,999 | 0 (0.0%) | 0 (0.0%) |
| $10,000 to $14,999 | 0 (0.0%) | 0 (0.0%) |
| $15,000 to $19,999 | 15 (1.6%) | 0 (0.0%) |
| $20,000 to $24,999 | 0 (0.0%) | 0 (0.0%) |
| $25,000 to $34,999 | 68 (7.1%) | 0 (0.0%) |
| $35,000 to $49,999 | 15 (1.6%) | 0 (0.0%) |
| $50,000 to $74,999 | 46 (4.8%) | 0 (0.0%) |
| $75,000 to $99,999 | 86 (8.9%) | 0 (0.0%) |
| $100,000 to $149,999 | 94 (9.8%) | 14 (34.2%) |
| $150,000 or more | 637 (66.3%) | 27 (65.8%) |
| Total | 961 (100.0%) | 41 (100.0%) |
Monthly Housing Cost Tiers in Richwood
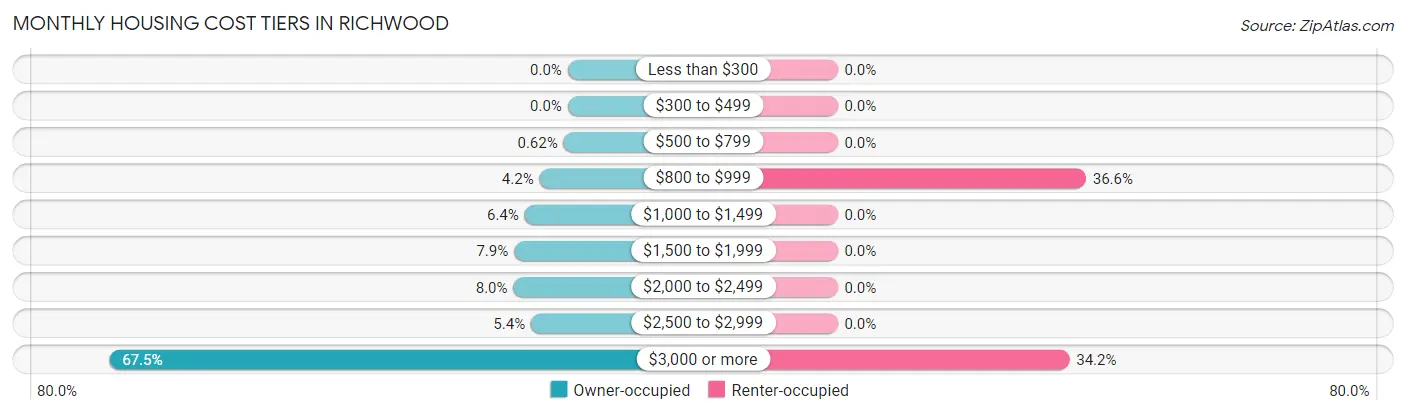
| Monthly Cost | Owner-occupied | Renter-occupied |
| Less than $300 | 0 (0.0%) | 0 (0.0%) |
| $300 to $499 | 0 (0.0%) | 0 (0.0%) |
| $500 to $799 | 6 (0.6%) | 0 (0.0%) |
| $800 to $999 | 40 (4.2%) | 15 (36.6%) |
| $1,000 to $1,499 | 61 (6.4%) | 0 (0.0%) |
| $1,500 to $1,999 | 76 (7.9%) | 0 (0.0%) |
| $2,000 to $2,499 | 77 (8.0%) | 0 (0.0%) |
| $2,500 to $2,999 | 52 (5.4%) | 0 (0.0%) |
| $3,000 or more | 649 (67.5%) | 14 (34.2%) |
| Total | 961 (100.0%) | 41 (100.0%) |
Physical Housing Characteristics in Richwood
Housing Structures in Richwood
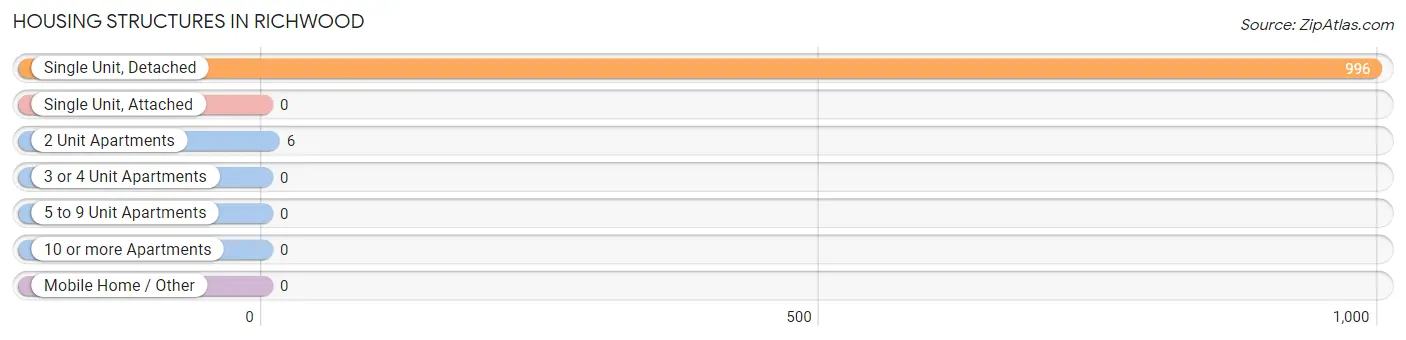
| Structure Type | # Housing Units | % Housing Units |
| Single Unit, Detached | 996 | 99.4% |
| Single Unit, Attached | 0 | 0.0% |
| 2 Unit Apartments | 6 | 0.6% |
| 3 or 4 Unit Apartments | 0 | 0.0% |
| 5 to 9 Unit Apartments | 0 | 0.0% |
| 10 or more Apartments | 0 | 0.0% |
| Mobile Home / Other | 0 | 0.0% |
| Total | 1,002 | 100.0% |
Housing Structures by Occupancy in Richwood
| Structure Type | Owner-occupied | Renter-occupied |
| Single Unit, Detached | 955 (95.9%) | 41 (4.1%) |
| Single Unit, Attached | 0 (0.0%) | 0 (0.0%) |
| 2 Unit Apartments | 6 (100.0%) | 0 (0.0%) |
| 3 or 4 Unit Apartments | 0 (0.0%) | 0 (0.0%) |
| 5 to 9 Unit Apartments | 0 (0.0%) | 0 (0.0%) |
| 10 or more Apartments | 0 (0.0%) | 0 (0.0%) |
| Mobile Home / Other | 0 (0.0%) | 0 (0.0%) |
| Total | 961 (95.9%) | 41 (4.1%) |
Housing Structures by Number of Rooms in Richwood
| Number of Rooms | Owner-occupied | Renter-occupied |
| 1 Room | 0 (0.0%) | 0 (0.0%) |
| 2 or 3 Rooms | 0 (0.0%) | 0 (0.0%) |
| 4 or 5 Rooms | 55 (5.7%) | 0 (0.0%) |
| 6 or 7 Rooms | 165 (17.2%) | 0 (0.0%) |
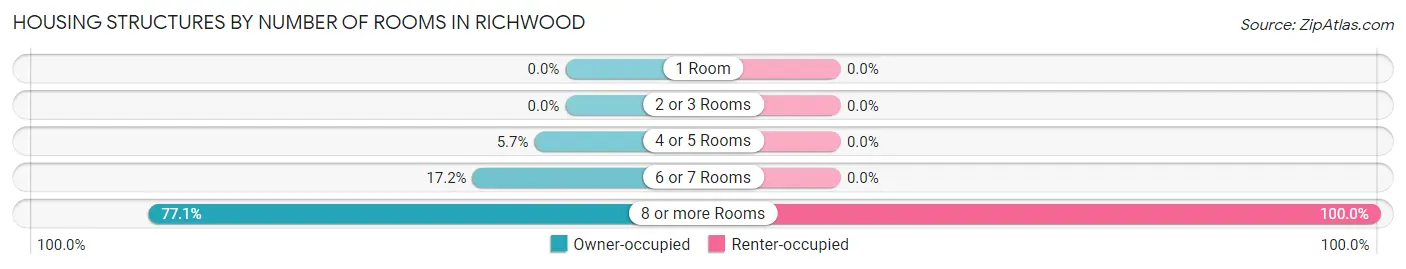
| 8 or more Rooms | 741 (77.1%) | 41 (100.0%) |
| Total | 961 (100.0%) | 41 (100.0%) |
Housing Structure by Heating Type in Richwood
| Heating Type | Owner-occupied | Renter-occupied |
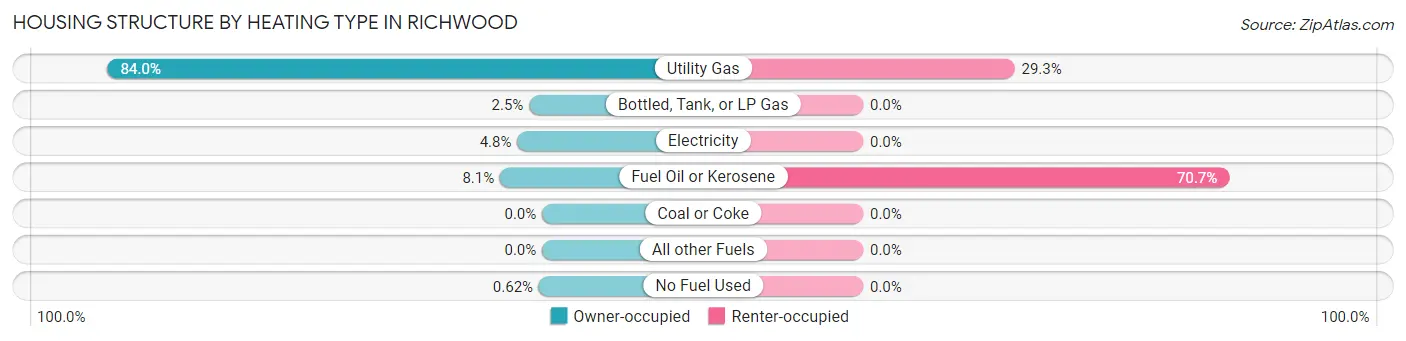
| Utility Gas | 807 (84.0%) | 12 (29.3%) |
| Bottled, Tank, or LP Gas | 24 (2.5%) | 0 (0.0%) |
| Electricity | 46 (4.8%) | 0 (0.0%) |
| Fuel Oil or Kerosene | 78 (8.1%) | 29 (70.7%) |
| Coal or Coke | 0 (0.0%) | 0 (0.0%) |
| All other Fuels | 0 (0.0%) | 0 (0.0%) |
| No Fuel Used | 6 (0.6%) | 0 (0.0%) |
| Total | 961 (100.0%) | 41 (100.0%) |
Household Vehicle Usage in Richwood
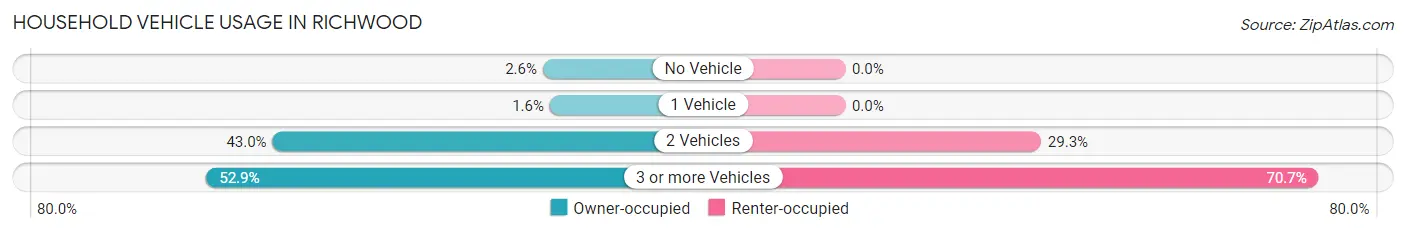
| Vehicles per Household | Owner-occupied | Renter-occupied |
| No Vehicle | 25 (2.6%) | 0 (0.0%) |
| 1 Vehicle | 15 (1.6%) | 0 (0.0%) |
| 2 Vehicles | 413 (43.0%) | 12 (29.3%) |
| 3 or more Vehicles | 508 (52.9%) | 29 (70.7%) |
| Total | 961 (100.0%) | 41 (100.0%) |
Real Estate & Mortgages in Richwood
Real Estate and Mortgage Overview in Richwood
| Characteristic | Without Mortgage | With Mortgage |
| Housing Units | 130 | 831 |
| Median Property Value | $356,100 | $609,300 |
| Median Household Income | - | - |
| Monthly Housing Costs | $1,225 | $649 |
| Real Estate Taxes | $8,580 | $0 |
Property Value by Mortgage Status in Richwood
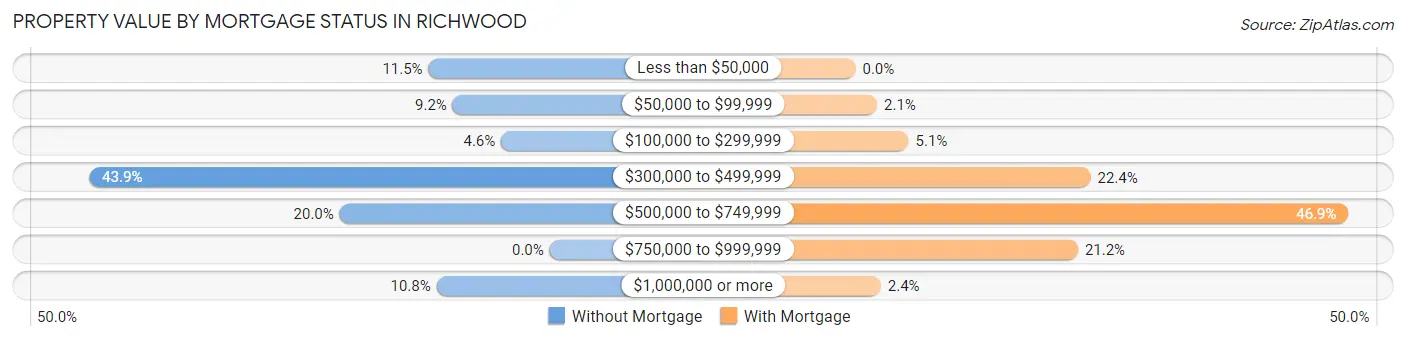
| Property Value | Without Mortgage | With Mortgage |
| Less than $50,000 | 15 (11.5%) | 0 (0.0%) |
| $50,000 to $99,999 | 12 (9.2%) | 17 (2.1%) |
| $100,000 to $299,999 | 6 (4.6%) | 42 (5.1%) |
| $300,000 to $499,999 | 57 (43.9%) | 186 (22.4%) |
| $500,000 to $749,999 | 26 (20.0%) | 390 (46.9%) |
| $750,000 to $999,999 | 0 (0.0%) | 176 (21.2%) |
| $1,000,000 or more | 14 (10.8%) | 20 (2.4%) |
| Total | 130 (100.0%) | 831 (100.0%) |
Household Income by Mortgage Status in Richwood
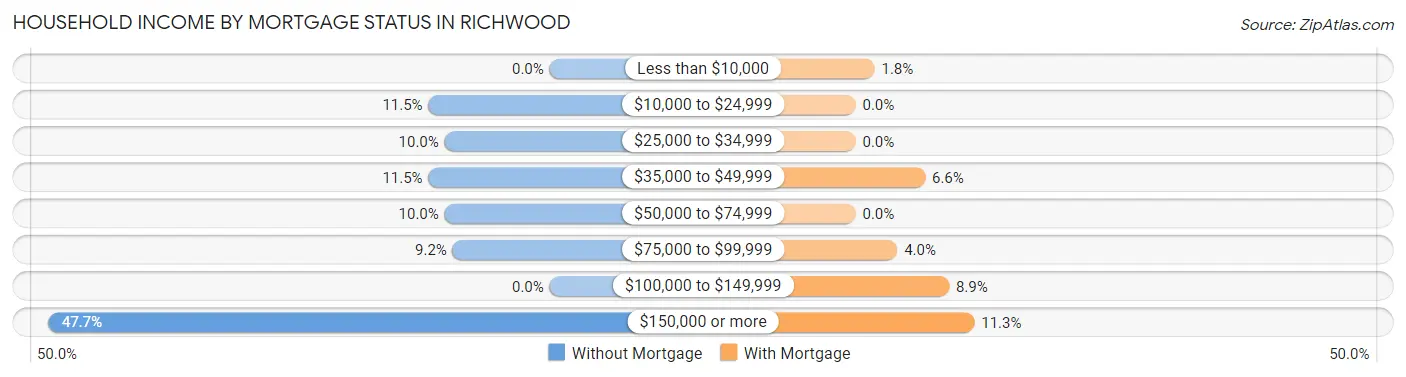
| Household Income | Without Mortgage | With Mortgage |
| Less than $10,000 | 0 (0.0%) | 15 (1.8%) |
| $10,000 to $24,999 | 15 (11.5%) | 0 (0.0%) |
| $25,000 to $34,999 | 13 (10.0%) | 0 (0.0%) |
| $35,000 to $49,999 | 15 (11.5%) | 55 (6.6%) |
| $50,000 to $74,999 | 13 (10.0%) | 0 (0.0%) |
| $75,000 to $99,999 | 12 (9.2%) | 33 (4.0%) |
| $100,000 to $149,999 | 0 (0.0%) | 74 (8.9%) |
| $150,000 or more | 62 (47.7%) | 94 (11.3%) |
| Total | 130 (100.0%) | 831 (100.0%) |
Property Value to Household Income Ratio in Richwood
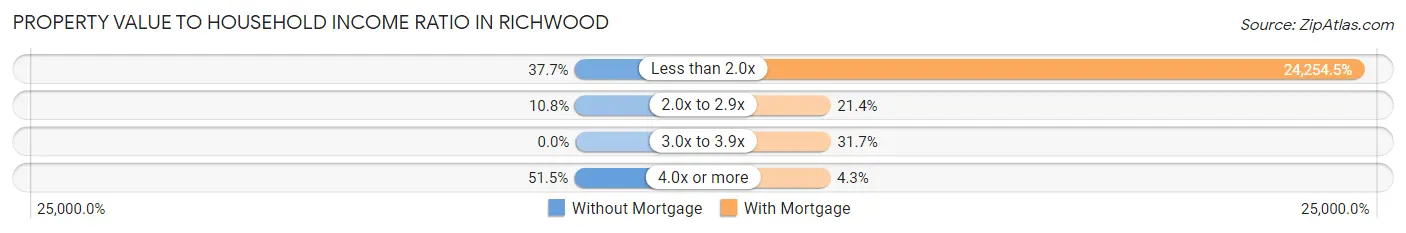
| Value-to-Income Ratio | Without Mortgage | With Mortgage |
| Less than 2.0x | 49 (37.7%) | 201,555 (24,254.5%) |
| 2.0x to 2.9x | 14 (10.8%) | 178 (21.4%) |
| 3.0x to 3.9x | 0 (0.0%) | 263 (31.7%) |
| 4.0x or more | 67 (51.5%) | 36 (4.3%) |
| Total | 130 (100.0%) | 831 (100.0%) |
Real Estate Taxes by Mortgage Status in Richwood
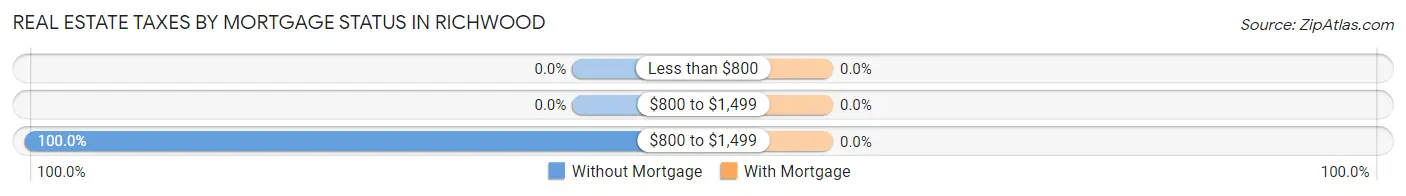
| Property Taxes | Without Mortgage | With Mortgage |
| Less than $800 | 0 (0.0%) | 0 (0.0%) |
| $800 to $1,499 | 0 (0.0%) | 0 (0.0%) |
| $800 to $1,499 | 130 (100.0%) | 0 (0.0%) |
| Total | 130 (100.0%) | 831 (100.0%) |
Health & Disability in Richwood
Health Insurance Coverage by Age in Richwood
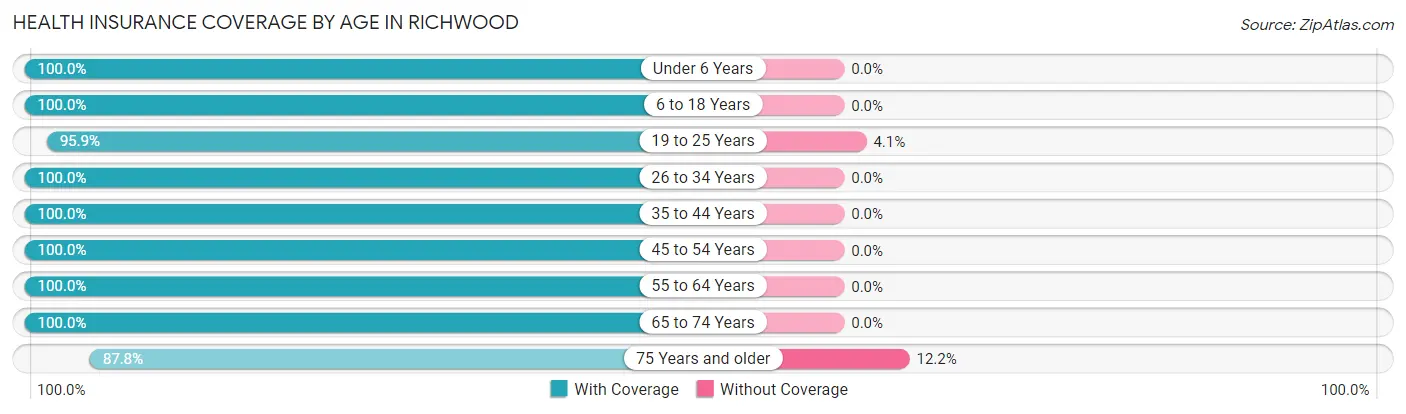
| Age Bracket | With Coverage | Without Coverage |
| Under 6 Years | 168 (100.0%) | 0 (0.0%) |
| 6 to 18 Years | 917 (100.0%) | 0 (0.0%) |
| 19 to 25 Years | 348 (95.9%) | 15 (4.1%) |
| 26 to 34 Years | 223 (100.0%) | 0 (0.0%) |
| 35 to 44 Years | 642 (100.0%) | 0 (0.0%) |
| 45 to 54 Years | 607 (100.0%) | 0 (0.0%) |
| 55 to 64 Years | 414 (100.0%) | 0 (0.0%) |
| 65 to 74 Years | 207 (100.0%) | 0 (0.0%) |
| 75 Years and older | 101 (87.8%) | 14 (12.2%) |
| Total | 3,627 (99.2%) | 29 (0.8%) |
Health Insurance Coverage by Citizenship Status in Richwood
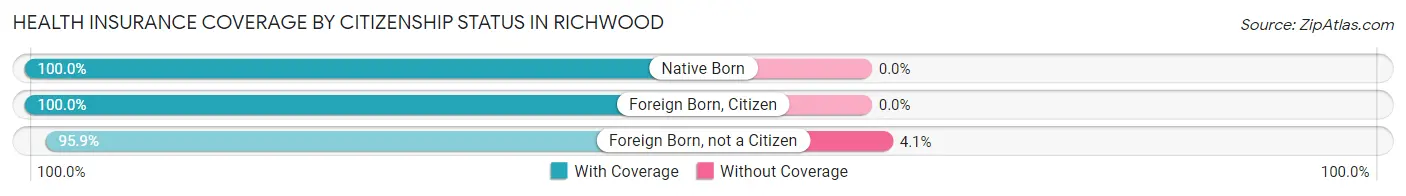
| Citizenship Status | With Coverage | Without Coverage |
| Native Born | 168 (100.0%) | 0 (0.0%) |
| Foreign Born, Citizen | 917 (100.0%) | 0 (0.0%) |
| Foreign Born, not a Citizen | 348 (95.9%) | 15 (4.1%) |
Health Insurance Coverage by Household Income in Richwood
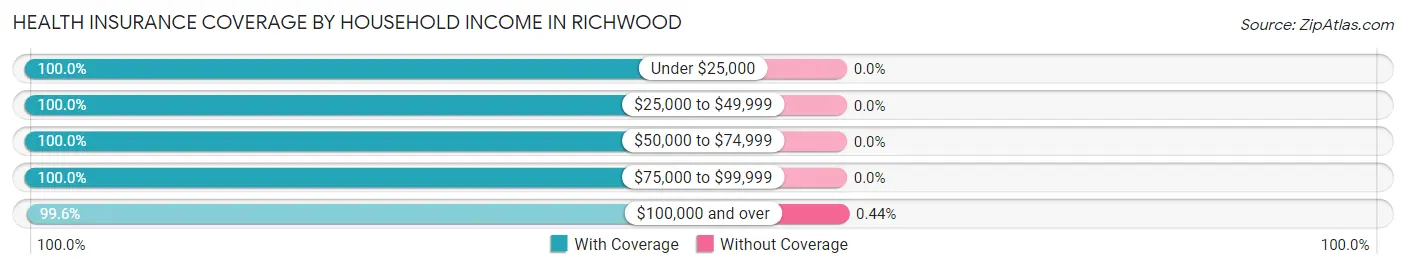
| Household Income | With Coverage | Without Coverage |
| Under $25,000 | 15 (100.0%) | 0 (0.0%) |
| $25,000 to $49,999 | 151 (100.0%) | 0 (0.0%) |
| $50,000 to $74,999 | 92 (100.0%) | 0 (0.0%) |
| $75,000 to $99,999 | 196 (100.0%) | 0 (0.0%) |
| $100,000 and over | 3,162 (99.6%) | 14 (0.4%) |
Public vs Private Health Insurance Coverage by Age in Richwood
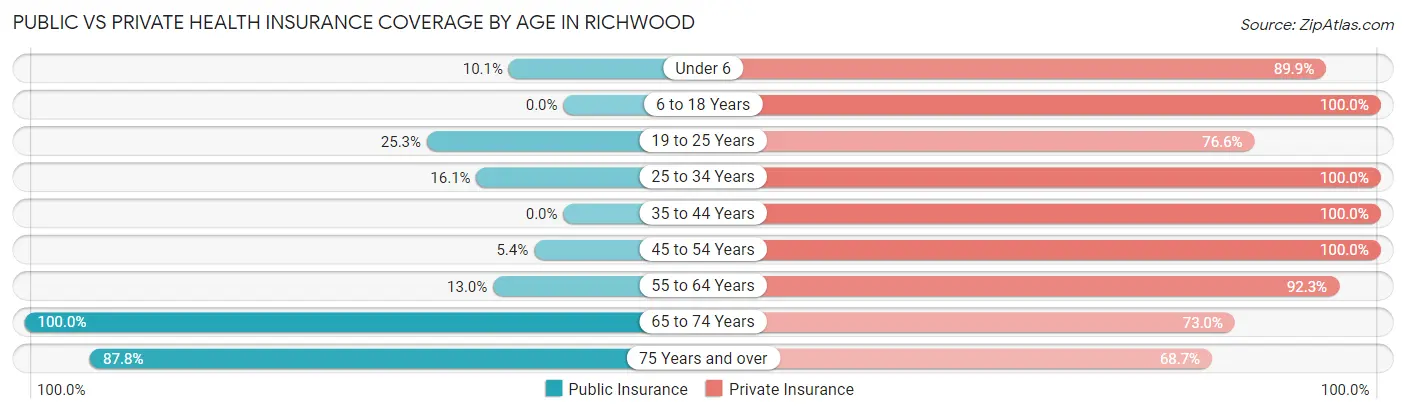
| Age Bracket | Public Insurance | Private Insurance |
| Under 6 | 17 (10.1%) | 151 (89.9%) |
| 6 to 18 Years | 0 (0.0%) | 917 (100.0%) |
| 19 to 25 Years | 92 (25.3%) | 278 (76.6%) |
| 25 to 34 Years | 36 (16.1%) | 223 (100.0%) |
| 35 to 44 Years | 0 (0.0%) | 642 (100.0%) |
| 45 to 54 Years | 33 (5.4%) | 607 (100.0%) |
| 55 to 64 Years | 54 (13.0%) | 382 (92.3%) |
| 65 to 74 Years | 207 (100.0%) | 151 (73.0%) |
| 75 Years and over | 101 (87.8%) | 79 (68.7%) |
| Total | 540 (14.8%) | 3,430 (93.8%) |
Disability Status by Sex by Age in Richwood
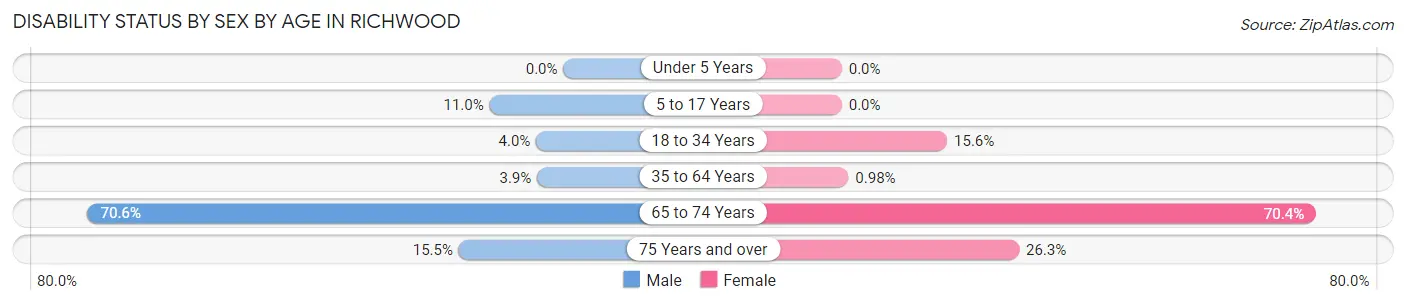
| Age Bracket | Male | Female |
| Under 5 Years | 0 (0.0%) | 0 (0.0%) |
| 5 to 17 Years | 57 (11.0%) | 0 (0.0%) |
| 18 to 34 Years | 15 (4.0%) | 48 (15.6%) |
| 35 to 64 Years | 33 (3.9%) | 8 (1.0%) |
| 65 to 74 Years | 77 (70.6%) | 69 (70.4%) |
| 75 Years and over | 9 (15.5%) | 15 (26.3%) |
Disability Class by Sex by Age in Richwood
Disability Class: Hearing Difficulty
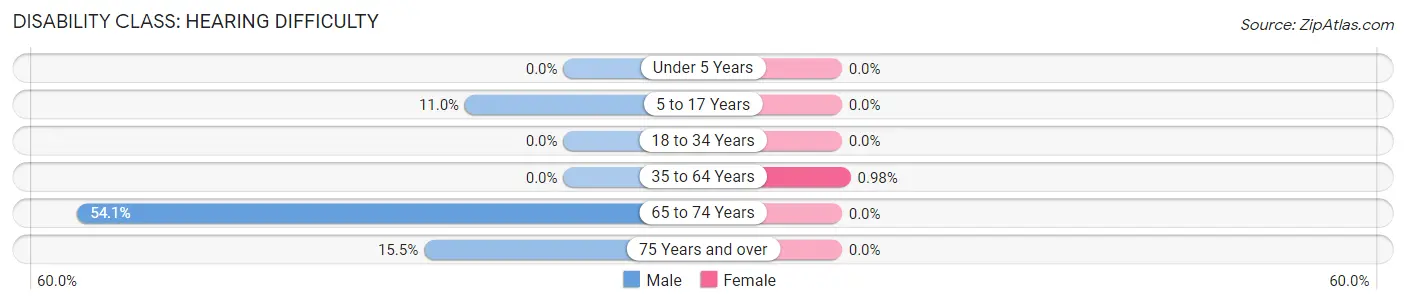
| Age Bracket | Male | Female |
| Under 5 Years | 0 (0.0%) | 0 (0.0%) |
| 5 to 17 Years | 57 (11.0%) | 0 (0.0%) |
| 18 to 34 Years | 0 (0.0%) | 0 (0.0%) |
| 35 to 64 Years | 0 (0.0%) | 8 (1.0%) |
| 65 to 74 Years | 59 (54.1%) | 0 (0.0%) |
| 75 Years and over | 9 (15.5%) | 0 (0.0%) |
Disability Class: Vision Difficulty
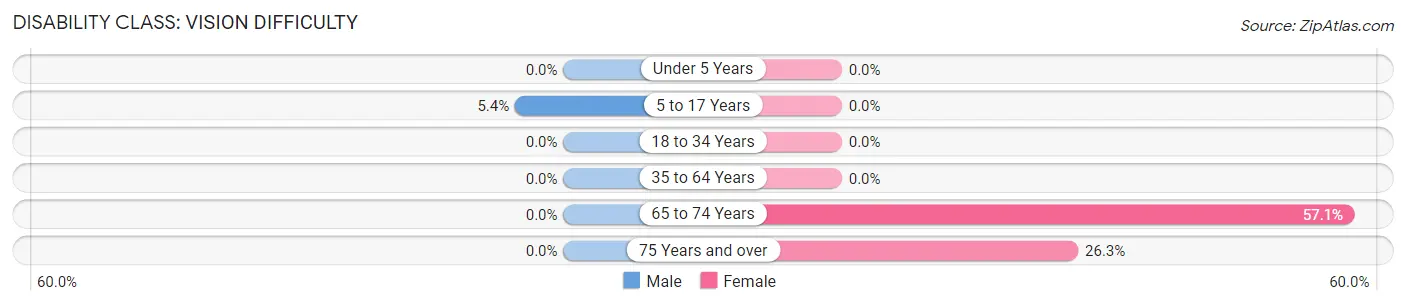
| Age Bracket | Male | Female |
| Under 5 Years | 0 (0.0%) | 0 (0.0%) |
| 5 to 17 Years | 28 (5.4%) | 0 (0.0%) |
| 18 to 34 Years | 0 (0.0%) | 0 (0.0%) |
| 35 to 64 Years | 0 (0.0%) | 0 (0.0%) |
| 65 to 74 Years | 0 (0.0%) | 56 (57.1%) |
| 75 Years and over | 0 (0.0%) | 15 (26.3%) |
Disability Class: Cognitive Difficulty
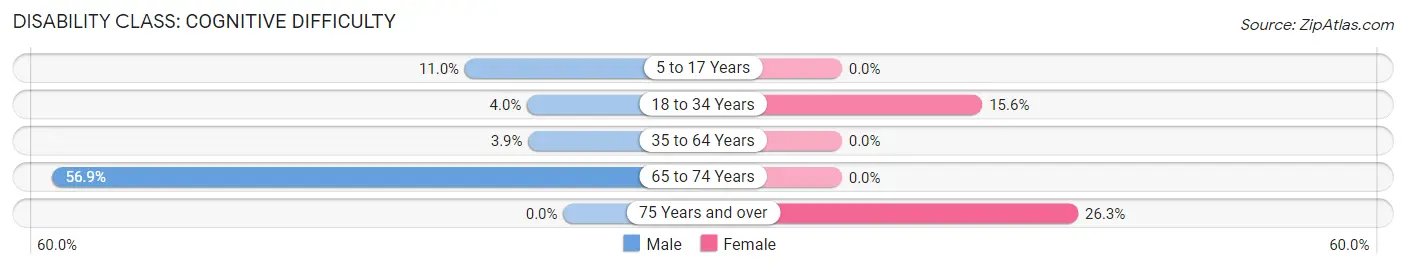
| Age Bracket | Male | Female |
| 5 to 17 Years | 57 (11.0%) | 0 (0.0%) |
| 18 to 34 Years | 15 (4.0%) | 48 (15.6%) |
| 35 to 64 Years | 33 (3.9%) | 0 (0.0%) |
| 65 to 74 Years | 62 (56.9%) | 0 (0.0%) |
| 75 Years and over | 0 (0.0%) | 15 (26.3%) |
Disability Class: Ambulatory Difficulty
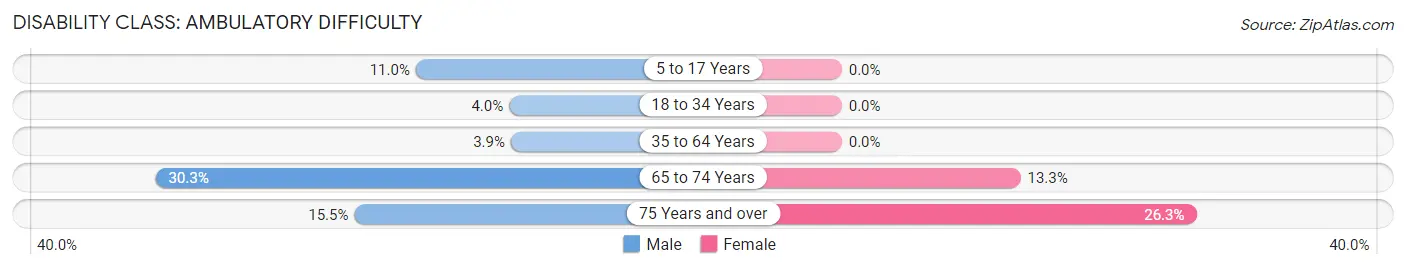
| Age Bracket | Male | Female |
| 5 to 17 Years | 57 (11.0%) | 0 (0.0%) |
| 18 to 34 Years | 15 (4.0%) | 0 (0.0%) |
| 35 to 64 Years | 33 (3.9%) | 0 (0.0%) |
| 65 to 74 Years | 33 (30.3%) | 13 (13.3%) |
| 75 Years and over | 9 (15.5%) | 15 (26.3%) |
Disability Class: Self-Care Difficulty
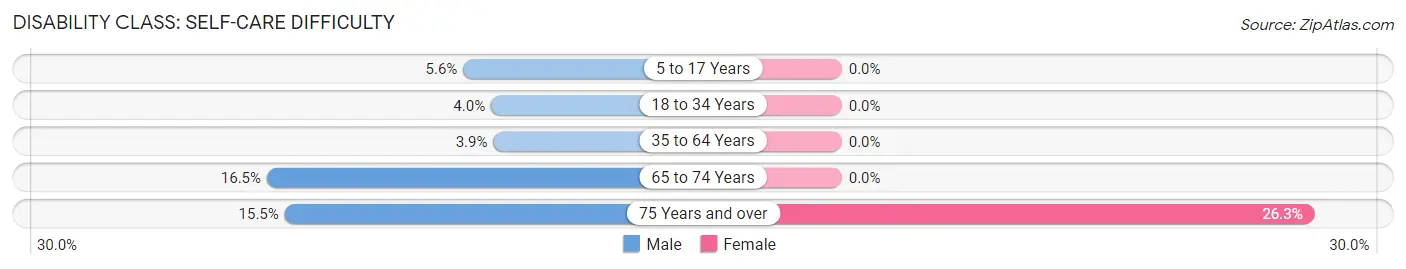
| Age Bracket | Male | Female |
| 5 to 17 Years | 29 (5.6%) | 0 (0.0%) |
| 18 to 34 Years | 15 (4.0%) | 0 (0.0%) |
| 35 to 64 Years | 33 (3.9%) | 0 (0.0%) |
| 65 to 74 Years | 18 (16.5%) | 0 (0.0%) |
| 75 Years and over | 9 (15.5%) | 15 (26.3%) |
Technology Access in Richwood
Computing Device Access in Richwood
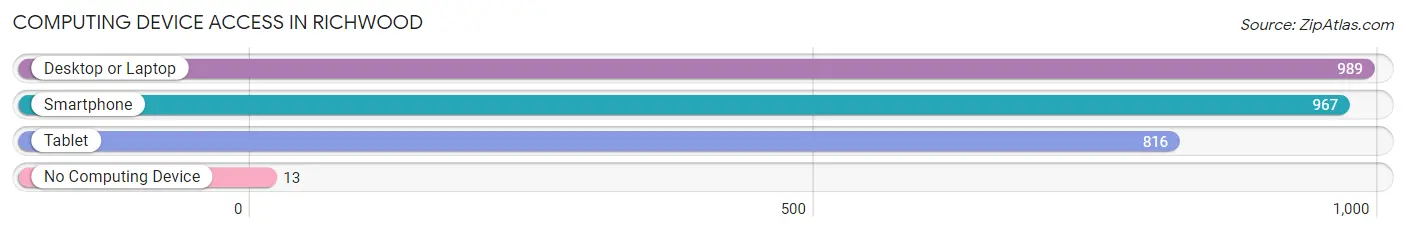
| Device Type | # Households | % Households |
| Desktop or Laptop | 989 | 98.7% |
| Smartphone | 967 | 96.5% |
| Tablet | 816 | 81.4% |
| No Computing Device | 13 | 1.3% |
| Total | 1,002 | 100.0% |
Internet Access in Richwood
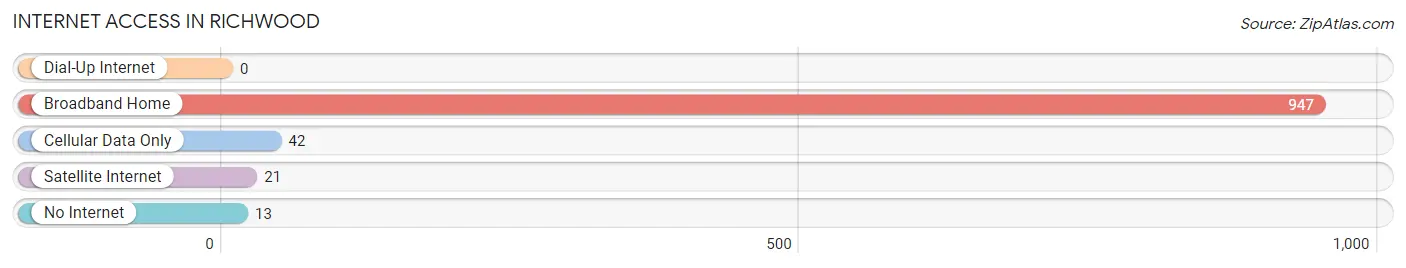
| Internet Type | # Households | % Households |
| Dial-Up Internet | 0 | 0.0% |
| Broadband Home | 947 | 94.5% |
| Cellular Data Only | 42 | 4.2% |
| Satellite Internet | 21 | 2.1% |
| No Internet | 13 | 1.3% |
| Total | 1,002 | 100.0% |
Richwood Summary
Richwood, New Jersey is a small borough located in the southern part of the state, in the county of Gloucester. It is situated on the banks of the Maurice River, and is part of the Delaware Valley region. The population of Richwood was 2,845 as of the 2010 census, making it the smallest borough in the county.
History
Richwood was originally part of the township of Deerfield, which was established in 1688. The area was first settled by Europeans in the early 1700s, and the first permanent settlement was established in 1720. The area was known as “Deerfield” until 1845, when it was renamed “Richwood” after the wealthy landowner, Richard Wood.
In 1867, Richwood was incorporated as a borough. The town was known for its lumber industry, which was the main source of employment for the residents. The lumber industry declined in the early 1900s, and the town began to focus on agriculture and fishing.
Geography
Richwood is located in the southern part of Gloucester County, on the banks of the Maurice River. It is bordered by the townships of Deerfield, Franklin, and Harrison. The borough is located approximately 25 miles south of Philadelphia, and is part of the Delaware Valley region.
The terrain of Richwood is mostly flat, with some rolling hills. The climate is humid subtropical, with hot, humid summers and mild winters. The average annual temperature is around 55 degrees Fahrenheit.
Economy
The economy of Richwood is largely based on agriculture and fishing. The town is home to several farms, which produce a variety of crops, including corn, soybeans, and wheat. The town also has a thriving fishing industry, with several commercial fishing boats operating out of the local marina.
In addition to agriculture and fishing, Richwood is home to several small businesses, including restaurants, retail stores, and professional services. The town also has a small manufacturing sector, which produces a variety of products, including furniture and clothing.
Demographics
As of the 2010 census, the population of Richwood was 2,845. The racial makeup of the town was 94.3% White, 2.2% African American, 0.7% Asian, 0.3% Native American, and 2.5% from other races. The median household income was $50,945, and the median family income was $60,945.
The town is home to a large number of retirees, with nearly 20% of the population over the age of 65. The town also has a large Hispanic population, with nearly 20% of the population identifying as Hispanic or Latino.
Richwood is a small, rural town with a rich history and a diverse population. The town is home to a thriving agricultural and fishing industry, as well as a variety of small businesses. The town is also home to a large number of retirees, and a growing Hispanic population. Richwood is a great place to live, work, and raise a family.
Common Questions
What is Per Capita Income in Richwood?
Per Capita income in Richwood is $61,926.
What is the Median Family Income in Richwood?
Median Family Income in Richwood is $200,793.
What is the Median Household income in Richwood?
Median Household Income in Richwood is $201,037.
What is Income or Wage Gap in Richwood?
Income or Wage Gap in Richwood is 47.8%.
Women in Richwood earn 52.2 cents for every dollar earned by a man.
What is Inequality or Gini Index in Richwood?
Inequality or Gini Index in Richwood is 0.35.
What is the Total Population of Richwood?
Total Population of Richwood is 3,656.
What is the Total Male Population of Richwood?
Total Male Population of Richwood is 1,939.
What is the Total Female Population of Richwood?
Total Female Population of Richwood is 1,717.
What is the Ratio of Males per 100 Females in Richwood?
There are 112.93 Males per 100 Females in Richwood.
What is the Ratio of Females per 100 Males in Richwood?
There are 88.55 Females per 100 Males in Richwood.
What is the Median Population Age in Richwood?
Median Population Age in Richwood is 38.9 Years.
What is the Average Family Size in Richwood
Average Family Size in Richwood is 4.0 People.
What is the Average Household Size in Richwood
Average Household Size in Richwood is 3.6 People.
How Large is the Labor Force in Richwood?
There are 1,918 People in the Labor Forcein in Richwood.
What is the Percentage of People in the Labor Force in Richwood?
69.9% of People are in the Labor Force in Richwood.
What is the Unemployment Rate in Richwood?
Unemployment Rate in Richwood is 7.4%.