Zip Codes with the Highest Percentage of Population Employed in Business & Financial in Brighton, MI
RELATED REPORTS & OPTIONS
Business & Financial
Brighton
Compare Zip Codes
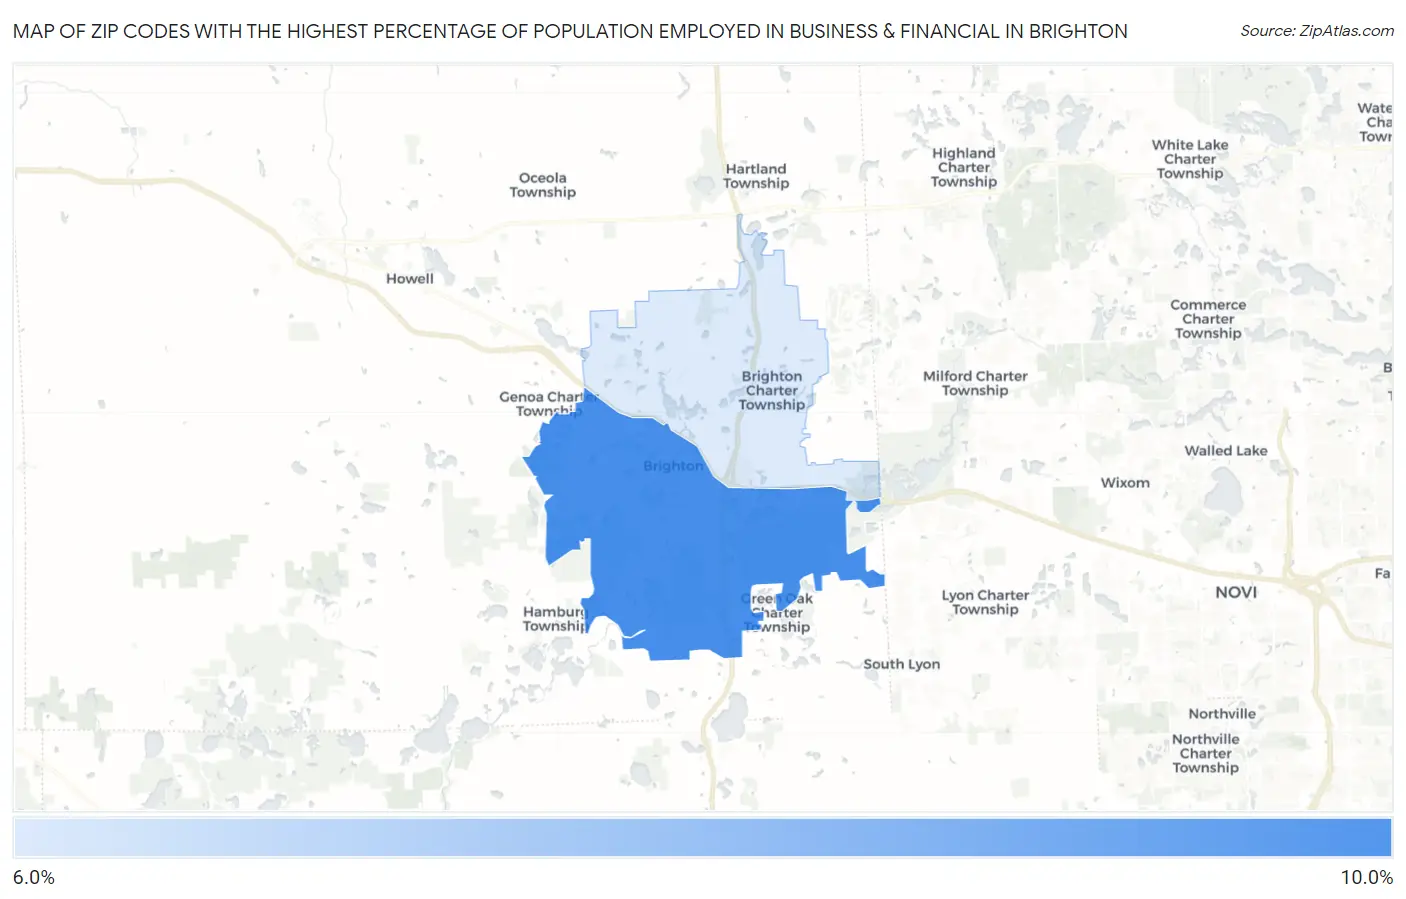
Map of Zip Codes with the Highest Percentage of Population Employed in Business & Financial in Brighton
6.2%
8.8%
Zip Codes with the Highest Percentage of Population Employed in Business & Financial in Brighton, MI
| Zip Code | % Employed | vs State | vs National | |
| 1. | 48116 | 8.8% | 5.3%(+3.56)#61 | 5.8%(+3.06)#3,268 |
| 2. | 48114 | 6.2% | 5.3%(+0.898)#195 | 5.8%(+0.398)#7,460 |
1
Common Questions
What are the Top Zip Codes with the Highest Percentage of Population Employed in Business & Financial in Brighton, MI?
Top Zip Codes with the Highest Percentage of Population Employed in Business & Financial in Brighton, MI are:
What zip code has the Highest Percentage of Population Employed in Business & Financial in Brighton, MI?
48116 has the Highest Percentage of Population Employed in Business & Financial in Brighton, MI with 8.8%.
What is the Percentage of Population Employed in Business & Financial in Brighton, MI?
Percentage of Population Employed in Business & Financial in Brighton is 7.1%.
What is the Percentage of Population Employed in Business & Financial in Michigan?
Percentage of Population Employed in Business & Financial in Michigan is 5.3%.
What is the Percentage of Population Employed in Business & Financial in the United States?
Percentage of Population Employed in Business & Financial in the United States is 5.8%.