Zip Codes with the Highest Percentage of Population Employed in Life, Physical & Social Science in Brighton, MI
RELATED REPORTS & OPTIONS
Life, Physical & Social Science
Brighton
Compare Zip Codes
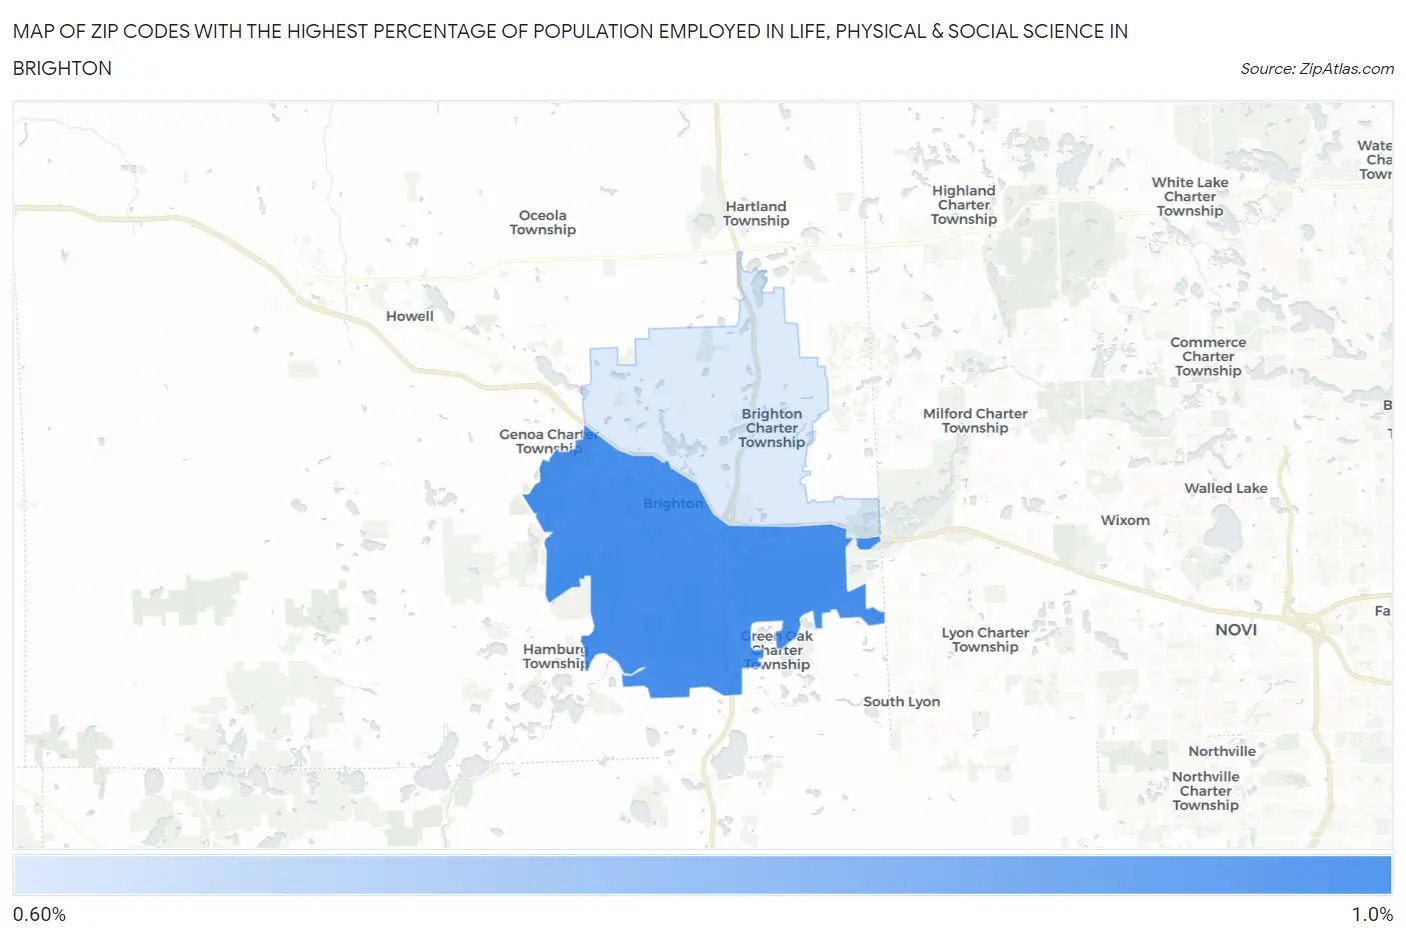
Map of Zip Codes with the Highest Percentage of Population Employed in Life, Physical & Social Science in Brighton
0.63%
0.83%
Zip Codes with the Highest Percentage of Population Employed in Life, Physical & Social Science in Brighton, MI
| Zip Code | % Employed | vs State | vs National | |
| 1. | 48116 | 0.83% | 0.88%(-0.054)#298 | 1.1%(-0.261)#10,690 |
| 2. | 48114 | 0.63% | 0.88%(-0.256)#383 | 1.1%(-0.463)#12,931 |
1
Common Questions
What are the Top Zip Codes with the Highest Percentage of Population Employed in Life, Physical & Social Science in Brighton, MI?
Top Zip Codes with the Highest Percentage of Population Employed in Life, Physical & Social Science in Brighton, MI are:
What zip code has the Highest Percentage of Population Employed in Life, Physical & Social Science in Brighton, MI?
48116 has the Highest Percentage of Population Employed in Life, Physical & Social Science in Brighton, MI with 0.83%.
What is the Percentage of Population Employed in Life, Physical & Social Science in Brighton, MI?
Percentage of Population Employed in Life, Physical & Social Science in Brighton is 0.57%.
What is the Percentage of Population Employed in Life, Physical & Social Science in Michigan?
Percentage of Population Employed in Life, Physical & Social Science in Michigan is 0.88%.
What is the Percentage of Population Employed in Life, Physical & Social Science in the United States?
Percentage of Population Employed in Life, Physical & Social Science in the United States is 1.1%.