Zip Codes with the Highest Percentage of Population Employed in Community & Social Service in Brighton, MI
RELATED REPORTS & OPTIONS
Community & Social Service
Brighton
Compare Zip Codes
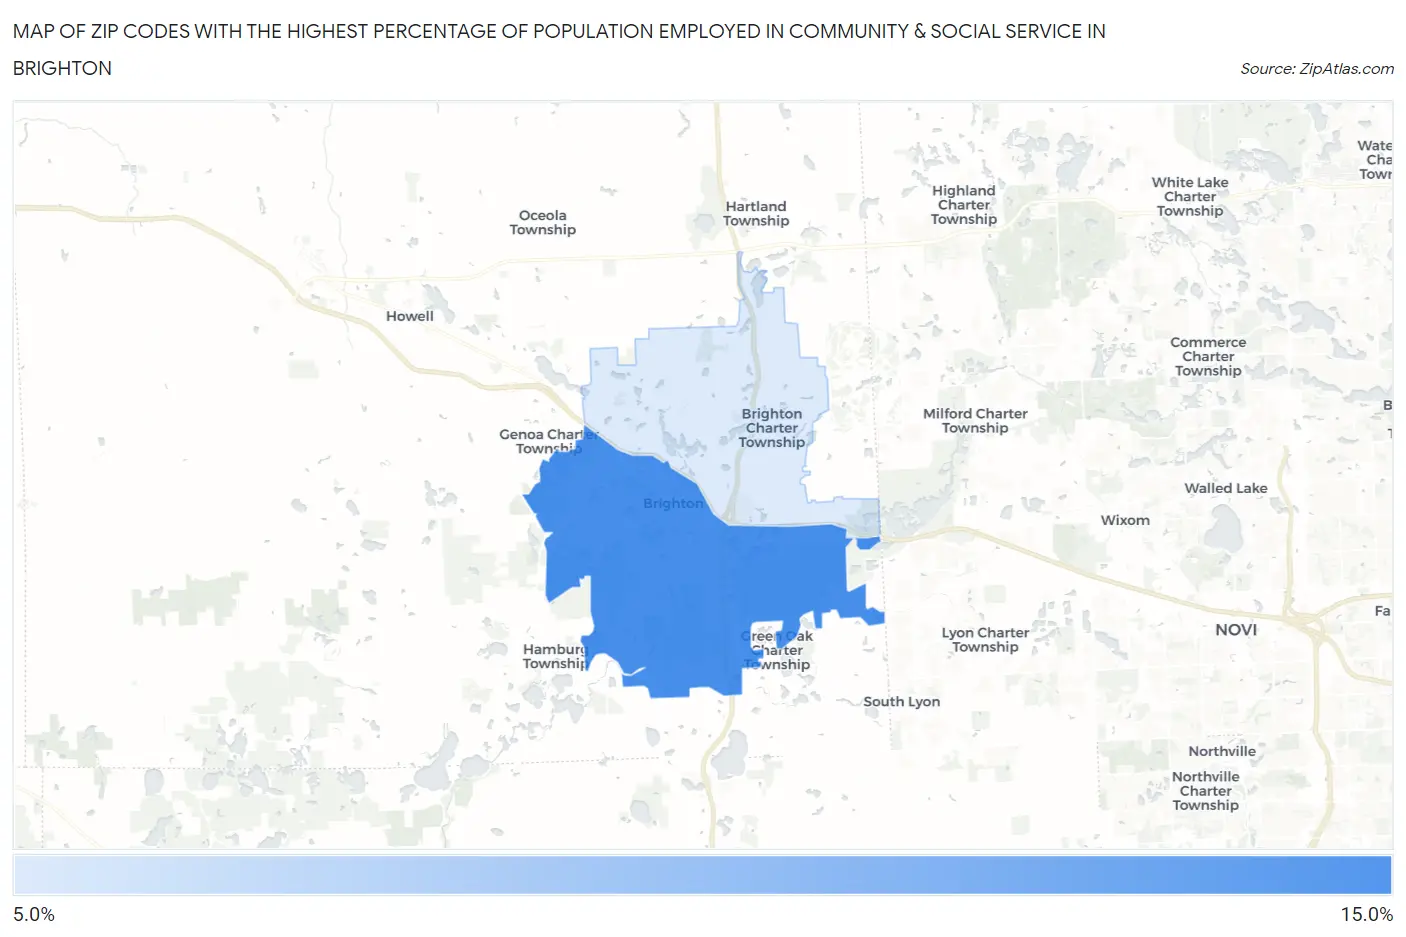
Map of Zip Codes with the Highest Percentage of Population Employed in Community & Social Service in Brighton
8.9%
11.1%
Zip Codes with the Highest Percentage of Population Employed in Community & Social Service in Brighton, MI
| Zip Code | % Employed | vs State | vs National | |
| 1. | 48116 | 11.1% | 9.7%(+1.38)#200 | 11.2%(-0.161)#11,500 |
| 2. | 48114 | 8.9% | 9.7%(-0.809)#366 | 11.2%(-2.35)#17,180 |
1
Common Questions
What are the Top Zip Codes with the Highest Percentage of Population Employed in Community & Social Service in Brighton, MI?
Top Zip Codes with the Highest Percentage of Population Employed in Community & Social Service in Brighton, MI are:
What zip code has the Highest Percentage of Population Employed in Community & Social Service in Brighton, MI?
48116 has the Highest Percentage of Population Employed in Community & Social Service in Brighton, MI with 11.1%.
What is the Percentage of Population Employed in Community & Social Service in Brighton, MI?
Percentage of Population Employed in Community & Social Service in Brighton is 11.1%.
What is the Percentage of Population Employed in Community & Social Service in Michigan?
Percentage of Population Employed in Community & Social Service in Michigan is 9.7%.
What is the Percentage of Population Employed in Community & Social Service in the United States?
Percentage of Population Employed in Community & Social Service in the United States is 11.2%.