Zip Codes with the Highest Percentage of Population Employed in Installation, Maintenance & Repair in Brighton, MI
RELATED REPORTS & OPTIONS
Installation, Maintenance & Repair
Brighton
Compare Zip Codes
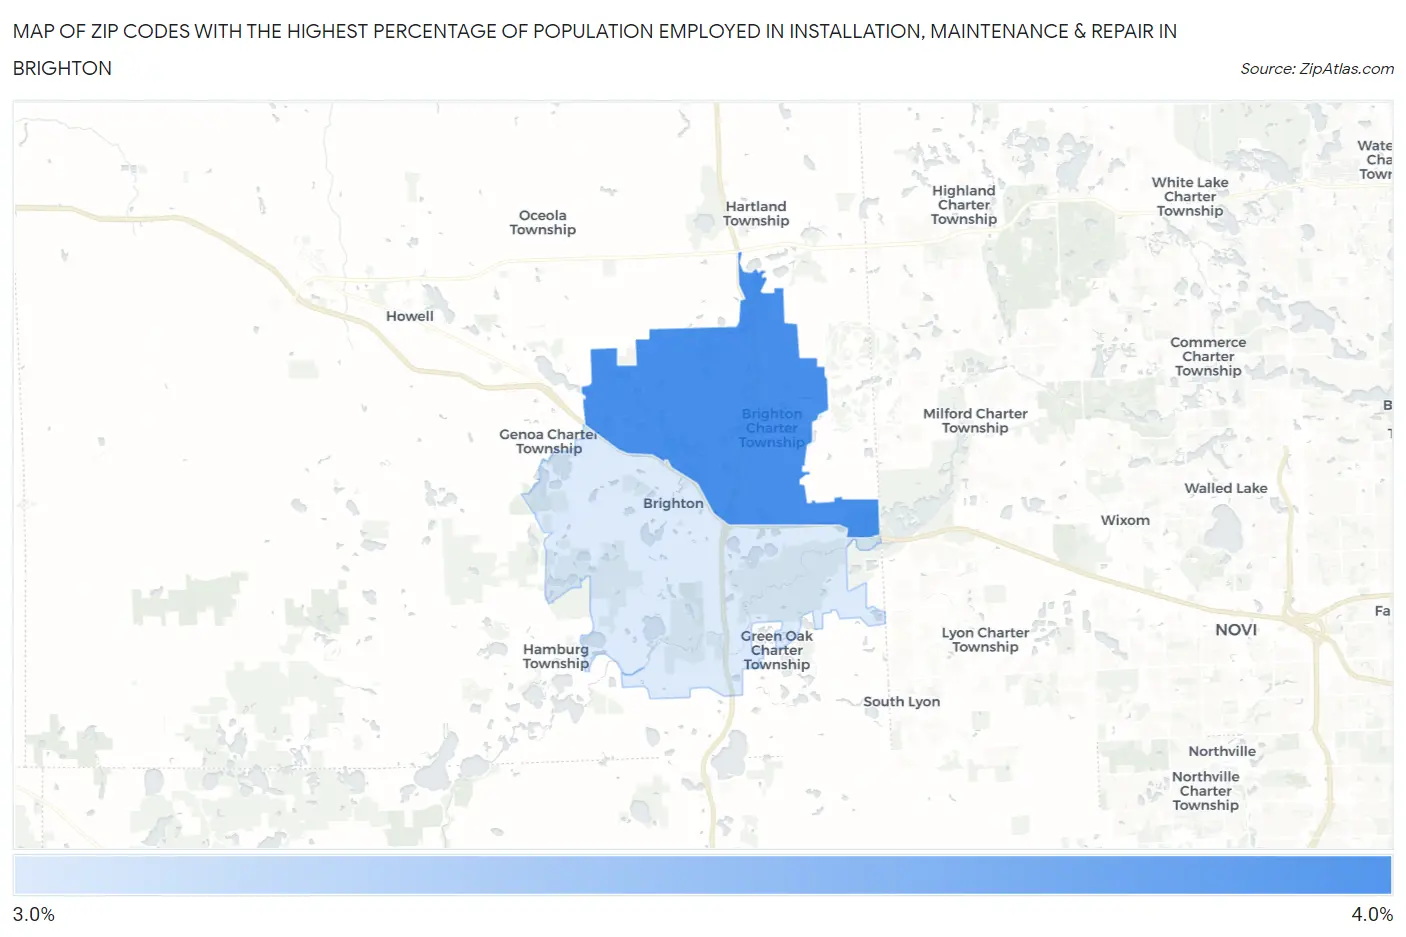
Map of Zip Codes with the Highest Percentage of Population Employed in Installation, Maintenance & Repair in Brighton
3.0%
3.2%
Zip Codes with the Highest Percentage of Population Employed in Installation, Maintenance & Repair in Brighton, MI
| Zip Code | % Employed | vs State | vs National | |
| 1. | 48114 | 3.2% | 3.1%(+0.078)#579 | 3.1%(+0.110)#16,137 |
| 2. | 48116 | 3.0% | 3.1%(-0.089)#606 | 3.1%(-0.057)#16,922 |
1
Common Questions
What are the Top Zip Codes with the Highest Percentage of Population Employed in Installation, Maintenance & Repair in Brighton, MI?
Top Zip Codes with the Highest Percentage of Population Employed in Installation, Maintenance & Repair in Brighton, MI are:
What zip code has the Highest Percentage of Population Employed in Installation, Maintenance & Repair in Brighton, MI?
48114 has the Highest Percentage of Population Employed in Installation, Maintenance & Repair in Brighton, MI with 3.2%.
What is the Percentage of Population Employed in Installation, Maintenance & Repair in Brighton, MI?
Percentage of Population Employed in Installation, Maintenance & Repair in Brighton is 2.8%.
What is the Percentage of Population Employed in Installation, Maintenance & Repair in Michigan?
Percentage of Population Employed in Installation, Maintenance & Repair in Michigan is 3.1%.
What is the Percentage of Population Employed in Installation, Maintenance & Repair in the United States?
Percentage of Population Employed in Installation, Maintenance & Repair in the United States is 3.1%.