Zip Codes with the Highest Percentage of Population with a Degree in Visual and Performing Arts in Brighton, MI
RELATED REPORTS & OPTIONS
Visual and Performing Arts
Brighton
Compare Zip Codes
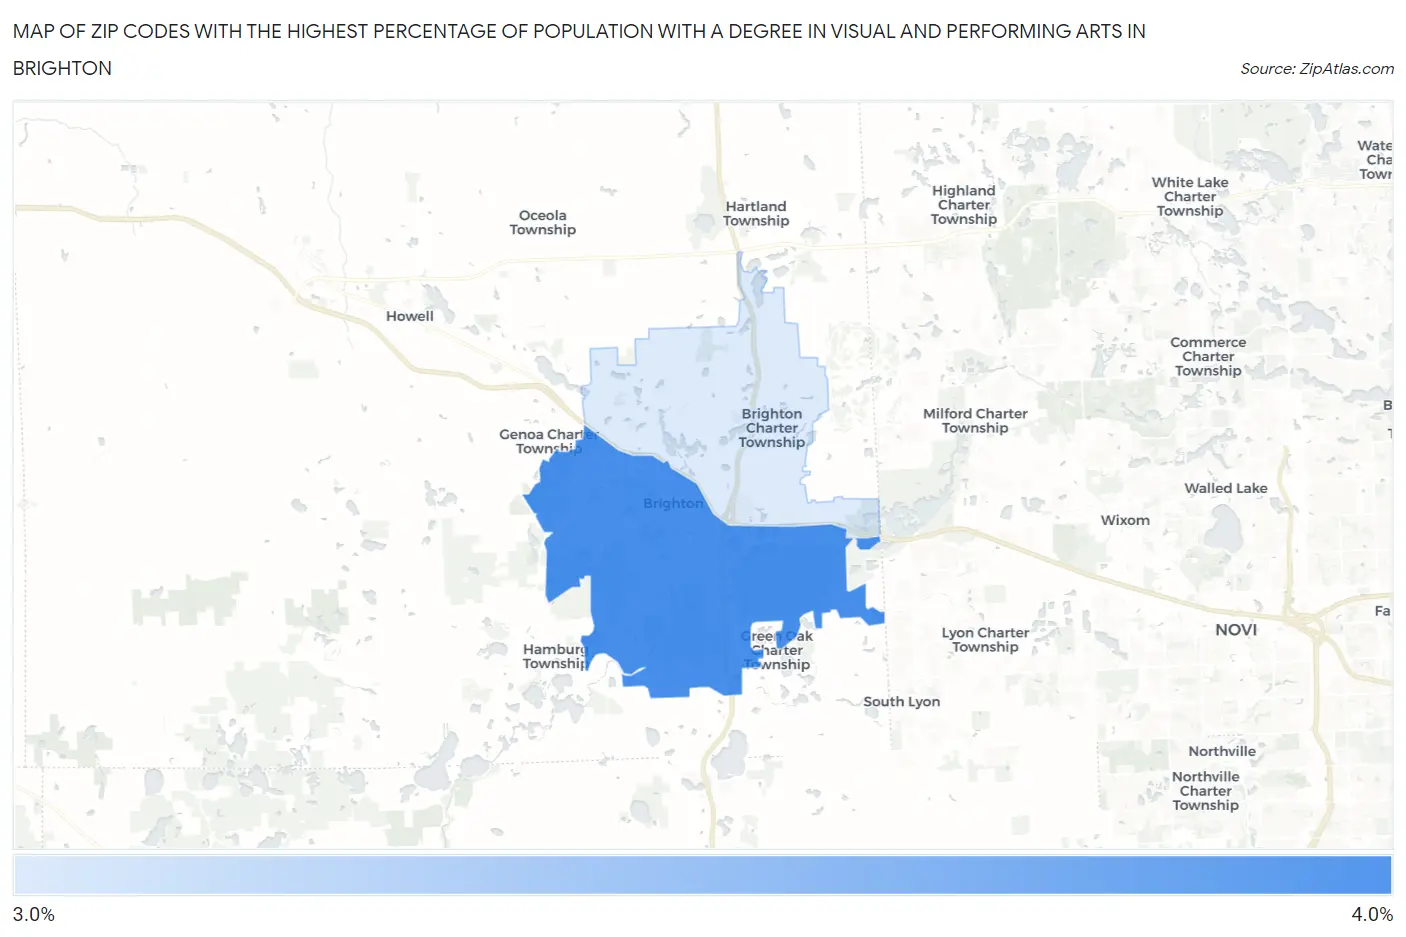
Map of Zip Codes with the Highest Percentage of Population with a Degree in Visual and Performing Arts in Brighton
3.1%
3.3%
Zip Codes with the Highest Percentage of Population with a Degree in Visual and Performing Arts in Brighton, MI
| Zip Code | % Graduates | vs State | vs National | |
| 1. | 48116 | 3.3% | 3.4%(-0.062)#323 | 4.3%(-0.912)#11,455 |
| 2. | 48114 | 3.1% | 3.4%(-0.307)#354 | 4.3%(-1.16)#12,354 |
1
Common Questions
What are the Top Zip Codes with the Highest Percentage of Population with a Degree in Visual and Performing Arts in Brighton, MI?
Top Zip Codes with the Highest Percentage of Population with a Degree in Visual and Performing Arts in Brighton, MI are:
What zip code has the Highest Percentage of Population with a Degree in Visual and Performing Arts in Brighton, MI?
48116 has the Highest Percentage of Population with a Degree in Visual and Performing Arts in Brighton, MI with 3.3%.
What is the Percentage of Population with a Degree in Visual and Performing Arts in Brighton, MI?
Percentage of Population with a Degree in Visual and Performing Arts in Brighton is 3.1%.
What is the Percentage of Population with a Degree in Visual and Performing Arts in Michigan?
Percentage of Population with a Degree in Visual and Performing Arts in Michigan is 3.4%.
What is the Percentage of Population with a Degree in Visual and Performing Arts in the United States?
Percentage of Population with a Degree in Visual and Performing Arts in the United States is 4.3%.