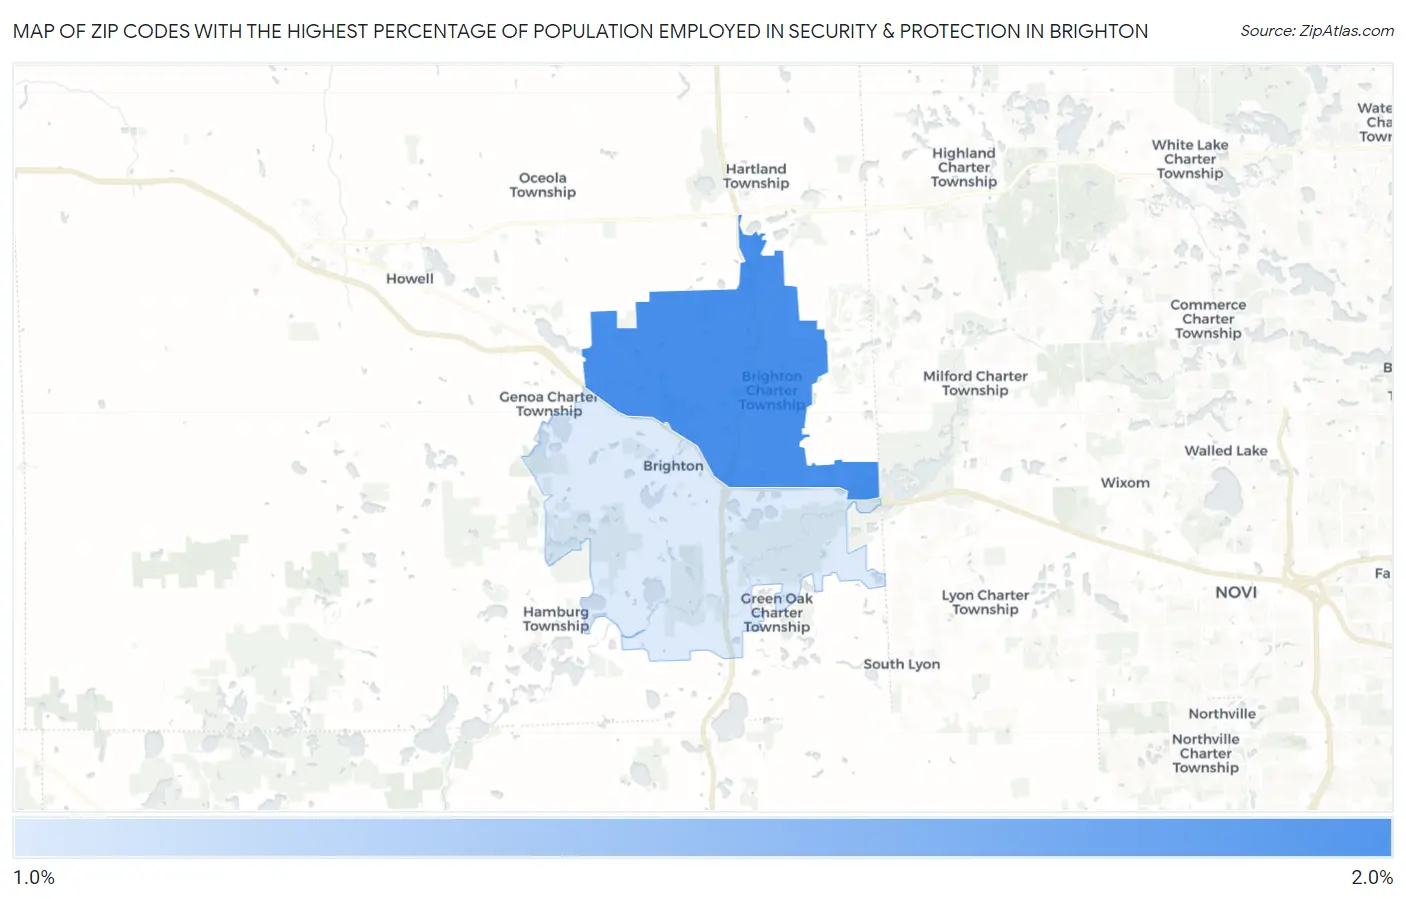
Zip Codes with the Highest Percentage of Population Employed in Security & Protection in Brighton, MI
RELATED REPORTS & OPTIONS
Security & Protection
Brighton
Compare Zip Codes
Map of Zip Codes with the Highest Percentage of Population Employed in Security & Protection in Brighton
1.7%
2.0%
Zip Codes with the Highest Percentage of Population Employed in Security & Protection in Brighton, MI
| Zip Code | % Employed | vs State | vs National | |
| 1. | 48114 | 2.0% | 1.6%(+0.317)#300 | 2.1%(-0.190)#12,834 |
| 2. | 48116 | 1.7% | 1.6%(+0.048)#390 | 2.1%(-0.459)#14,761 |
1
Common Questions
What are the Top Zip Codes with the Highest Percentage of Population Employed in Security & Protection in Brighton, MI?
Top Zip Codes with the Highest Percentage of Population Employed in Security & Protection in Brighton, MI are:
What zip code has the Highest Percentage of Population Employed in Security & Protection in Brighton, MI?
48114 has the Highest Percentage of Population Employed in Security & Protection in Brighton, MI with 2.0%.
What is the Percentage of Population Employed in Security & Protection in Brighton, MI?
Percentage of Population Employed in Security & Protection in Brighton is 0.27%.
What is the Percentage of Population Employed in Security & Protection in Michigan?
Percentage of Population Employed in Security & Protection in Michigan is 1.6%.
What is the Percentage of Population Employed in Security & Protection in the United States?
Percentage of Population Employed in Security & Protection in the United States is 2.1%.