Arkansas City, KS Map & Demographics
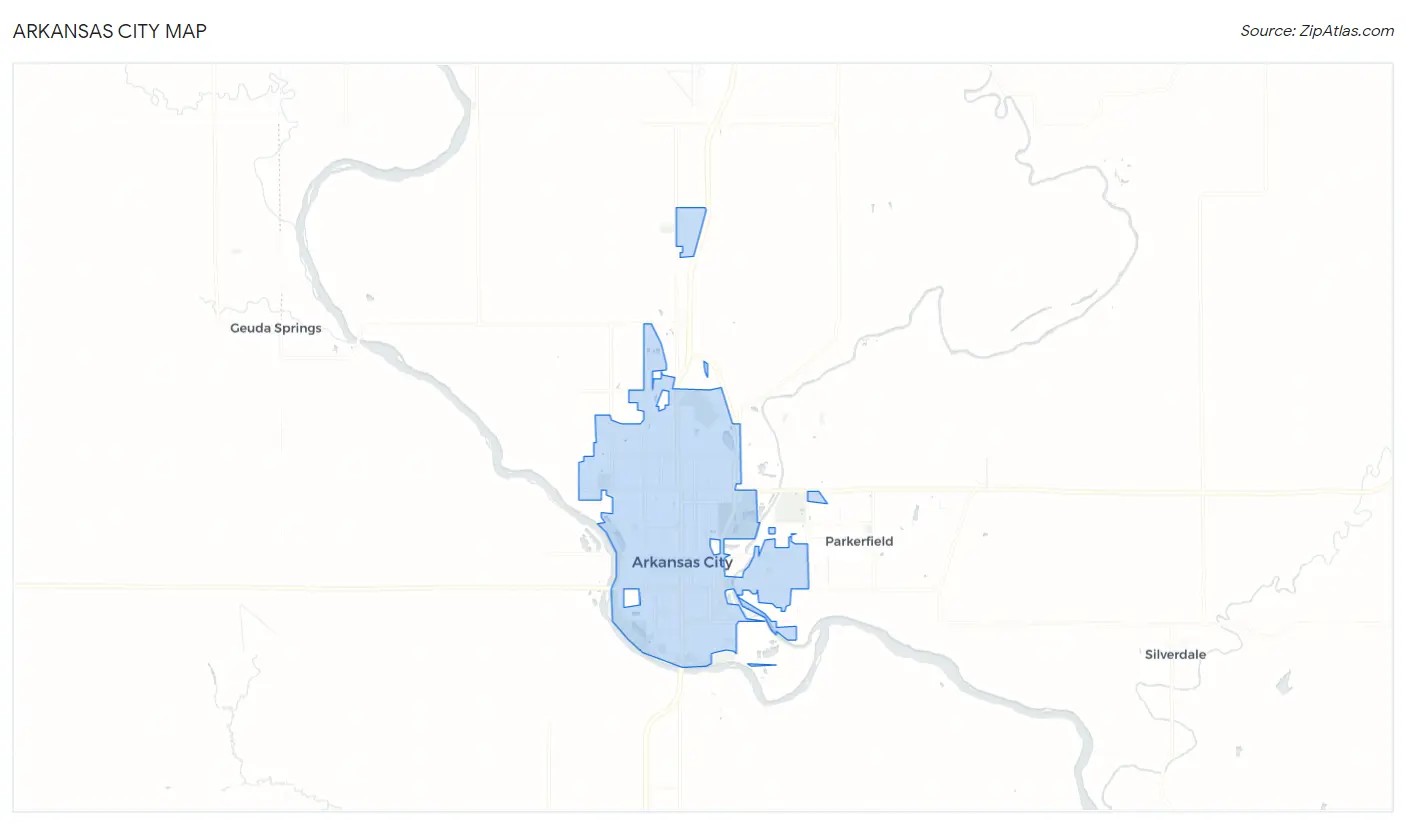
Arkansas City Map
Arkansas City Overview
$25,442
PER CAPITA INCOME
$68,103
AVG FAMILY INCOME
$49,177
AVG HOUSEHOLD INCOME
12.8%
WAGE / INCOME GAP [ % ]
87.2¢/ $1
WAGE / INCOME GAP [ $ ]
0.41
INEQUALITY / GINI INDEX
11,997
TOTAL POPULATION
5,968
MALE POPULATION
6,029
FEMALE POPULATION
98.99
MALES / 100 FEMALES
101.02
FEMALES / 100 MALES
35.5
MEDIAN AGE
3.3
AVG FAMILY SIZE
2.4
AVG HOUSEHOLD SIZE
5,401
LABOR FORCE [ PEOPLE ]
57.4%
PERCENT IN LABOR FORCE
6.7%
UNEMPLOYMENT RATE
Arkansas City Zip Codes
Arkansas City Area Codes
Income in Arkansas City
Income Overview in Arkansas City
Per Capita Income in Arkansas City is $25,442, while median incomes of families and households are $68,103 and $49,177 respectively.
| Characteristic | Number | Measure |
| Per Capita Income | 11,997 | $25,442 |
| Median Family Income | 2,622 | $68,103 |
| Mean Family Income | 2,622 | $78,043 |
| Median Household Income | 4,685 | $49,177 |
| Mean Household Income | 4,685 | $62,866 |
| Income Deficit | 2,622 | $0 |
| Wage / Income Gap (%) | 11,997 | 12.76% |
| Wage / Income Gap ($) | 11,997 | 87.24¢ per $1 |
| Gini / Inequality Index | 11,997 | 0.41 |
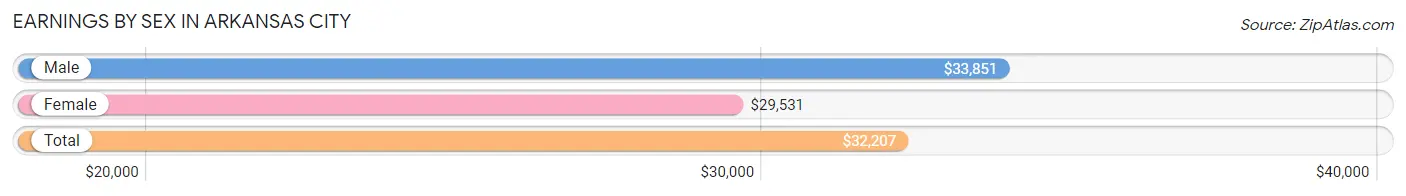
Earnings by Sex in Arkansas City
Average Earnings in Arkansas City are $32,207, $33,851 for men and $29,531 for women, a difference of 12.8%.
| Sex | Number | Average Earnings |
| Male | 3,158 (54.3%) | $33,851 |
| Female | 2,652 (45.7%) | $29,531 |
| Total | 5,810 (100.0%) | $32,207 |
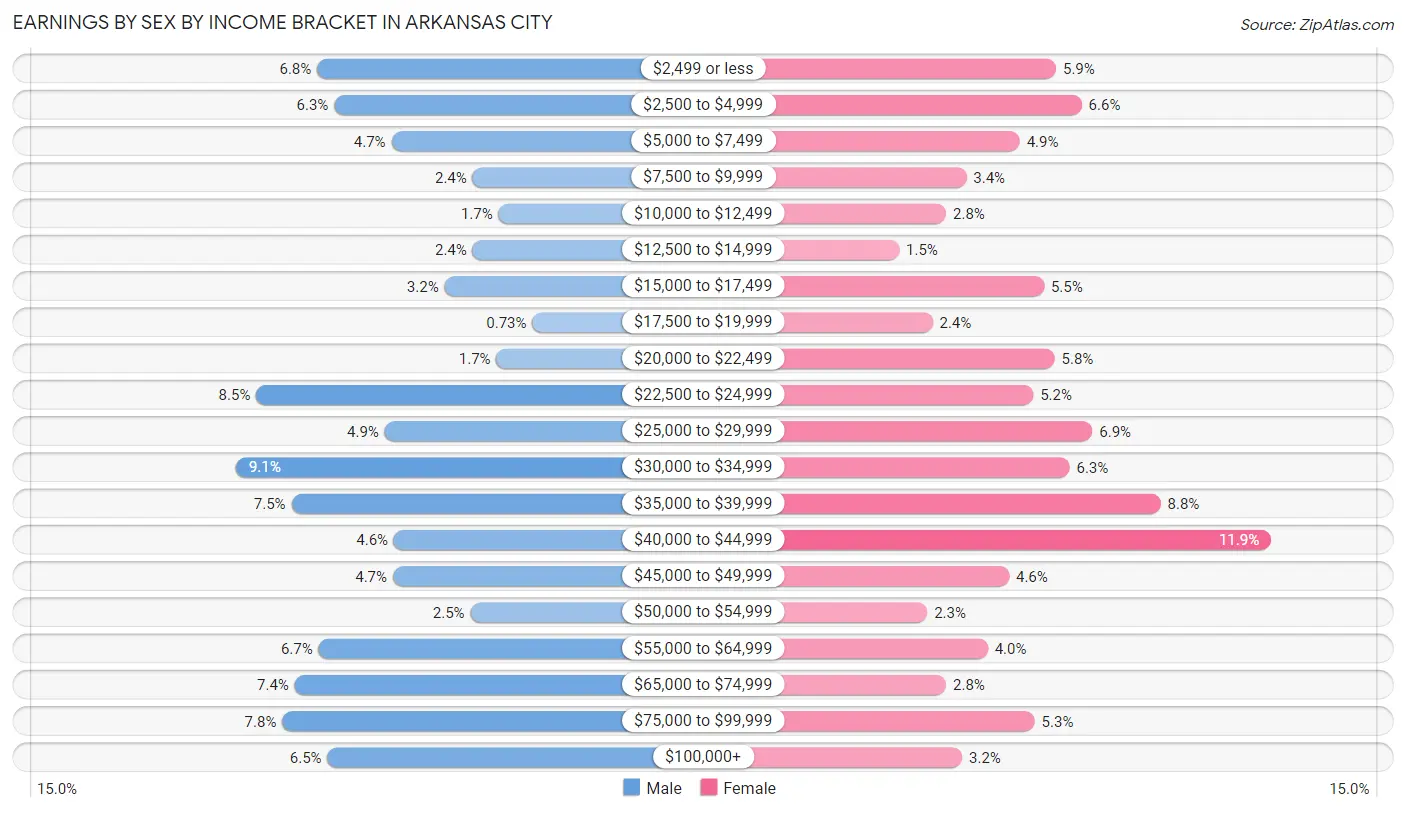
Earnings by Sex by Income Bracket in Arkansas City
The most common earnings brackets in Arkansas City are $30,000 to $34,999 for men (286 | 9.1%) and $40,000 to $44,999 for women (316 | 11.9%).
| Income | Male | Female |
| $2,499 or less | 214 (6.8%) | 156 (5.9%) |
| $2,500 to $4,999 | 199 (6.3%) | 175 (6.6%) |
| $5,000 to $7,499 | 148 (4.7%) | 129 (4.9%) |
| $7,500 to $9,999 | 76 (2.4%) | 89 (3.4%) |
| $10,000 to $12,499 | 53 (1.7%) | 74 (2.8%) |
| $12,500 to $14,999 | 76 (2.4%) | 39 (1.5%) |
| $15,000 to $17,499 | 101 (3.2%) | 147 (5.5%) |
| $17,500 to $19,999 | 23 (0.7%) | 64 (2.4%) |
| $20,000 to $22,499 | 55 (1.7%) | 155 (5.8%) |
| $22,500 to $24,999 | 268 (8.5%) | 139 (5.2%) |
| $25,000 to $29,999 | 154 (4.9%) | 183 (6.9%) |
| $30,000 to $34,999 | 286 (9.1%) | 166 (6.3%) |
| $35,000 to $39,999 | 237 (7.5%) | 234 (8.8%) |
| $40,000 to $44,999 | 146 (4.6%) | 316 (11.9%) |
| $45,000 to $49,999 | 147 (4.6%) | 121 (4.6%) |
| $50,000 to $54,999 | 78 (2.5%) | 60 (2.3%) |
| $55,000 to $64,999 | 213 (6.7%) | 105 (4.0%) |
| $65,000 to $74,999 | 234 (7.4%) | 74 (2.8%) |
| $75,000 to $99,999 | 245 (7.8%) | 140 (5.3%) |
| $100,000+ | 205 (6.5%) | 86 (3.2%) |
| Total | 3,158 (100.0%) | 2,652 (100.0%) |
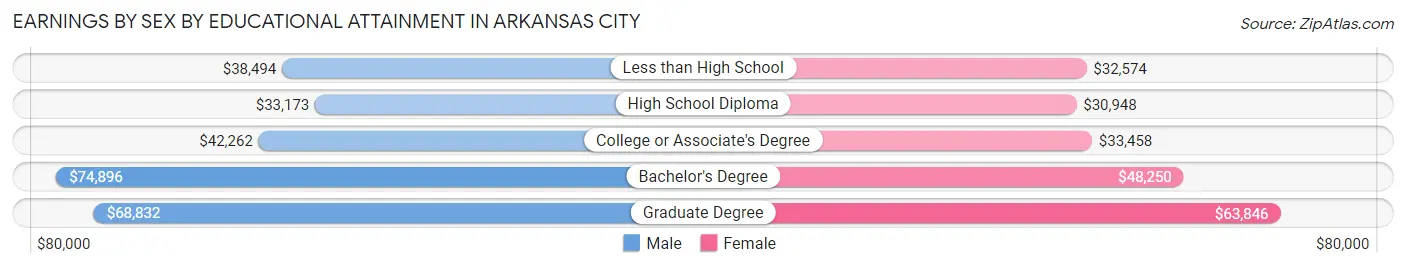
Earnings by Sex by Educational Attainment in Arkansas City
Average earnings in Arkansas City are $40,893 for men and $35,878 for women, a difference of 12.3%. Men with an educational attainment of bachelor's degree enjoy the highest average annual earnings of $74,896, while those with high school diploma education earn the least with $33,173. Women with an educational attainment of graduate degree earn the most with the average annual earnings of $63,846, while those with high school diploma education have the smallest earnings of $30,948.
| Educational Attainment | Male Income | Female Income |
| Less than High School | $38,494 | $32,574 |
| High School Diploma | $33,173 | $30,948 |
| College or Associate's Degree | $42,262 | $33,458 |
| Bachelor's Degree | $74,896 | $48,250 |
| Graduate Degree | $68,832 | $63,846 |
| Total | $40,893 | $35,878 |
Family Income in Arkansas City
Family Income Brackets in Arkansas City
According to the Arkansas City family income data, there are 548 families falling into the $50,000 to $74,999 income range, which is the most common income bracket and makes up 20.9% of all families. Conversely, the $10,000 to $14,999 income bracket is the least frequent group with only 76 families (2.9%) belonging to this category.
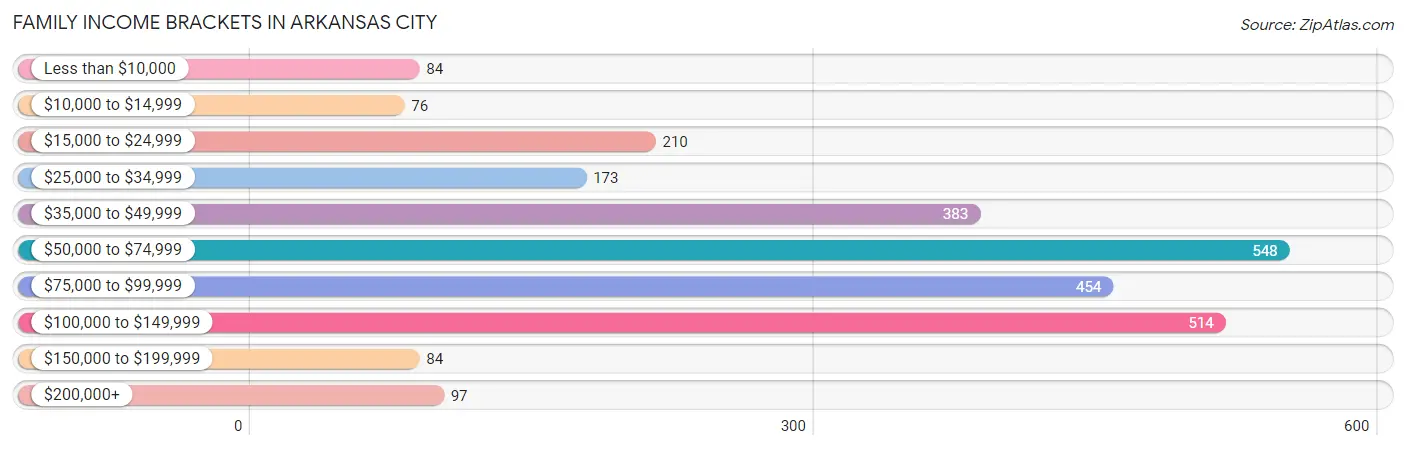
| Income Bracket | # Families | % Families |
| Less than $10,000 | 84 | 3.2% |
| $10,000 to $14,999 | 76 | 2.9% |
| $15,000 to $24,999 | 210 | 8.0% |
| $25,000 to $34,999 | 173 | 6.6% |
| $35,000 to $49,999 | 383 | 14.6% |
| $50,000 to $74,999 | 548 | 20.9% |
| $75,000 to $99,999 | 454 | 17.3% |
| $100,000 to $149,999 | 514 | 19.6% |
| $150,000 to $199,999 | 84 | 3.2% |
| $200,000+ | 97 | 3.7% |
Family Income by Famaliy Size in Arkansas City
4-person families (358 | 13.7%) account for the highest median family income in Arkansas City with $76,894 per family, while 2-person families (1,153 | 44.0%) have the highest median income of $35,276 per family member.
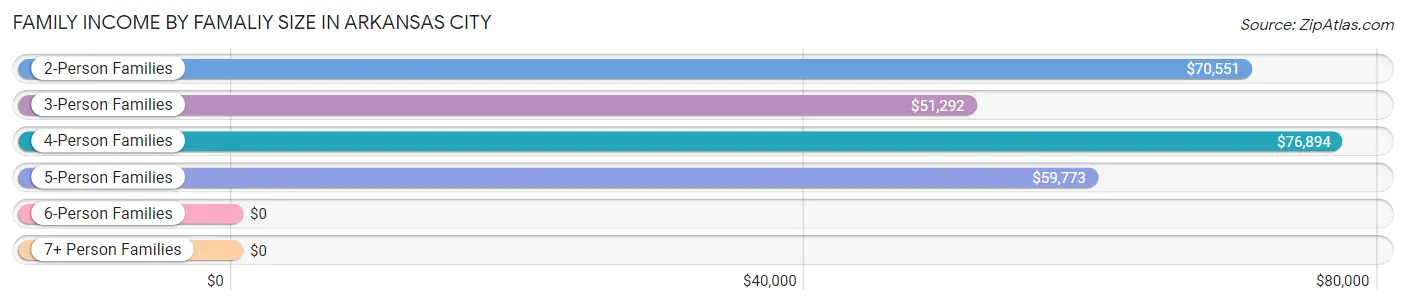
| Income Bracket | # Families | Median Income |
| 2-Person Families | 1,153 (44.0%) | $70,551 |
| 3-Person Families | 749 (28.6%) | $51,292 |
| 4-Person Families | 358 (13.7%) | $76,894 |
| 5-Person Families | 212 (8.1%) | $59,773 |
| 6-Person Families | 129 (4.9%) | $0 |
| 7+ Person Families | 21 (0.8%) | $0 |
| Total | 2,622 (100.0%) | $68,103 |
Family Income by Number of Earners in Arkansas City
The median family income in Arkansas City is $68,103, with families comprising 3+ earners (222) having the highest median family income of $143,571, while families with 1 earner (953) have the lowest median family income of $43,717, accounting for 8.5% and 36.3% of families, respectively.
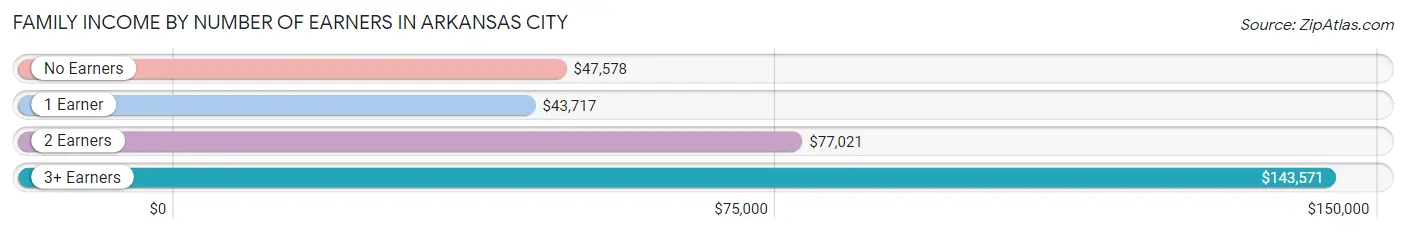
| Number of Earners | # Families | Median Income |
| No Earners | 373 (14.2%) | $47,578 |
| 1 Earner | 953 (36.3%) | $43,717 |
| 2 Earners | 1,074 (41.0%) | $77,021 |
| 3+ Earners | 222 (8.5%) | $143,571 |
| Total | 2,622 (100.0%) | $68,103 |
Household Income in Arkansas City
Household Income Brackets in Arkansas City
With 801 households falling in the category, the $50,000 to $74,999 income range is the most frequent in Arkansas City, accounting for 17.1% of all households. In contrast, only 89 households (1.9%) fall into the $150,000 to $199,999 income bracket, making it the least populous group.
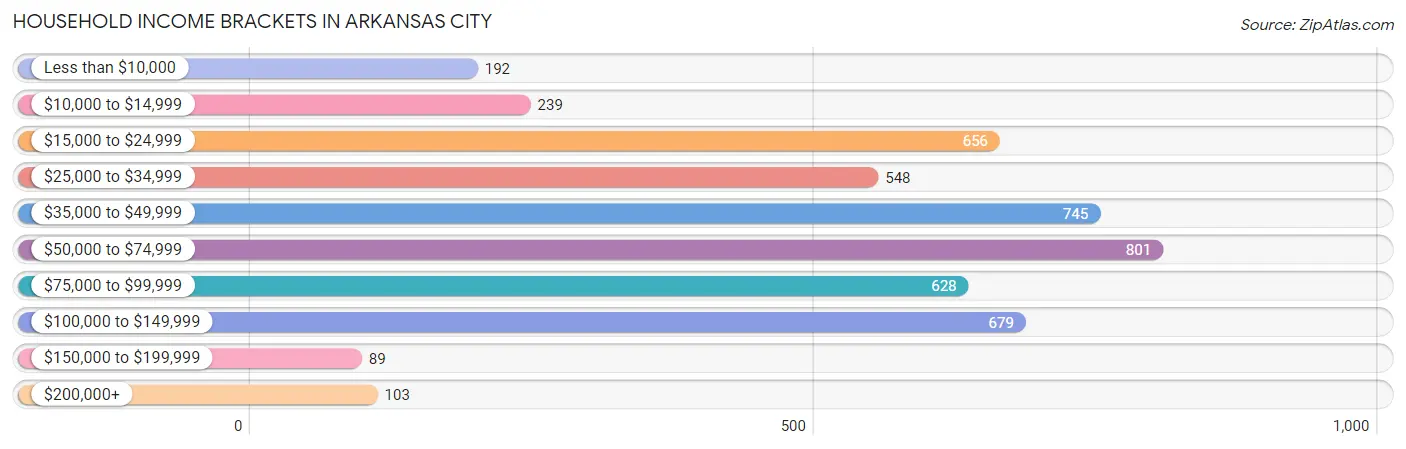
| Income Bracket | # Households | % Households |
| Less than $10,000 | 192 | 4.1% |
| $10,000 to $14,999 | 239 | 5.1% |
| $15,000 to $24,999 | 656 | 14.0% |
| $25,000 to $34,999 | 548 | 11.7% |
| $35,000 to $49,999 | 745 | 15.9% |
| $50,000 to $74,999 | 801 | 17.1% |
| $75,000 to $99,999 | 628 | 13.4% |
| $100,000 to $149,999 | 679 | 14.5% |
| $150,000 to $199,999 | 89 | 1.9% |
| $200,000+ | 103 | 2.2% |
Household Income by Householder Age in Arkansas City
The median household income in Arkansas City is $49,177, with the highest median household income of $54,609 found in the 25 to 44 years age bracket for the primary householder. A total of 1,380 households (29.5%) fall into this category. Meanwhile, the 65+ years age bracket for the primary householder has the lowest median household income of $43,600, with 1,286 households (27.5%) in this group.
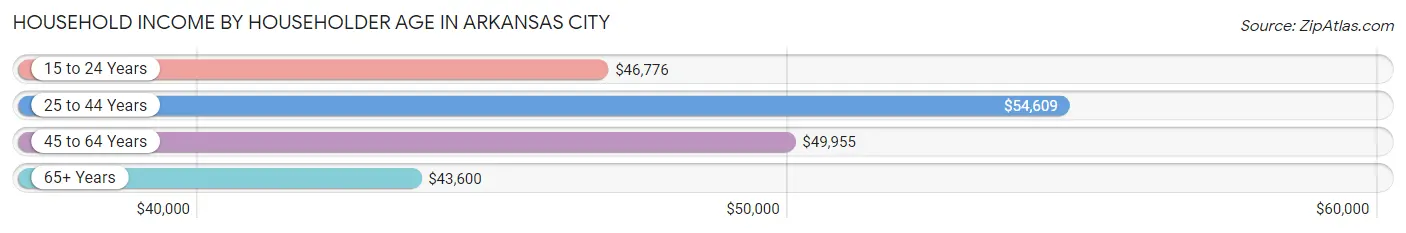
| Income Bracket | # Households | Median Income |
| 15 to 24 Years | 217 (4.6%) | $46,776 |
| 25 to 44 Years | 1,380 (29.5%) | $54,609 |
| 45 to 64 Years | 1,802 (38.5%) | $49,955 |
| 65+ Years | 1,286 (27.5%) | $43,600 |
| Total | 4,685 (100.0%) | $49,177 |
Poverty in Arkansas City
Income Below Poverty by Sex and Age in Arkansas City
With 10.6% poverty level for males and 20.6% for females among the residents of Arkansas City, 15 year old males and 16 and 17 year old females are the most vulnerable to poverty, with 20 males (58.8%) and 51 females (35.7%) in their respective age groups living below the poverty level.
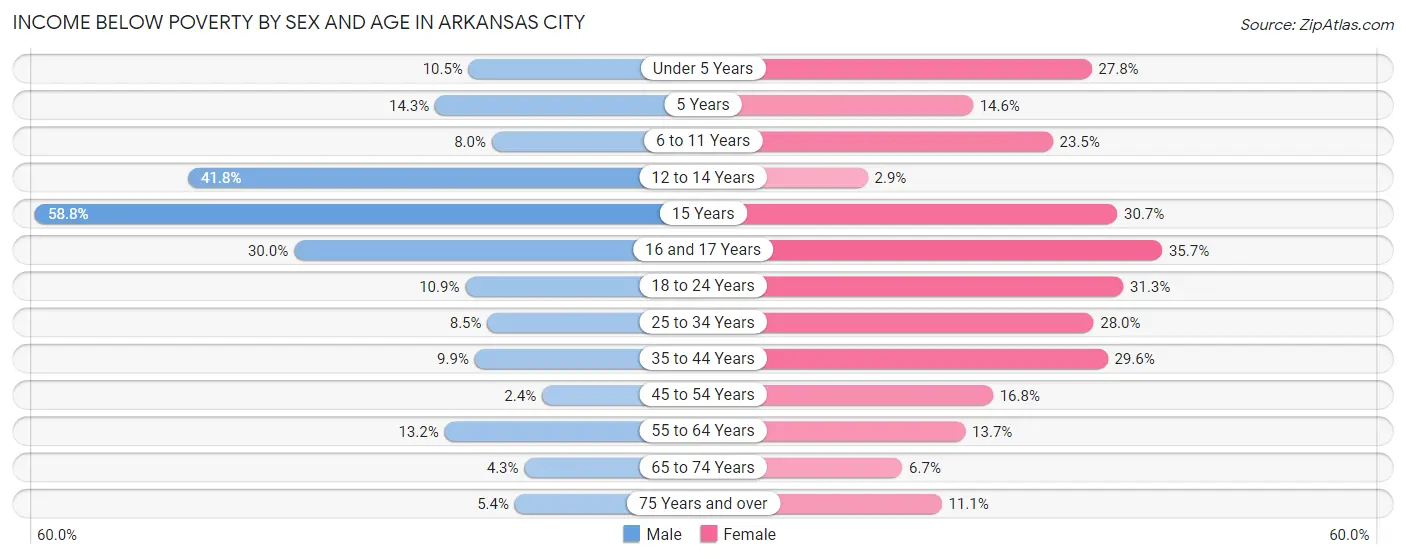
| Age Bracket | Male | Female |
| Under 5 Years | 49 (10.5%) | 77 (27.8%) |
| 5 Years | 12 (14.3%) | 7 (14.6%) |
| 6 to 11 Years | 37 (8.0%) | 131 (23.5%) |
| 12 to 14 Years | 84 (41.8%) | 9 (2.9%) |
| 15 Years | 20 (58.8%) | 42 (30.7%) |
| 16 and 17 Years | 36 (30.0%) | 51 (35.7%) |
| 18 to 24 Years | 53 (10.9%) | 162 (31.3%) |
| 25 to 34 Years | 67 (8.5%) | 219 (28.0%) |
| 35 to 44 Years | 67 (9.9%) | 208 (29.6%) |
| 45 to 54 Years | 13 (2.4%) | 98 (16.8%) |
| 55 to 64 Years | 110 (13.2%) | 116 (13.7%) |
| 65 to 74 Years | 25 (4.3%) | 39 (6.7%) |
| 75 Years and over | 16 (5.4%) | 31 (11.1%) |
| Total | 589 (10.6%) | 1,190 (20.6%) |
Income Above Poverty by Sex and Age in Arkansas City
According to the poverty statistics in Arkansas City, males aged 45 to 54 years and females aged 12 to 14 years are the age groups that are most secure financially, with 97.6% of males and 97.1% of females in these age groups living above the poverty line.
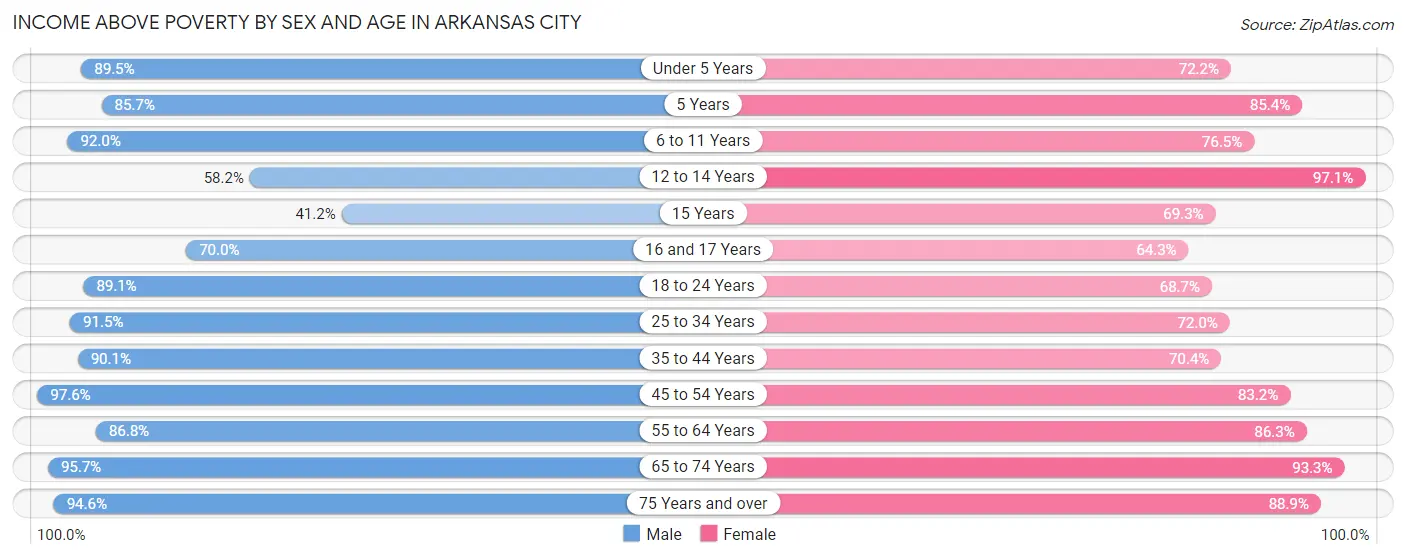
| Age Bracket | Male | Female |
| Under 5 Years | 416 (89.5%) | 200 (72.2%) |
| 5 Years | 72 (85.7%) | 41 (85.4%) |
| 6 to 11 Years | 427 (92.0%) | 427 (76.5%) |
| 12 to 14 Years | 117 (58.2%) | 305 (97.1%) |
| 15 Years | 14 (41.2%) | 95 (69.3%) |
| 16 and 17 Years | 84 (70.0%) | 92 (64.3%) |
| 18 to 24 Years | 432 (89.1%) | 355 (68.7%) |
| 25 to 34 Years | 725 (91.5%) | 563 (72.0%) |
| 35 to 44 Years | 612 (90.1%) | 495 (70.4%) |
| 45 to 54 Years | 534 (97.6%) | 485 (83.2%) |
| 55 to 64 Years | 721 (86.8%) | 728 (86.3%) |
| 65 to 74 Years | 551 (95.7%) | 541 (93.3%) |
| 75 Years and over | 280 (94.6%) | 248 (88.9%) |
| Total | 4,985 (89.4%) | 4,575 (79.4%) |
Income Below Poverty Among Married-Couple Families in Arkansas City
The poverty statistics for married-couple families in Arkansas City show that 6.2% or 108 of the total 1,735 families live below the poverty line. Families with 5 or more children have the highest poverty rate of 57.1%, comprising of 12 families. On the other hand, families with 1 or 2 children have the lowest poverty rate of 4.6%, which includes 26 families.
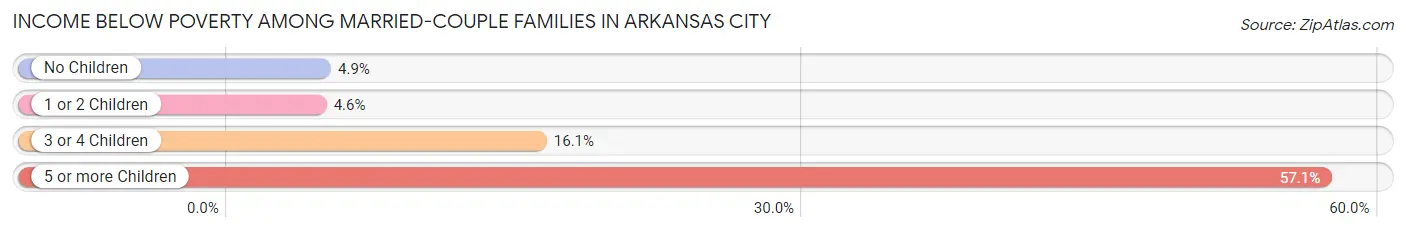
| Children | Above Poverty | Below Poverty |
| No Children | 978 (95.1%) | 50 (4.9%) |
| 1 or 2 Children | 536 (95.4%) | 26 (4.6%) |
| 3 or 4 Children | 104 (83.9%) | 20 (16.1%) |
| 5 or more Children | 9 (42.9%) | 12 (57.1%) |
| Total | 1,627 (93.8%) | 108 (6.2%) |
Income Below Poverty Among Single-Parent Households in Arkansas City
According to the poverty data in Arkansas City, 1.9% or 4 single-father households and 33.1% or 223 single-mother households are living below the poverty line. Among single-father households, those with 1 or 2 children have the highest poverty rate, with 4 households (4.4%) experiencing poverty. Likewise, among single-mother households, those with 3 or 4 children have the highest poverty rate, with 59 households (67.0%) falling below the poverty line.
| Children | Single Father | Single Mother |
| No Children | 0 (0.0%) | 5 (3.0%) |
| 1 or 2 Children | 4 (4.4%) | 159 (38.8%) |
| 3 or 4 Children | 0 (0.0%) | 59 (67.0%) |
| 5 or more Children | 0 (0.0%) | 0 (0.0%) |
| Total | 4 (1.9%) | 223 (33.1%) |
Income Below Poverty Among Married-Couple vs Single-Parent Households in Arkansas City
The poverty data for Arkansas City shows that 108 of the married-couple family households (6.2%) and 227 of the single-parent households (25.6%) are living below the poverty level. Within the married-couple family households, those with 5 or more children have the highest poverty rate, with 12 households (57.1%) falling below the poverty line. Among the single-parent households, those with 3 or 4 children have the highest poverty rate, with 59 household (34.3%) living below poverty.
| Children | Married-Couple Families | Single-Parent Households |
| No Children | 50 (4.9%) | 5 (2.4%) |
| 1 or 2 Children | 26 (4.6%) | 163 (32.6%) |
| 3 or 4 Children | 20 (16.1%) | 59 (34.3%) |
| 5 or more Children | 12 (57.1%) | 0 (0.0%) |
| Total | 108 (6.2%) | 227 (25.6%) |
Race in Arkansas City
The most populous races in Arkansas City are White / Caucasian (9,441 | 78.7%), Hispanic or Latino (2,550 | 21.3%), and Two or more Races (1,486 | 12.4%).
| Race | # Population | % Population |
| Asian | 24 | 0.2% |
| Black / African American | 357 | 3.0% |
| Hawaiian / Pacific | 0 | 0.0% |
| Hispanic or Latino | 2,550 | 21.3% |
| Native / Alaskan | 200 | 1.7% |
| White / Caucasian | 9,441 | 78.7% |
| Two or more Races | 1,486 | 12.4% |
| Some other Race | 489 | 4.1% |
| Total | 11,997 | 100.0% |
Ancestry in Arkansas City
The most populous ancestries reported in Arkansas City are Irish (2,025 | 16.9%), German (1,959 | 16.3%), Mexican (1,564 | 13.0%), English (1,228 | 10.2%), and American (1,139 | 9.5%), together accounting for 66.0% of all Arkansas City residents.
| Ancestry | # Population | % Population |
| African | 30 | 0.3% |
| Alaska Native | 4 | 0.0% |
| American | 1,139 | 9.5% |
| Apache | 14 | 0.1% |
| Arab | 6 | 0.1% |
| Bolivian | 21 | 0.2% |
| Brazilian | 4 | 0.0% |
| British | 27 | 0.2% |
| Canadian | 16 | 0.1% |
| Central American | 637 | 5.3% |
| Central American Indian | 6 | 0.1% |
| Cherokee | 237 | 2.0% |
| Chickasaw | 10 | 0.1% |
| Choctaw | 15 | 0.1% |
| Colombian | 74 | 0.6% |
| Comanche | 19 | 0.2% |
| Creek | 50 | 0.4% |
| Czech | 71 | 0.6% |
| Czechoslovakian | 10 | 0.1% |
| Danish | 232 | 1.9% |
| Dutch | 261 | 2.2% |
| Eastern European | 40 | 0.3% |
| Ecuadorian | 13 | 0.1% |
| English | 1,228 | 10.2% |
| European | 154 | 1.3% |
| Finnish | 13 | 0.1% |
| French | 103 | 0.9% |
| French Canadian | 1 | 0.0% |
| German | 1,959 | 16.3% |
| Guatemalan | 520 | 4.3% |
| Honduran | 30 | 0.3% |
| Indian (Asian) | 10 | 0.1% |
| Irish | 2,025 | 16.9% |
| Iroquois | 8 | 0.1% |
| Italian | 214 | 1.8% |
| Korean | 14 | 0.1% |
| Mexican | 1,564 | 13.0% |
| Navajo | 1 | 0.0% |
| Norwegian | 37 | 0.3% |
| Osage | 25 | 0.2% |
| Pennsylvania German | 17 | 0.1% |
| Polish | 132 | 1.1% |
| Potawatomi | 9 | 0.1% |
| Puerto Rican | 27 | 0.2% |
| Russian | 151 | 1.3% |
| Salvadoran | 87 | 0.7% |
| Scandinavian | 23 | 0.2% |
| Scotch-Irish | 43 | 0.4% |
| Scottish | 129 | 1.1% |
| Seminole | 3 | 0.0% |
| South American | 116 | 1.0% |
| Spaniard | 26 | 0.2% |
| Spanish | 161 | 1.3% |
| Sri Lankan | 74 | 0.6% |
| Subsaharan African | 30 | 0.3% |
| Swedish | 26 | 0.2% |
| Syrian | 6 | 0.1% |
| Uruguayan | 8 | 0.1% |
| Welsh | 17 | 0.1% |
| West Indian | 12 | 0.1% | View All 60 Rows |
Immigrants in Arkansas City
The most numerous immigrant groups reported in Arkansas City came from Latin America (677 | 5.6%), Central America (587 | 4.9%), Mexico (471 | 3.9%), El Salvador (69 | 0.6%), and Europe (66 | 0.5%), together accounting for 15.6% of all Arkansas City residents.
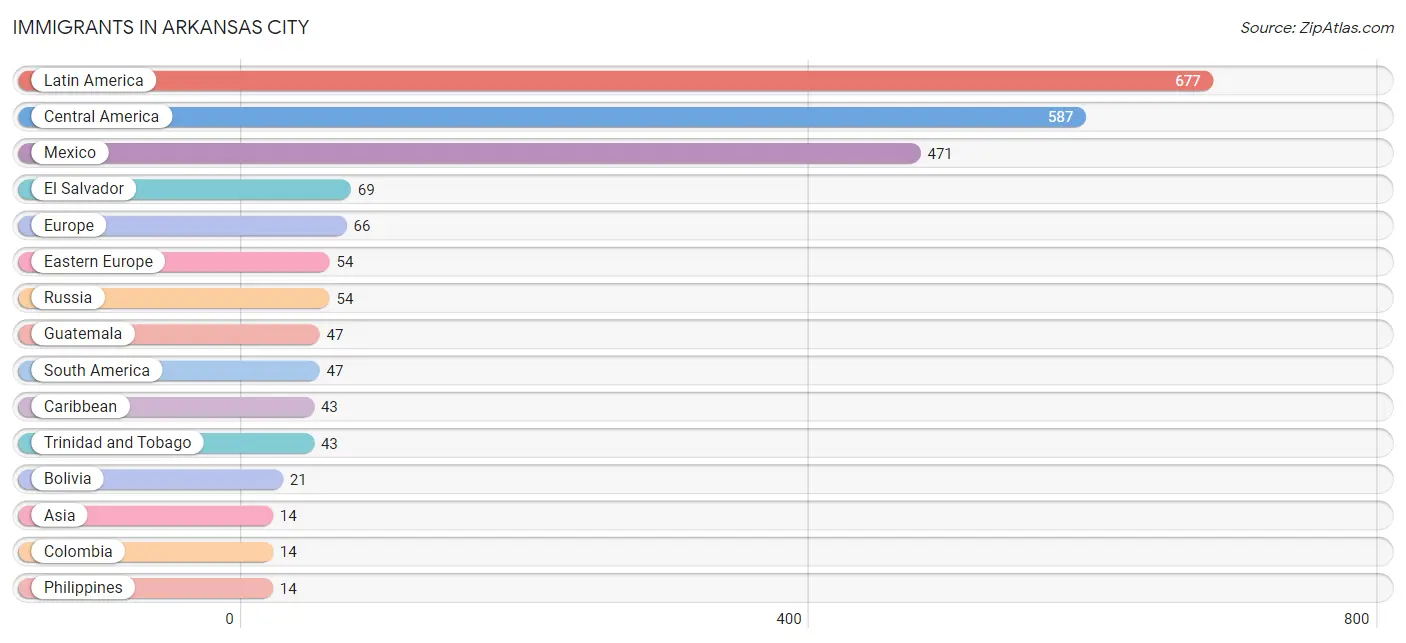
| Immigration Origin | # Population | % Population |
| Asia | 14 | 0.1% |
| Bolivia | 21 | 0.2% |
| Brazil | 4 | 0.0% |
| Canada | 8 | 0.1% |
| Caribbean | 43 | 0.4% |
| Central America | 587 | 4.9% |
| Colombia | 14 | 0.1% |
| Eastern Europe | 54 | 0.4% |
| El Salvador | 69 | 0.6% |
| Europe | 66 | 0.5% |
| Guatemala | 47 | 0.4% |
| Latin America | 677 | 5.6% |
| Mexico | 471 | 3.9% |
| Northern Europe | 12 | 0.1% |
| Philippines | 14 | 0.1% |
| Russia | 54 | 0.4% |
| South America | 47 | 0.4% |
| South Eastern Asia | 14 | 0.1% |
| Trinidad and Tobago | 43 | 0.4% |
| Uruguay | 8 | 0.1% | View All 20 Rows |
Sex and Age in Arkansas City
Sex and Age in Arkansas City
The most populous age groups in Arkansas City are 30 to 34 Years (494 | 8.3%) for men and 10 to 14 Years (548 | 9.1%) for women.
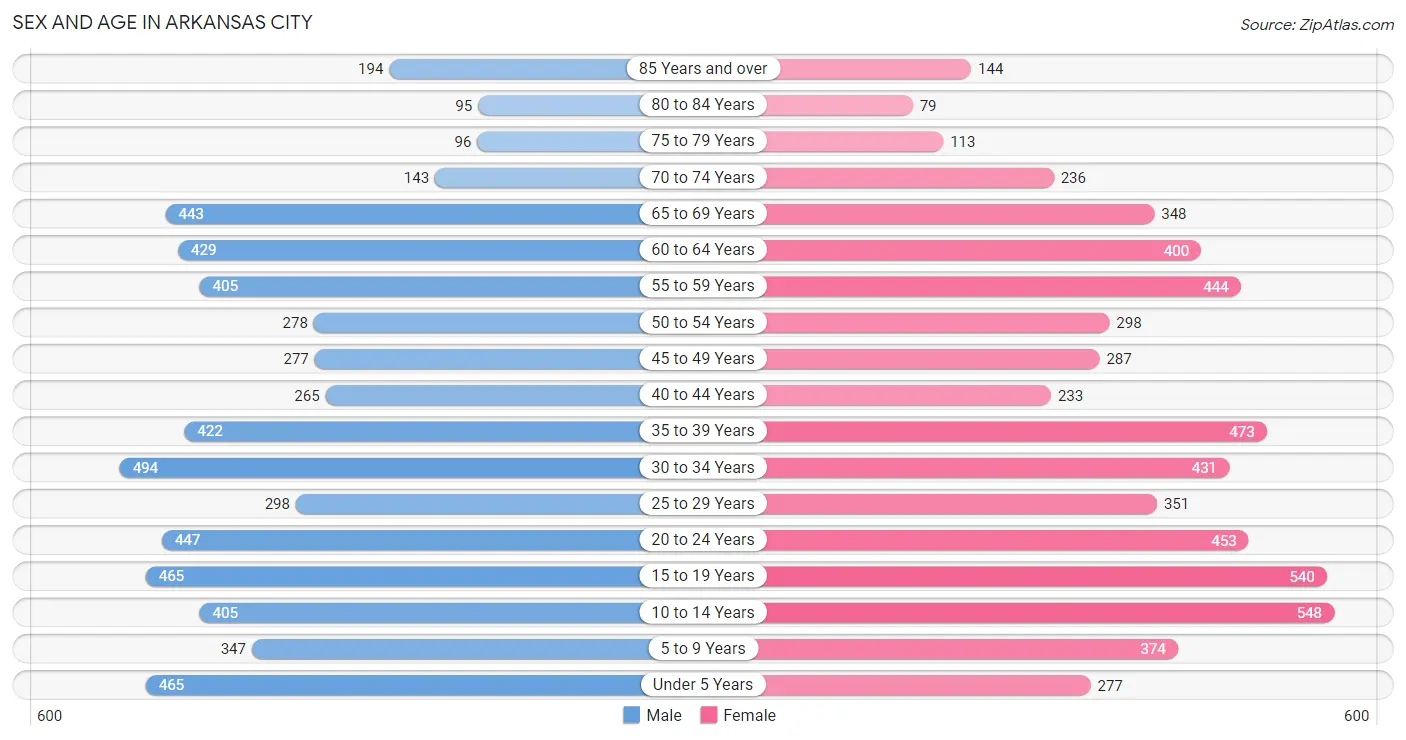
| Age Bracket | Male | Female |
| Under 5 Years | 465 (7.8%) | 277 (4.6%) |
| 5 to 9 Years | 347 (5.8%) | 374 (6.2%) |
| 10 to 14 Years | 405 (6.8%) | 548 (9.1%) |
| 15 to 19 Years | 465 (7.8%) | 540 (9.0%) |
| 20 to 24 Years | 447 (7.5%) | 453 (7.5%) |
| 25 to 29 Years | 298 (5.0%) | 351 (5.8%) |
| 30 to 34 Years | 494 (8.3%) | 431 (7.1%) |
| 35 to 39 Years | 422 (7.1%) | 473 (7.9%) |
| 40 to 44 Years | 265 (4.4%) | 233 (3.9%) |
| 45 to 49 Years | 277 (4.6%) | 287 (4.8%) |
| 50 to 54 Years | 278 (4.7%) | 298 (4.9%) |
| 55 to 59 Years | 405 (6.8%) | 444 (7.4%) |
| 60 to 64 Years | 429 (7.2%) | 400 (6.6%) |
| 65 to 69 Years | 443 (7.4%) | 348 (5.8%) |
| 70 to 74 Years | 143 (2.4%) | 236 (3.9%) |
| 75 to 79 Years | 96 (1.6%) | 113 (1.9%) |
| 80 to 84 Years | 95 (1.6%) | 79 (1.3%) |
| 85 Years and over | 194 (3.3%) | 144 (2.4%) |
| Total | 5,968 (100.0%) | 6,029 (100.0%) |
Families and Households in Arkansas City
Median Family Size in Arkansas City
The median family size in Arkansas City is 3.26 persons per family, with single male/father families (213 | 8.1%) accounting for the largest median family size of 4.02 persons per family. On the other hand, married-couple families (1,735 | 66.2%) represent the smallest median family size with 3.16 persons per family.
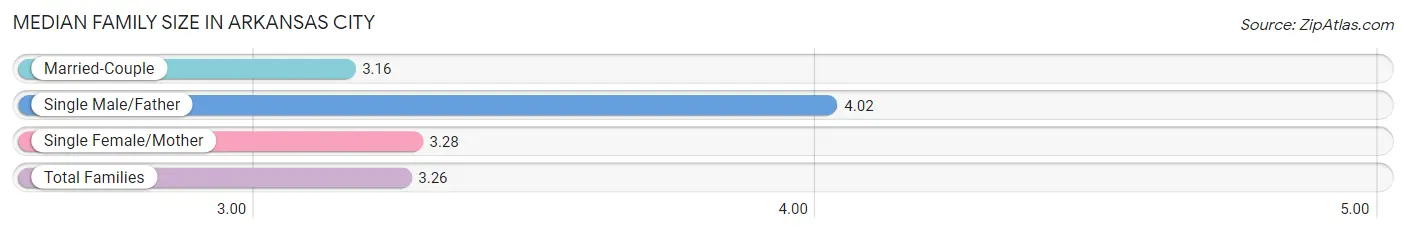
| Family Type | # Families | Family Size |
| Married-Couple | 1,735 (66.2%) | 3.16 |
| Single Male/Father | 213 (8.1%) | 4.02 |
| Single Female/Mother | 674 (25.7%) | 3.28 |
| Total Families | 2,622 (100.0%) | 3.26 |
Median Household Size in Arkansas City
The median household size in Arkansas City is 2.41 persons per household, with single male/father households (213 | 4.5%) accounting for the largest median household size of 4.19 persons per household. non-family households (2,063 | 44.0%) represent the smallest median household size with 1.17 persons per household.
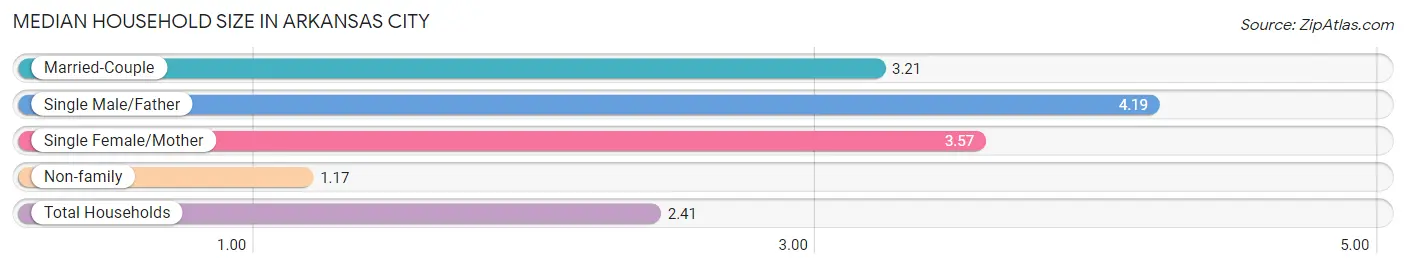
| Household Type | # Households | Household Size |
| Married-Couple | 1,735 (37.0%) | 3.21 |
| Single Male/Father | 213 (4.5%) | 4.19 |
| Single Female/Mother | 674 (14.4%) | 3.57 |
| Non-family | 2,063 (44.0%) | 1.17 |
| Total Households | 4,685 (100.0%) | 2.41 |
Household Size by Marriage Status in Arkansas City
Out of a total of 4,685 households in Arkansas City, 2,622 (56.0%) are family households, while 2,063 (44.0%) are nonfamily households. The most numerous type of family households are 2-person households, comprising 1,091, and the most common type of nonfamily households are 1-person households, comprising 1,850.
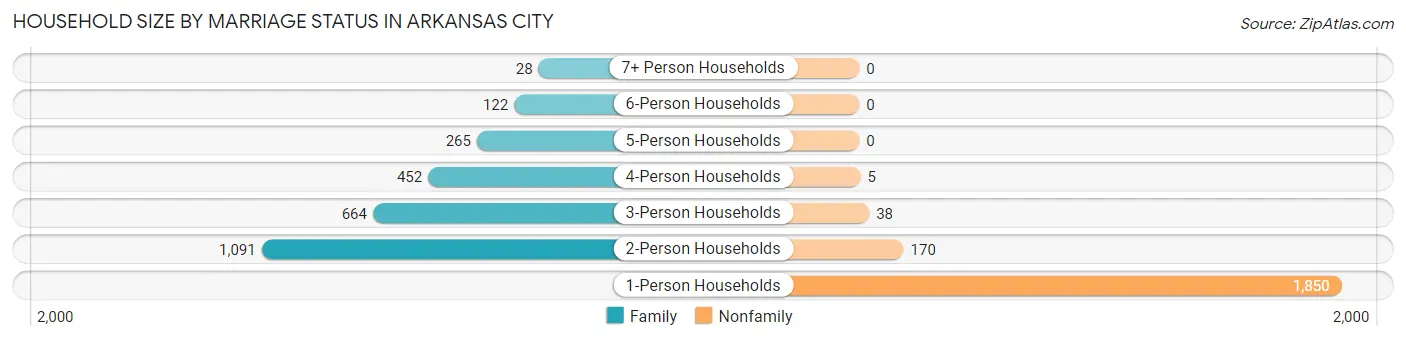
| Household Size | Family Households | Nonfamily Households |
| 1-Person Households | - | 1,850 (39.5%) |
| 2-Person Households | 1,091 (23.3%) | 170 (3.6%) |
| 3-Person Households | 664 (14.2%) | 38 (0.8%) |
| 4-Person Households | 452 (9.7%) | 5 (0.1%) |
| 5-Person Households | 265 (5.7%) | 0 (0.0%) |
| 6-Person Households | 122 (2.6%) | 0 (0.0%) |
| 7+ Person Households | 28 (0.6%) | 0 (0.0%) |
| Total | 2,622 (56.0%) | 2,063 (44.0%) |
Female Fertility in Arkansas City
Fertility by Age in Arkansas City
Average fertility rate in Arkansas City is 119.0 births per 1,000 women. Women in the age bracket of 20 to 34 years have the highest fertility rate with 260.0 births per 1,000 women. Women in the age bracket of 20 to 34 years acount for 95.3% of all women with births.
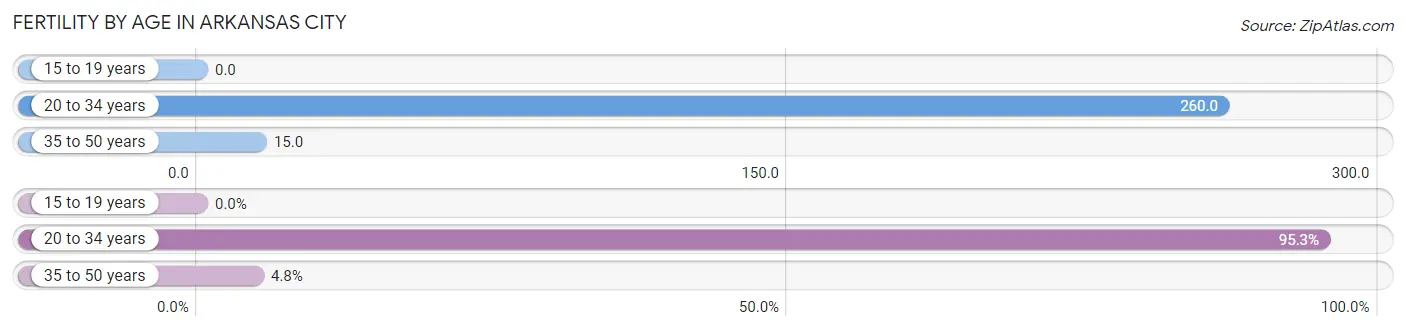
| Age Bracket | Women with Births | Births / 1,000 Women |
| 15 to 19 years | 0 (0.0%) | 0.0 |
| 20 to 34 years | 321 (95.3%) | 260.0 |
| 35 to 50 years | 16 (4.8%) | 15.0 |
| Total | 337 (100.0%) | 119.0 |
Fertility by Age by Marriage Status in Arkansas City
45.4% of women with births (337) in Arkansas City are married. The highest percentage of unmarried women with births falls into 20 to 34 years age bracket with 57.3% of them unmarried at the time of birth, while the lowest percentage of unmarried women with births belong to 35 to 50 years age bracket with 0.0% of them unmarried.
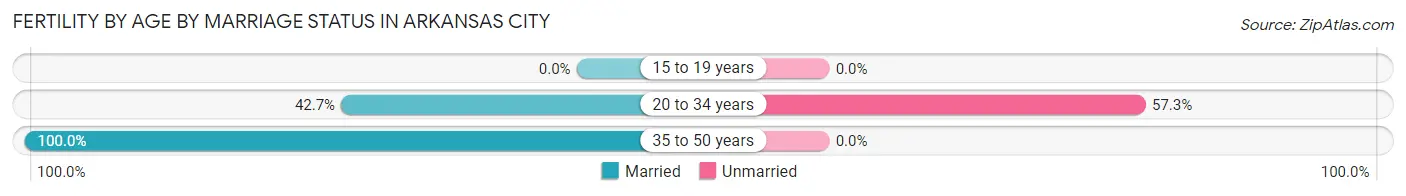
| Age Bracket | Married | Unmarried |
| 15 to 19 years | 0 (0.0%) | 0 (0.0%) |
| 20 to 34 years | 137 (42.7%) | 184 (57.3%) |
| 35 to 50 years | 16 (100.0%) | 0 (0.0%) |
| Total | 153 (45.4%) | 184 (54.6%) |
Fertility by Education in Arkansas City
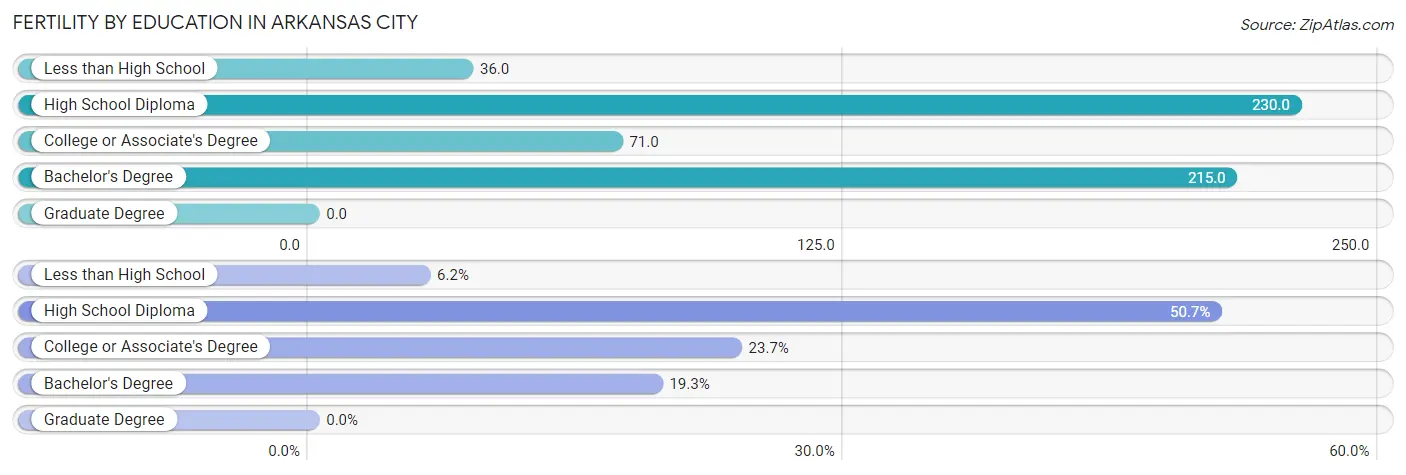
| Educational Attainment | Women with Births | Births / 1,000 Women |
| Less than High School | 21 (6.2%) | 36.0 |
| High School Diploma | 171 (50.7%) | 230.0 |
| College or Associate's Degree | 80 (23.7%) | 71.0 |
| Bachelor's Degree | 65 (19.3%) | 215.0 |
| Graduate Degree | 0 (0.0%) | 0.0 |
| Total | 337 (100.0%) | 119.0 |
Fertility by Education by Marriage Status in Arkansas City
54.6% of women with births in Arkansas City are unmarried. Women with the educational attainment of less than high school are most likely to be married with 100.0% of them married at childbirth, while women with the educational attainment of bachelor's degree are least likely to be married with 81.5% of them unmarried at childbirth.
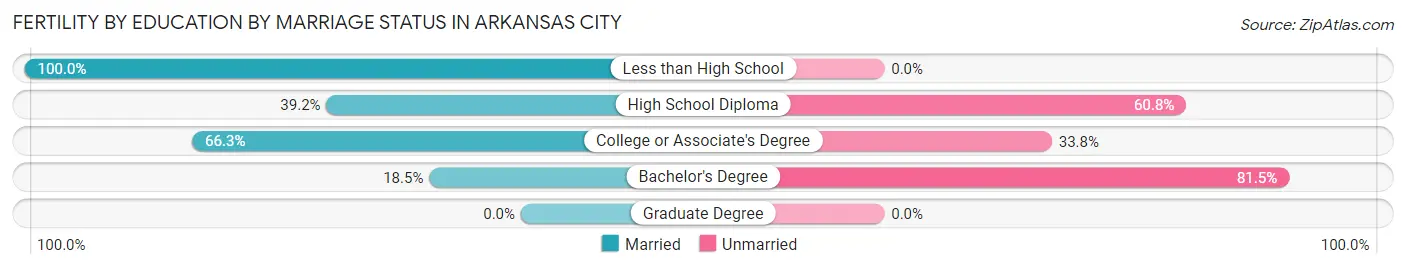
| Educational Attainment | Married | Unmarried |
| Less than High School | 21 (100.0%) | 0 (0.0%) |
| High School Diploma | 67 (39.2%) | 104 (60.8%) |
| College or Associate's Degree | 53 (66.2%) | 27 (33.8%) |
| Bachelor's Degree | 12 (18.5%) | 53 (81.5%) |
| Graduate Degree | 0 (0.0%) | 0 (0.0%) |
| Total | 153 (45.4%) | 184 (54.6%) |
Employment Characteristics in Arkansas City
Employment by Class of Employer in Arkansas City
Among the 4,897 employed individuals in Arkansas City, private company employees (3,343 | 68.3%), local government employees (605 | 12.3%), and not-for-profit organizations (370 | 7.6%) make up the most common classes of employment.
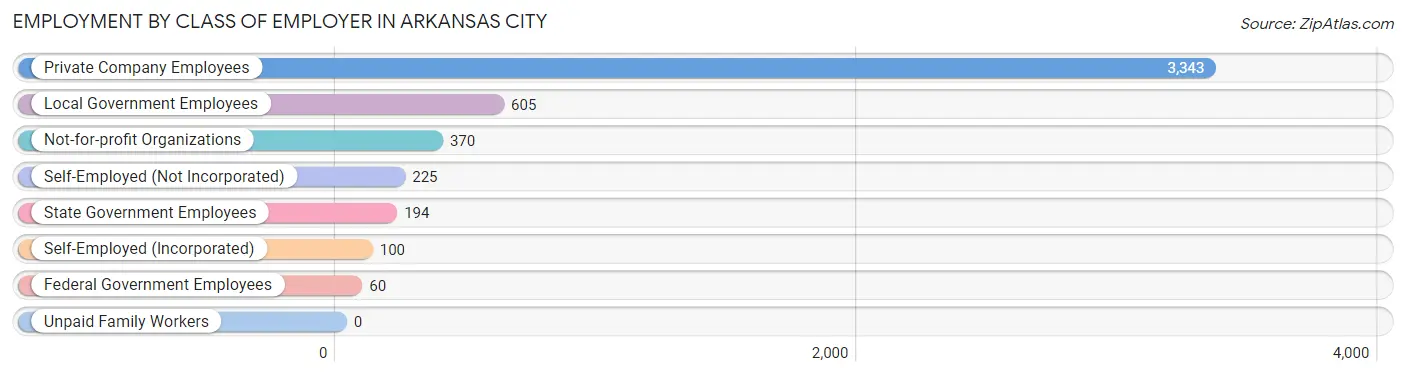
| Employer Class | # Employees | % Employees |
| Private Company Employees | 3,343 | 68.3% |
| Self-Employed (Incorporated) | 100 | 2.0% |
| Self-Employed (Not Incorporated) | 225 | 4.6% |
| Not-for-profit Organizations | 370 | 7.6% |
| Local Government Employees | 605 | 12.3% |
| State Government Employees | 194 | 4.0% |
| Federal Government Employees | 60 | 1.2% |
| Unpaid Family Workers | 0 | 0.0% |
| Total | 4,897 | 100.0% |
Employment Status by Age in Arkansas City
According to the labor force statistics for Arkansas City, out of the total population over 16 years of age (9,410), 57.4% or 5,401 individuals are in the labor force, with 6.7% or 362 of them unemployed. The age group with the highest labor force participation rate is 30 to 34 years, with 86.2% or 797 individuals in the labor force. Within the labor force, the 35 to 44 years age range has the highest percentage of unemployed individuals, with 14.7% or 176 of them being unemployed.
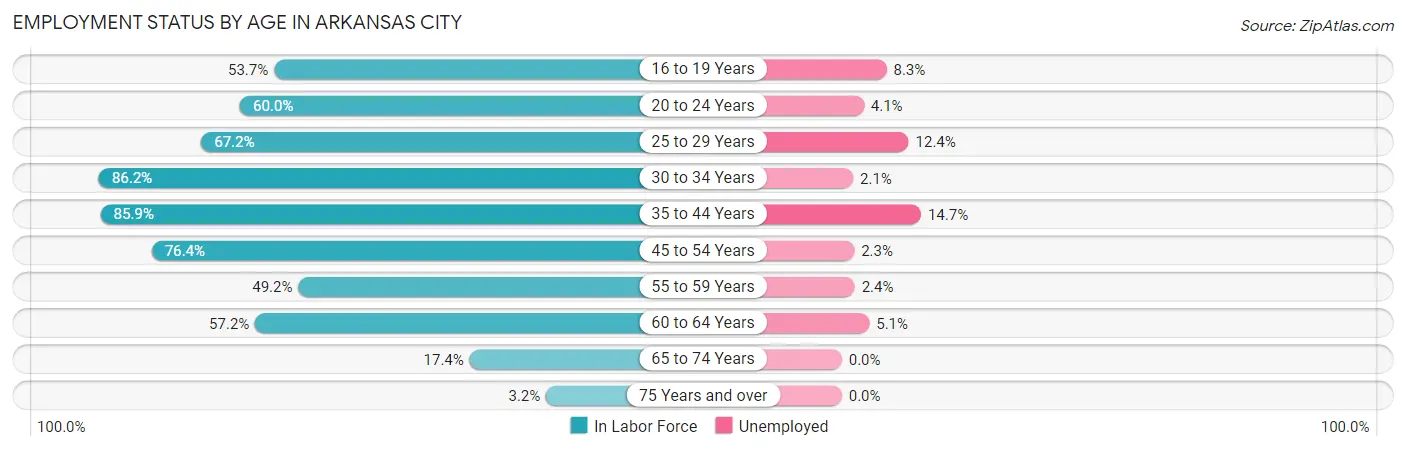
| Age Bracket | In Labor Force | Unemployed |
| 16 to 19 Years | 448 (53.7%) | 37 (8.3%) |
| 20 to 24 Years | 540 (60.0%) | 22 (4.1%) |
| 25 to 29 Years | 436 (67.2%) | 54 (12.4%) |
| 30 to 34 Years | 797 (86.2%) | 17 (2.1%) |
| 35 to 44 Years | 1,197 (85.9%) | 176 (14.7%) |
| 45 to 54 Years | 871 (76.4%) | 20 (2.3%) |
| 55 to 59 Years | 418 (49.2%) | 10 (2.4%) |
| 60 to 64 Years | 474 (57.2%) | 24 (5.1%) |
| 65 to 74 Years | 204 (17.4%) | 0 (0.0%) |
| 75 Years and over | 23 (3.2%) | 0 (0.0%) |
| Total | 5,401 (57.4%) | 362 (6.7%) |
Employment Status by Educational Attainment in Arkansas City
According to labor force statistics for Arkansas City, 72.5% of individuals (4,194) out of the total population between 25 and 64 years of age (5,785) are in the labor force, with 7.2% or 302 of them being unemployed. The group with the highest labor force participation rate are those with the educational attainment of bachelor's degree or higher, with 78.6% or 878 individuals in the labor force. Within the labor force, individuals with college / associate degree education have the highest percentage of unemployment, with 8.7% or 132 of them being unemployed.
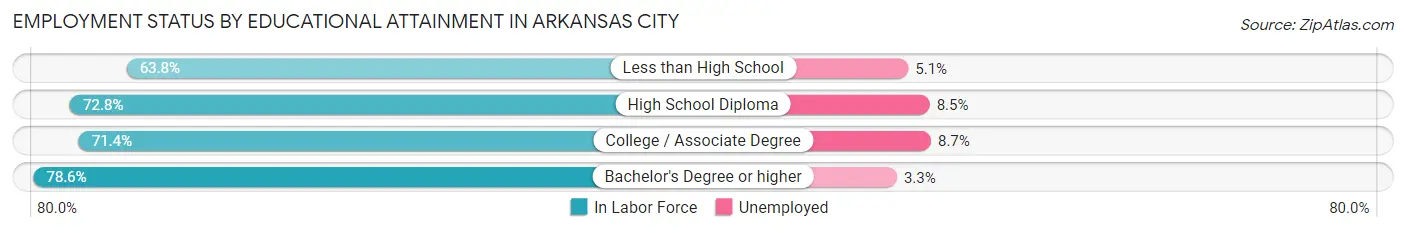
| Educational Attainment | In Labor Force | Unemployed |
| Less than High School | 392 (63.8%) | 31 (5.1%) |
| High School Diploma | 1,404 (72.8%) | 164 (8.5%) |
| College / Associate Degree | 1,517 (71.4%) | 185 (8.7%) |
| Bachelor's Degree or higher | 878 (78.6%) | 37 (3.3%) |
| Total | 4,194 (72.5%) | 417 (7.2%) |
Employment Occupations by Sex in Arkansas City
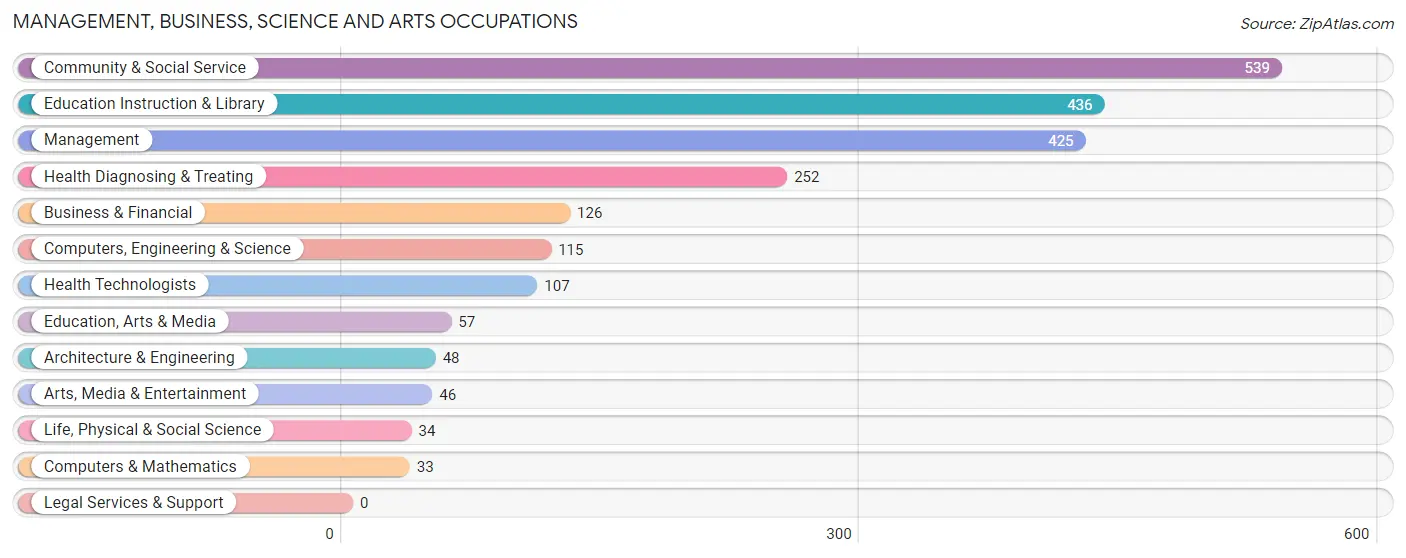
Management, Business, Science and Arts Occupations
The most common Management, Business, Science and Arts occupations in Arkansas City are Community & Social Service (539 | 10.7%), Education Instruction & Library (436 | 8.6%), Management (425 | 8.4%), Health Diagnosing & Treating (252 | 5.0%), and Business & Financial (126 | 2.5%).
Management, Business, Science and Arts Occupations by Sex
Within the Management, Business, Science and Arts occupations in Arkansas City, the most male-oriented occupations are Architecture & Engineering (91.7%), Computers & Mathematics (90.9%), and Arts, Media & Entertainment (69.6%), while the most female-oriented occupations are Life, Physical & Social Science (100.0%), Education, Arts & Media (91.2%), and Health Diagnosing & Treating (78.6%).
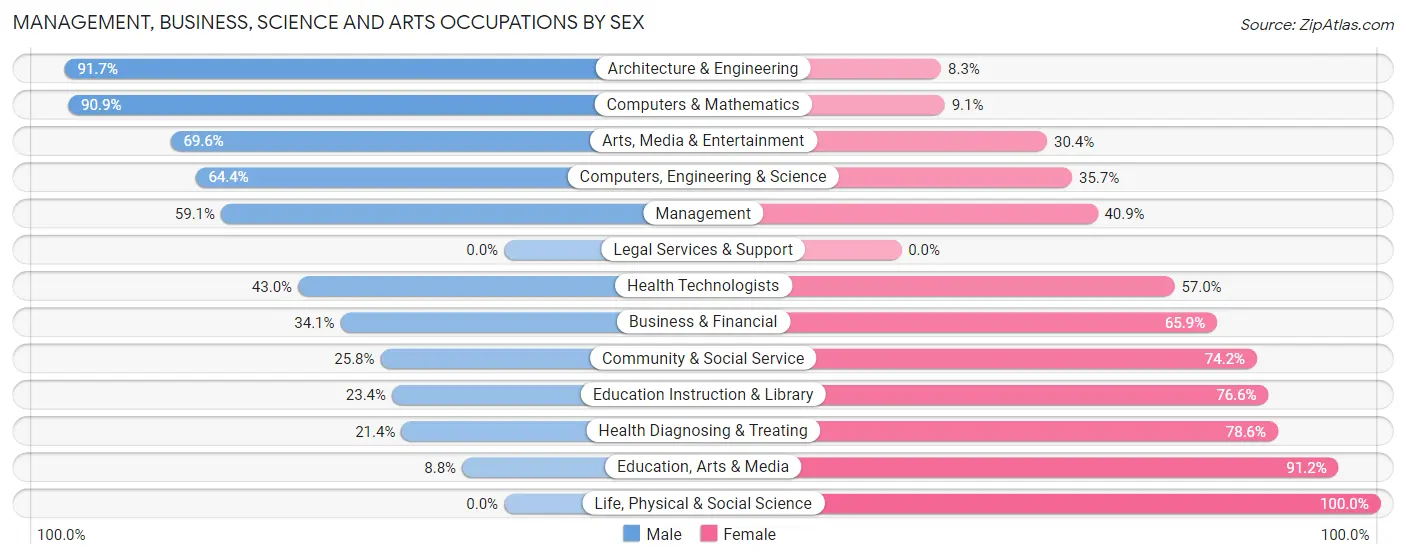
| Occupation | Male | Female |
| Management | 251 (59.1%) | 174 (40.9%) |
| Business & Financial | 43 (34.1%) | 83 (65.9%) |
| Computers, Engineering & Science | 74 (64.3%) | 41 (35.6%) |
| Computers & Mathematics | 30 (90.9%) | 3 (9.1%) |
| Architecture & Engineering | 44 (91.7%) | 4 (8.3%) |
| Life, Physical & Social Science | 0 (0.0%) | 34 (100.0%) |
| Community & Social Service | 139 (25.8%) | 400 (74.2%) |
| Education, Arts & Media | 5 (8.8%) | 52 (91.2%) |
| Legal Services & Support | 0 (0.0%) | 0 (0.0%) |
| Education Instruction & Library | 102 (23.4%) | 334 (76.6%) |
| Arts, Media & Entertainment | 32 (69.6%) | 14 (30.4%) |
| Health Diagnosing & Treating | 54 (21.4%) | 198 (78.6%) |
| Health Technologists | 46 (43.0%) | 61 (57.0%) |
| Total (Category) | 561 (38.5%) | 896 (61.5%) |
| Total (Overall) | 2,731 (54.1%) | 2,315 (45.9%) |
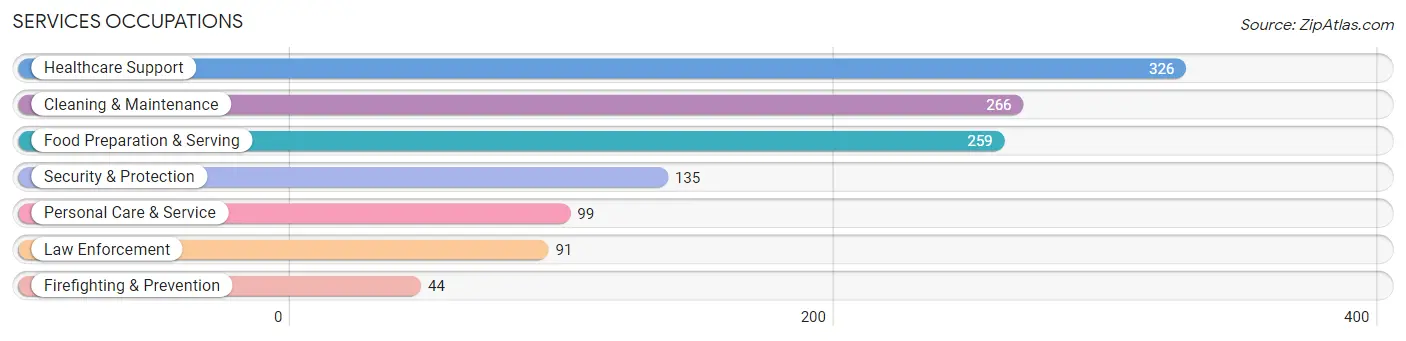
Services Occupations
The most common Services occupations in Arkansas City are Healthcare Support (326 | 6.5%), Cleaning & Maintenance (266 | 5.3%), Food Preparation & Serving (259 | 5.1%), Security & Protection (135 | 2.7%), and Personal Care & Service (99 | 2.0%).
Services Occupations by Sex
Within the Services occupations in Arkansas City, the most male-oriented occupations are Law Enforcement (74.7%), Security & Protection (65.9%), and Food Preparation & Serving (64.9%), while the most female-oriented occupations are Personal Care & Service (77.8%), Cleaning & Maintenance (70.7%), and Healthcare Support (57.7%).
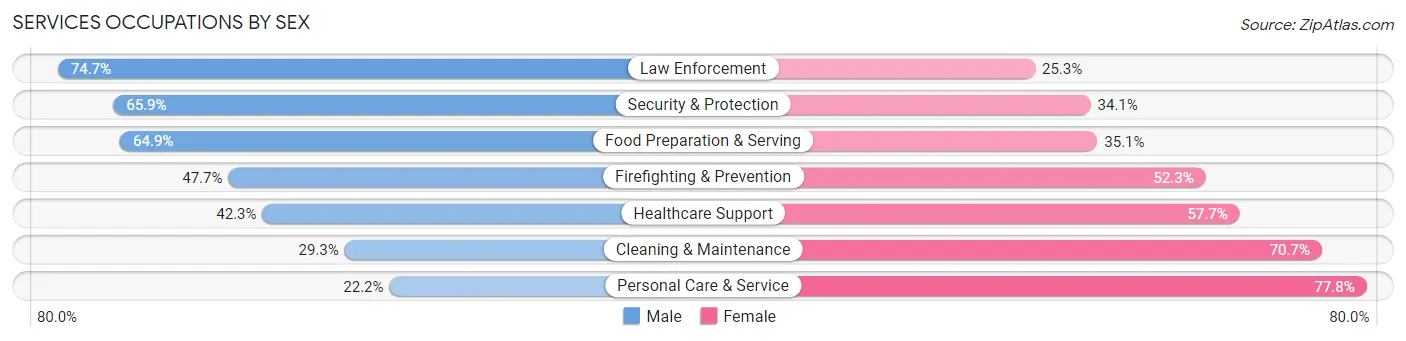
| Occupation | Male | Female |
| Healthcare Support | 138 (42.3%) | 188 (57.7%) |
| Security & Protection | 89 (65.9%) | 46 (34.1%) |
| Firefighting & Prevention | 21 (47.7%) | 23 (52.3%) |
| Law Enforcement | 68 (74.7%) | 23 (25.3%) |
| Food Preparation & Serving | 168 (64.9%) | 91 (35.1%) |
| Cleaning & Maintenance | 78 (29.3%) | 188 (70.7%) |
| Personal Care & Service | 22 (22.2%) | 77 (77.8%) |
| Total (Category) | 495 (45.6%) | 590 (54.4%) |
| Total (Overall) | 2,731 (54.1%) | 2,315 (45.9%) |
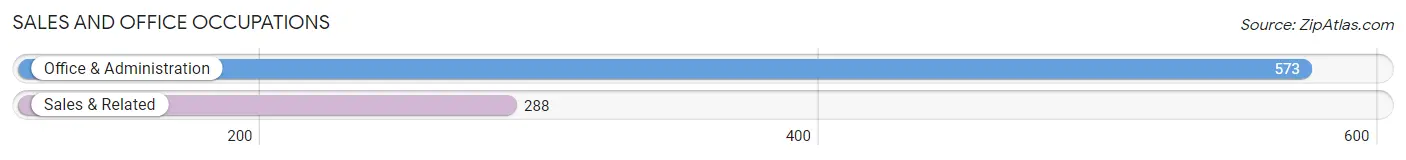
Sales and Office Occupations
The most common Sales and Office occupations in Arkansas City are Office & Administration (573 | 11.4%), and Sales & Related (288 | 5.7%).
Sales and Office Occupations by Sex
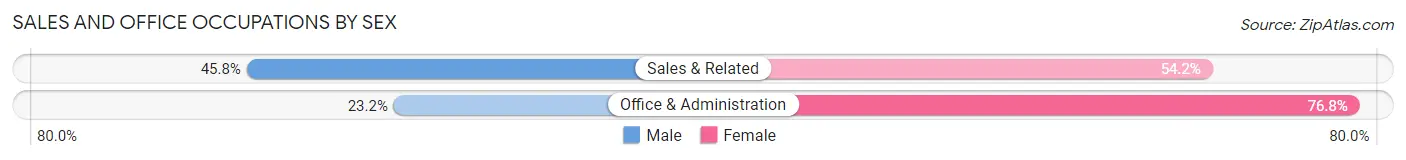
| Occupation | Male | Female |
| Sales & Related | 132 (45.8%) | 156 (54.2%) |
| Office & Administration | 133 (23.2%) | 440 (76.8%) |
| Total (Category) | 265 (30.8%) | 596 (69.2%) |
| Total (Overall) | 2,731 (54.1%) | 2,315 (45.9%) |
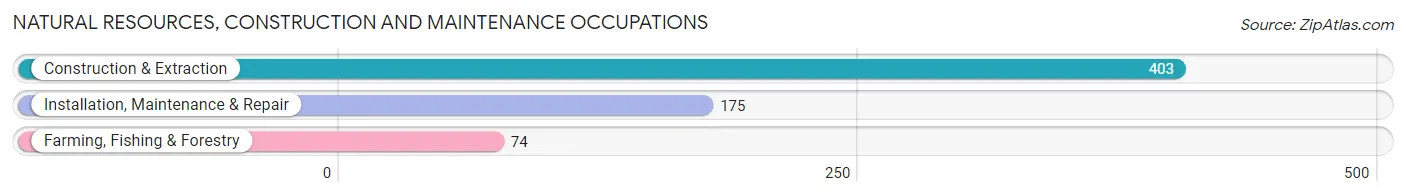
Natural Resources, Construction and Maintenance Occupations
The most common Natural Resources, Construction and Maintenance occupations in Arkansas City are Construction & Extraction (403 | 8.0%), Installation, Maintenance & Repair (175 | 3.5%), and Farming, Fishing & Forestry (74 | 1.5%).
Natural Resources, Construction and Maintenance Occupations by Sex
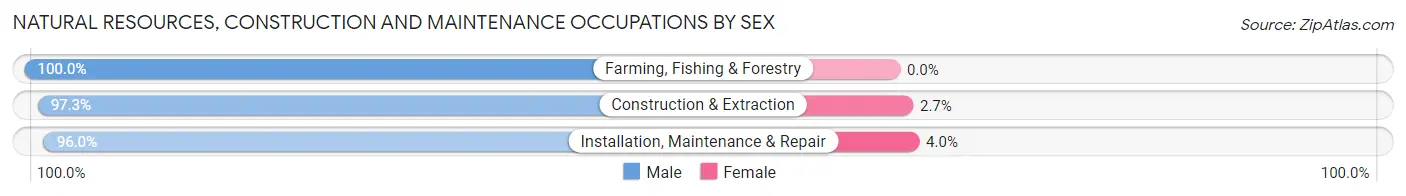
| Occupation | Male | Female |
| Farming, Fishing & Forestry | 74 (100.0%) | 0 (0.0%) |
| Construction & Extraction | 392 (97.3%) | 11 (2.7%) |
| Installation, Maintenance & Repair | 168 (96.0%) | 7 (4.0%) |
| Total (Category) | 634 (97.2%) | 18 (2.8%) |
| Total (Overall) | 2,731 (54.1%) | 2,315 (45.9%) |
Production, Transportation and Moving Occupations
The most common Production, Transportation and Moving occupations in Arkansas City are Production (559 | 11.1%), Transportation (230 | 4.6%), and Material Moving (202 | 4.0%).
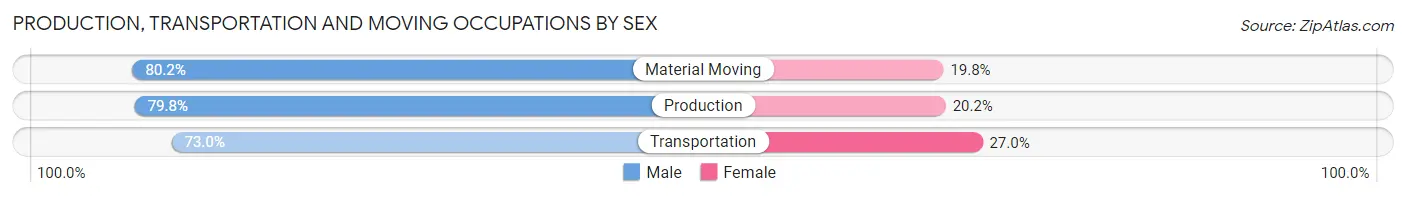
Production, Transportation and Moving Occupations by Sex
| Occupation | Male | Female |
| Production | 446 (79.8%) | 113 (20.2%) |
| Transportation | 168 (73.0%) | 62 (27.0%) |
| Material Moving | 162 (80.2%) | 40 (19.8%) |
| Total (Category) | 776 (78.3%) | 215 (21.7%) |
| Total (Overall) | 2,731 (54.1%) | 2,315 (45.9%) |
Employment Industries by Sex in Arkansas City
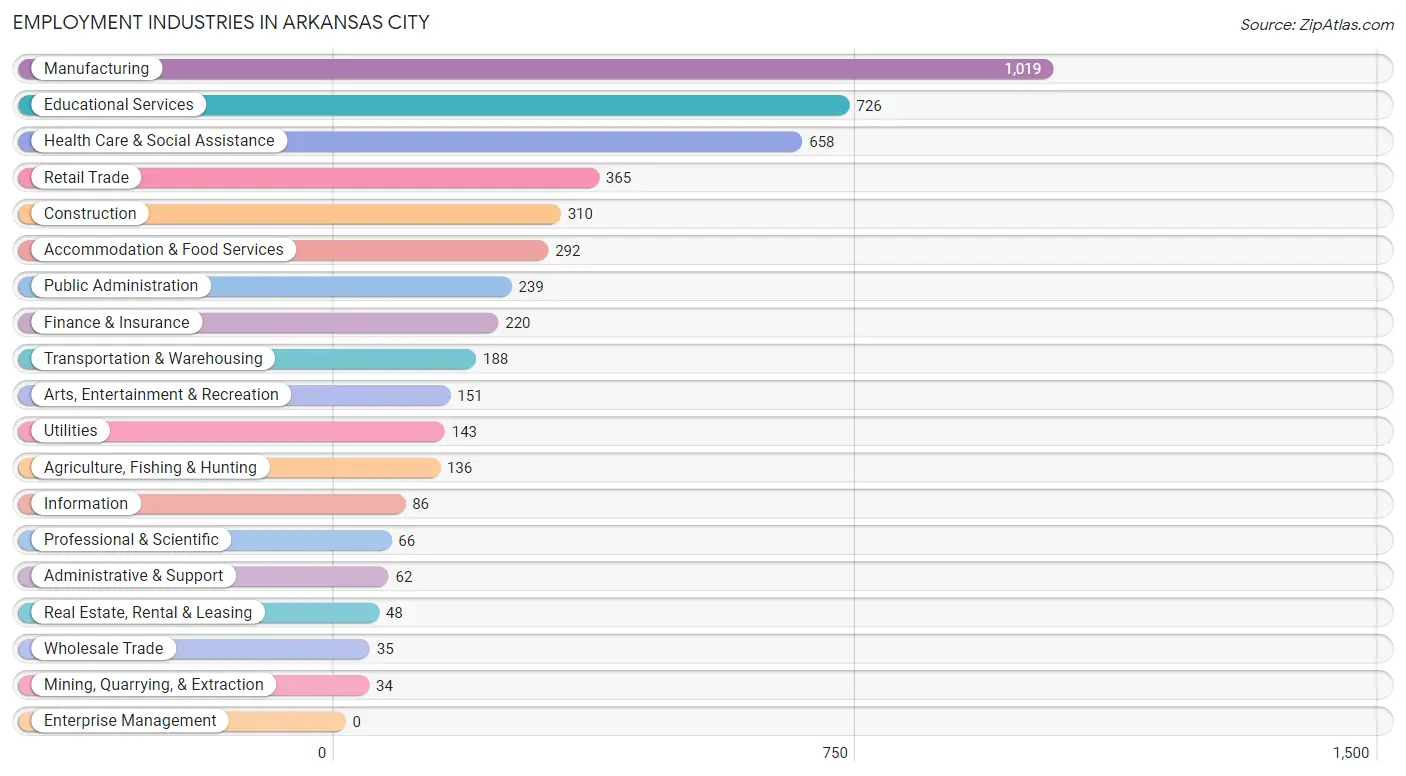
Employment Industries in Arkansas City
The major employment industries in Arkansas City include Manufacturing (1,019 | 20.2%), Educational Services (726 | 14.4%), Health Care & Social Assistance (658 | 13.0%), Retail Trade (365 | 7.2%), and Construction (310 | 6.1%).
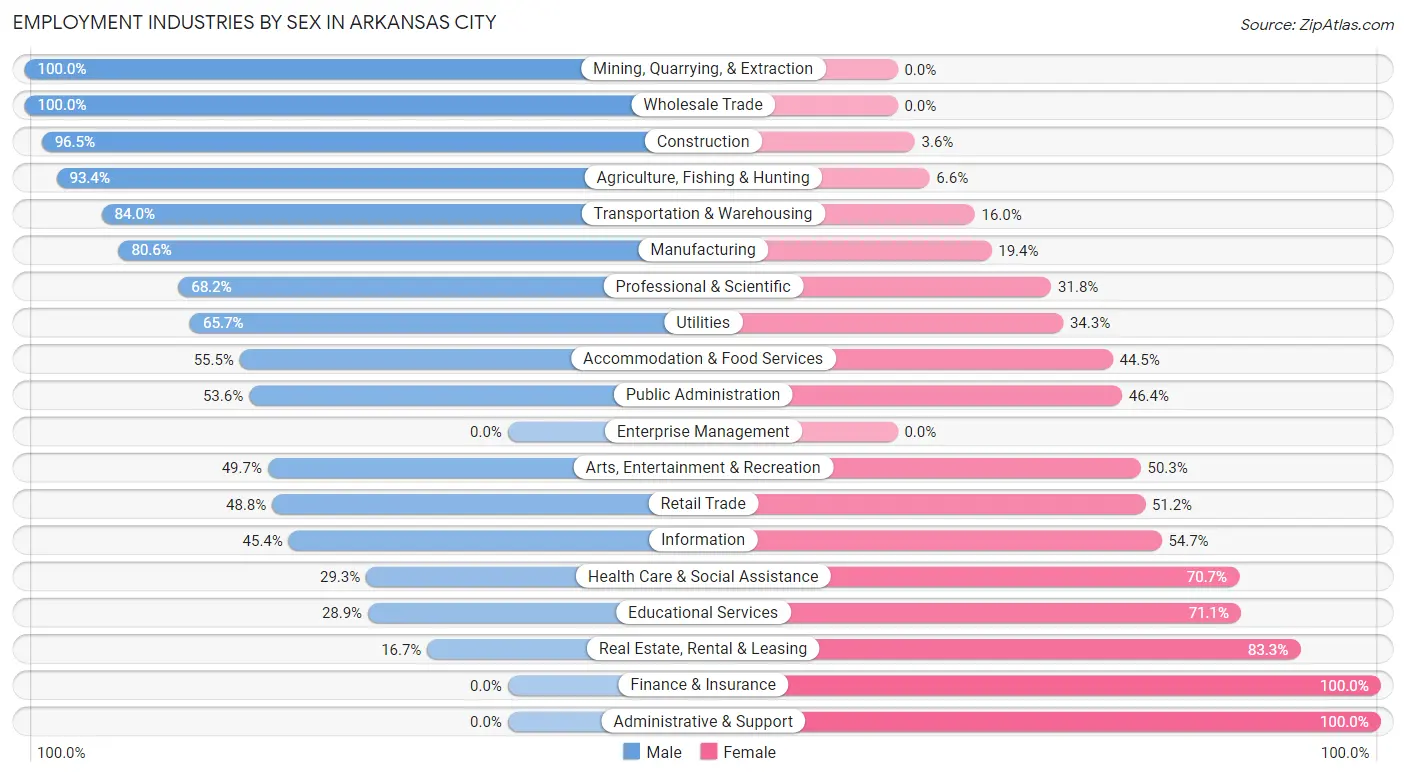
Employment Industries by Sex in Arkansas City
The Arkansas City industries that see more men than women are Mining, Quarrying, & Extraction (100.0%), Wholesale Trade (100.0%), and Construction (96.5%), whereas the industries that tend to have a higher number of women are Finance & Insurance (100.0%), Administrative & Support (100.0%), and Real Estate, Rental & Leasing (83.3%).
| Industry | Male | Female |
| Agriculture, Fishing & Hunting | 127 (93.4%) | 9 (6.6%) |
| Mining, Quarrying, & Extraction | 34 (100.0%) | 0 (0.0%) |
| Construction | 299 (96.5%) | 11 (3.5%) |
| Manufacturing | 821 (80.6%) | 198 (19.4%) |
| Wholesale Trade | 35 (100.0%) | 0 (0.0%) |
| Retail Trade | 178 (48.8%) | 187 (51.2%) |
| Transportation & Warehousing | 158 (84.0%) | 30 (16.0%) |
| Utilities | 94 (65.7%) | 49 (34.3%) |
| Information | 39 (45.4%) | 47 (54.6%) |
| Finance & Insurance | 0 (0.0%) | 220 (100.0%) |
| Real Estate, Rental & Leasing | 8 (16.7%) | 40 (83.3%) |
| Professional & Scientific | 45 (68.2%) | 21 (31.8%) |
| Enterprise Management | 0 (0.0%) | 0 (0.0%) |
| Administrative & Support | 0 (0.0%) | 62 (100.0%) |
| Educational Services | 210 (28.9%) | 516 (71.1%) |
| Health Care & Social Assistance | 193 (29.3%) | 465 (70.7%) |
| Arts, Entertainment & Recreation | 75 (49.7%) | 76 (50.3%) |
| Accommodation & Food Services | 162 (55.5%) | 130 (44.5%) |
| Public Administration | 128 (53.6%) | 111 (46.4%) |
| Total | 2,731 (54.1%) | 2,315 (45.9%) |
Education in Arkansas City
School Enrollment in Arkansas City
The most common levels of schooling among the 3,298 students in Arkansas City are college / undergraduate (995 | 30.2%), elementary school (799 | 24.2%), and middle school (676 | 20.5%).
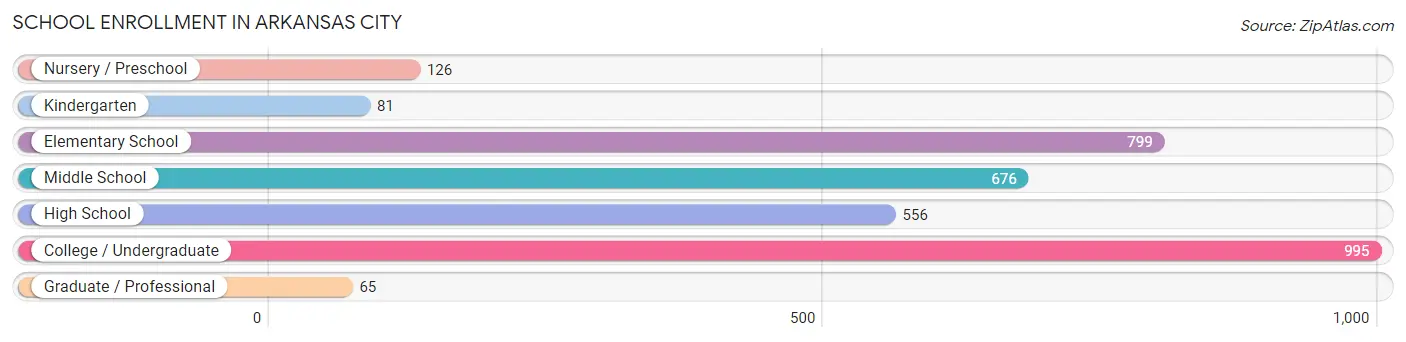
| School Level | # Students | % Students |
| Nursery / Preschool | 126 | 3.8% |
| Kindergarten | 81 | 2.5% |
| Elementary School | 799 | 24.2% |
| Middle School | 676 | 20.5% |
| High School | 556 | 16.9% |
| College / Undergraduate | 995 | 30.2% |
| Graduate / Professional | 65 | 2.0% |
| Total | 3,298 | 100.0% |
School Enrollment by Age by Funding Source in Arkansas City
Out of a total of 3,298 students who are enrolled in schools in Arkansas City, 557 (16.9%) attend a private institution, while the remaining 2,741 (83.1%) are enrolled in public schools. The age group of 20 to 24 year olds has the highest likelihood of being enrolled in private schools, with 281 (63.1% in the age bracket) enrolled. Conversely, the age group of 35 years and over has the lowest likelihood of being enrolled in a private school, with 123 (100.0% in the age bracket) attending a public institution.
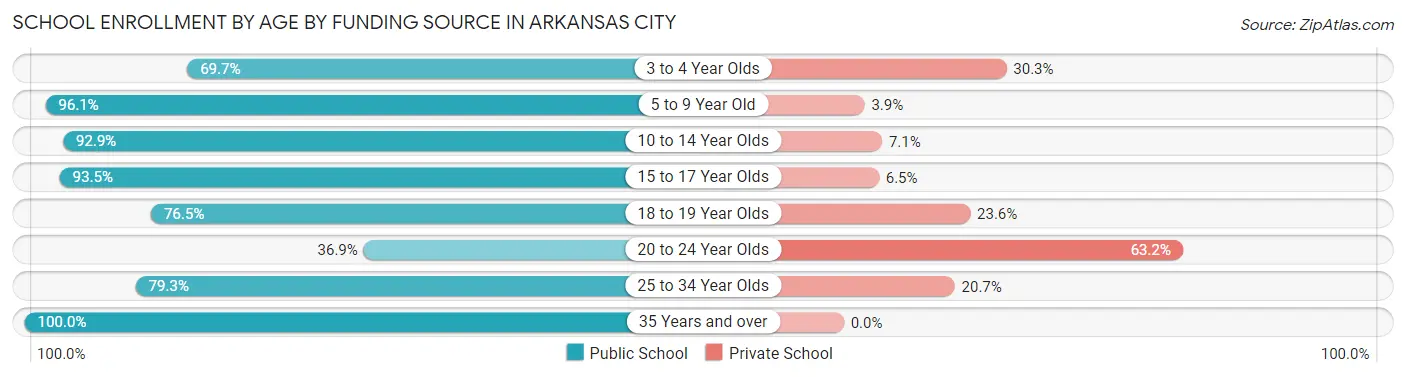
| Age Bracket | Public School | Private School |
| 3 to 4 Year Olds | 46 (69.7%) | 20 (30.3%) |
| 5 to 9 Year Old | 668 (96.1%) | 27 (3.9%) |
| 10 to 14 Year Olds | 885 (92.9%) | 68 (7.1%) |
| 15 to 17 Year Olds | 400 (93.5%) | 28 (6.5%) |
| 18 to 19 Year Olds | 357 (76.4%) | 110 (23.5%) |
| 20 to 24 Year Olds | 164 (36.8%) | 281 (63.1%) |
| 25 to 34 Year Olds | 96 (79.3%) | 25 (20.7%) |
| 35 Years and over | 123 (100.0%) | 0 (0.0%) |
| Total | 2,741 (83.1%) | 557 (16.9%) |
Educational Attainment by Field of Study in Arkansas City
Education (401 | 23.8%), bio, nature & agricultural (296 | 17.6%), business (294 | 17.4%), arts & humanities (184 | 10.9%), and science & technology (161 | 9.6%) are the most common fields of study among 1,685 individuals in Arkansas City who have obtained a bachelor's degree or higher.
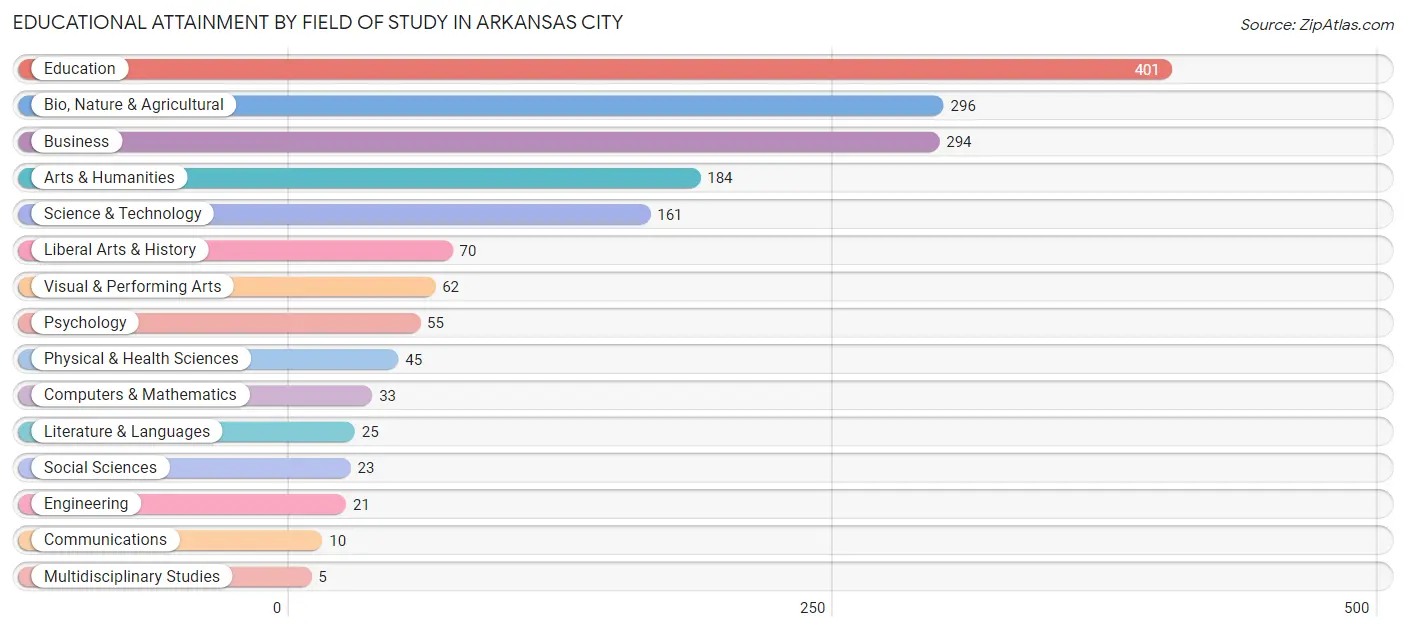
| Field of Study | # Graduates | % Graduates |
| Computers & Mathematics | 33 | 2.0% |
| Bio, Nature & Agricultural | 296 | 17.6% |
| Physical & Health Sciences | 45 | 2.7% |
| Psychology | 55 | 3.3% |
| Social Sciences | 23 | 1.4% |
| Engineering | 21 | 1.3% |
| Multidisciplinary Studies | 5 | 0.3% |
| Science & Technology | 161 | 9.6% |
| Business | 294 | 17.4% |
| Education | 401 | 23.8% |
| Literature & Languages | 25 | 1.5% |
| Liberal Arts & History | 70 | 4.2% |
| Visual & Performing Arts | 62 | 3.7% |
| Communications | 10 | 0.6% |
| Arts & Humanities | 184 | 10.9% |
| Total | 1,685 | 100.0% |
Transportation & Commute in Arkansas City
Vehicle Availability by Sex in Arkansas City
The most prevalent vehicle ownership categories in Arkansas City are males with 2 vehicles (975, accounting for 36.8%) and females with 2 vehicles (825, making up 46.6%).
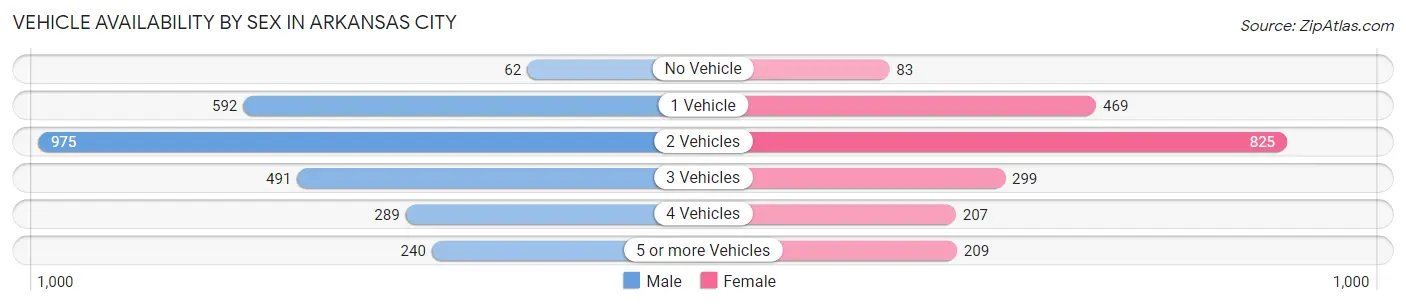
| Vehicles Available | Male | Female |
| No Vehicle | 62 (2.3%) | 83 (4.0%) |
| 1 Vehicle | 592 (22.4%) | 469 (22.4%) |
| 2 Vehicles | 975 (36.8%) | 825 (39.4%) |
| 3 Vehicles | 491 (18.5%) | 299 (14.3%) |
| 4 Vehicles | 289 (10.9%) | 207 (9.9%) |
| 5 or more Vehicles | 240 (9.1%) | 209 (10.0%) |
| Total | 2,649 (100.0%) | 2,092 (100.0%) |
Commute Time in Arkansas City
The most frequently occuring commute durations in Arkansas City are 5 to 9 minutes (1,268 commuters, 26.4%), 15 to 19 minutes (1,098 commuters, 22.9%), and 10 to 14 minutes (886 commuters, 18.4%).
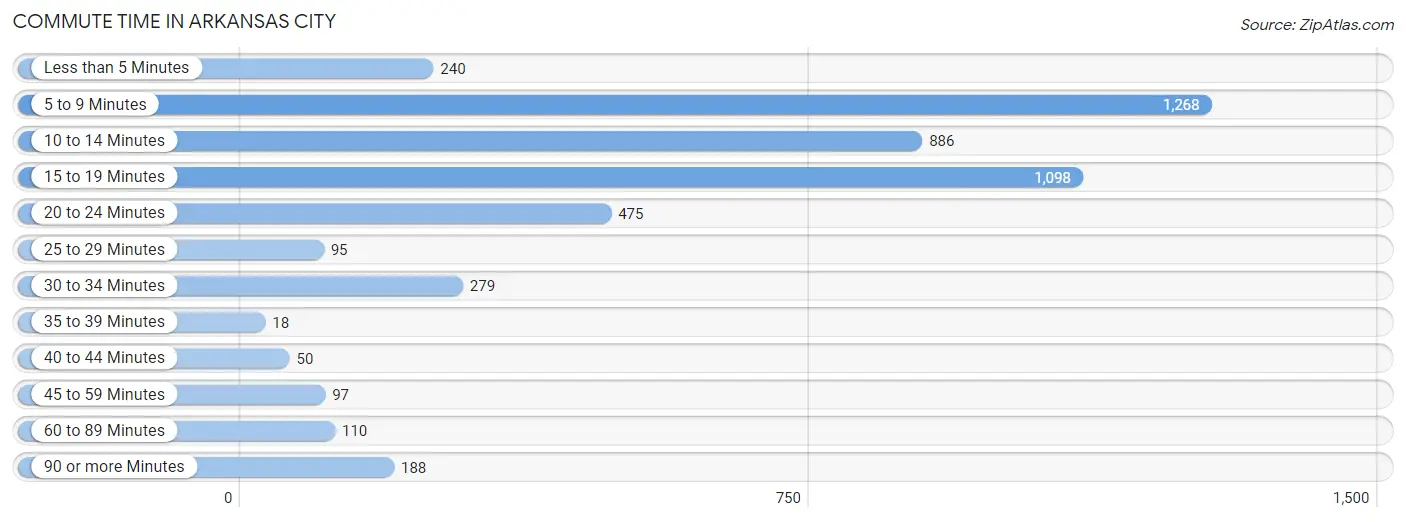
| Commute Time | # Commuters | % Commuters |
| Less than 5 Minutes | 240 | 5.0% |
| 5 to 9 Minutes | 1,268 | 26.4% |
| 10 to 14 Minutes | 886 | 18.4% |
| 15 to 19 Minutes | 1,098 | 22.9% |
| 20 to 24 Minutes | 475 | 9.9% |
| 25 to 29 Minutes | 95 | 2.0% |
| 30 to 34 Minutes | 279 | 5.8% |
| 35 to 39 Minutes | 18 | 0.4% |
| 40 to 44 Minutes | 50 | 1.0% |
| 45 to 59 Minutes | 97 | 2.0% |
| 60 to 89 Minutes | 110 | 2.3% |
| 90 or more Minutes | 188 | 3.9% |
Commute Time by Sex in Arkansas City
The most common commute times in Arkansas City are 5 to 9 minutes (679 commuters, 25.7%) for males and 5 to 9 minutes (589 commuters, 27.3%) for females.
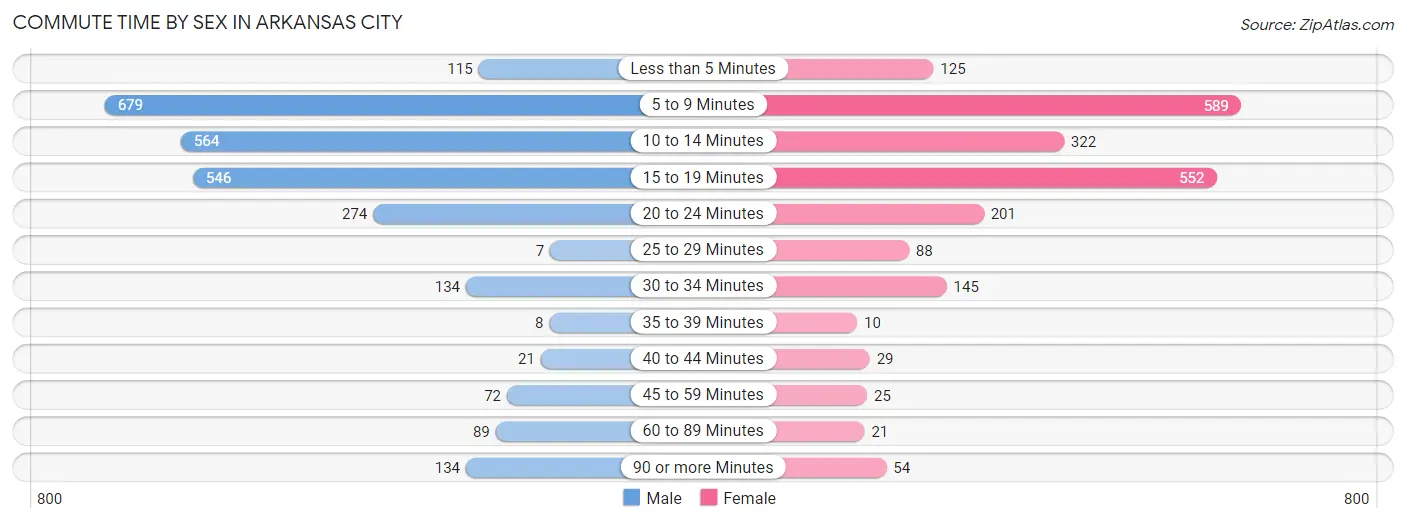
| Commute Time | Male | Female |
| Less than 5 Minutes | 115 (4.3%) | 125 (5.8%) |
| 5 to 9 Minutes | 679 (25.7%) | 589 (27.3%) |
| 10 to 14 Minutes | 564 (21.3%) | 322 (14.9%) |
| 15 to 19 Minutes | 546 (20.7%) | 552 (25.5%) |
| 20 to 24 Minutes | 274 (10.4%) | 201 (9.3%) |
| 25 to 29 Minutes | 7 (0.3%) | 88 (4.1%) |
| 30 to 34 Minutes | 134 (5.1%) | 145 (6.7%) |
| 35 to 39 Minutes | 8 (0.3%) | 10 (0.5%) |
| 40 to 44 Minutes | 21 (0.8%) | 29 (1.3%) |
| 45 to 59 Minutes | 72 (2.7%) | 25 (1.2%) |
| 60 to 89 Minutes | 89 (3.4%) | 21 (1.0%) |
| 90 or more Minutes | 134 (5.1%) | 54 (2.5%) |
Time of Departure to Work by Sex in Arkansas City
The most frequent times of departure to work in Arkansas City are 7:30 AM to 7:59 AM (357, 13.5%) for males and 7:00 AM to 7:29 AM (390, 18.0%) for females.
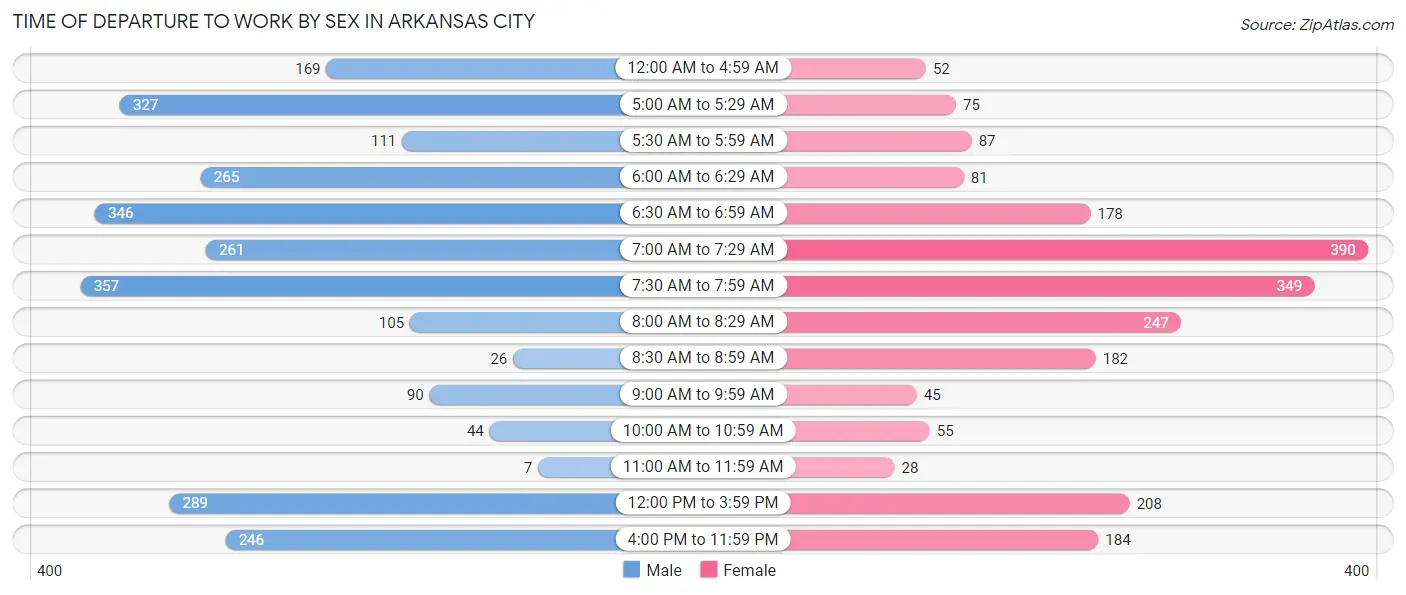
| Time of Departure | Male | Female |
| 12:00 AM to 4:59 AM | 169 (6.4%) | 52 (2.4%) |
| 5:00 AM to 5:29 AM | 327 (12.4%) | 75 (3.5%) |
| 5:30 AM to 5:59 AM | 111 (4.2%) | 87 (4.0%) |
| 6:00 AM to 6:29 AM | 265 (10.0%) | 81 (3.7%) |
| 6:30 AM to 6:59 AM | 346 (13.1%) | 178 (8.2%) |
| 7:00 AM to 7:29 AM | 261 (9.9%) | 390 (18.0%) |
| 7:30 AM to 7:59 AM | 357 (13.5%) | 349 (16.2%) |
| 8:00 AM to 8:29 AM | 105 (4.0%) | 247 (11.4%) |
| 8:30 AM to 8:59 AM | 26 (1.0%) | 182 (8.4%) |
| 9:00 AM to 9:59 AM | 90 (3.4%) | 45 (2.1%) |
| 10:00 AM to 10:59 AM | 44 (1.7%) | 55 (2.5%) |
| 11:00 AM to 11:59 AM | 7 (0.3%) | 28 (1.3%) |
| 12:00 PM to 3:59 PM | 289 (10.9%) | 208 (9.6%) |
| 4:00 PM to 11:59 PM | 246 (9.3%) | 184 (8.5%) |
| Total | 2,643 (100.0%) | 2,161 (100.0%) |
Housing Occupancy in Arkansas City
Occupancy by Ownership in Arkansas City
Of the total 4,685 dwellings in Arkansas City, owner-occupied units account for 2,941 (62.8%), while renter-occupied units make up 1,744 (37.2%).
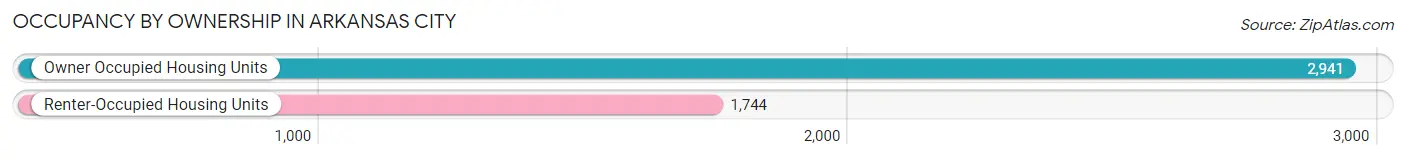
| Occupancy | # Housing Units | % Housing Units |
| Owner Occupied Housing Units | 2,941 | 62.8% |
| Renter-Occupied Housing Units | 1,744 | 37.2% |
| Total Occupied Housing Units | 4,685 | 100.0% |
Occupancy by Household Size in Arkansas City
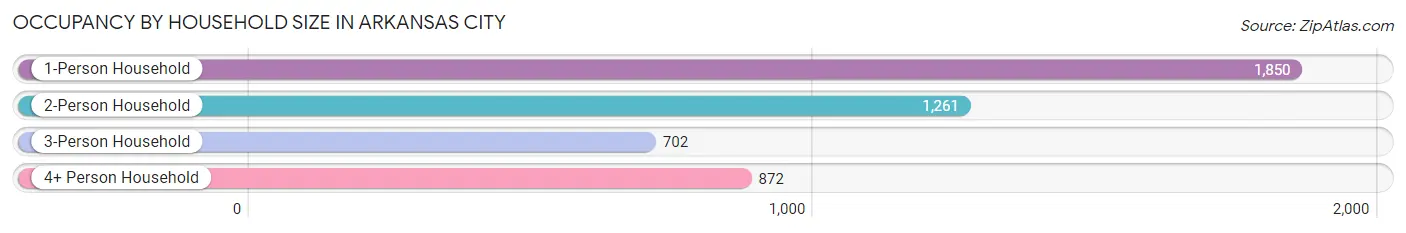
| Household Size | # Housing Units | % Housing Units |
| 1-Person Household | 1,850 | 39.5% |
| 2-Person Household | 1,261 | 26.9% |
| 3-Person Household | 702 | 15.0% |
| 4+ Person Household | 872 | 18.6% |
| Total Housing Units | 4,685 | 100.0% |
Occupancy by Ownership by Household Size in Arkansas City
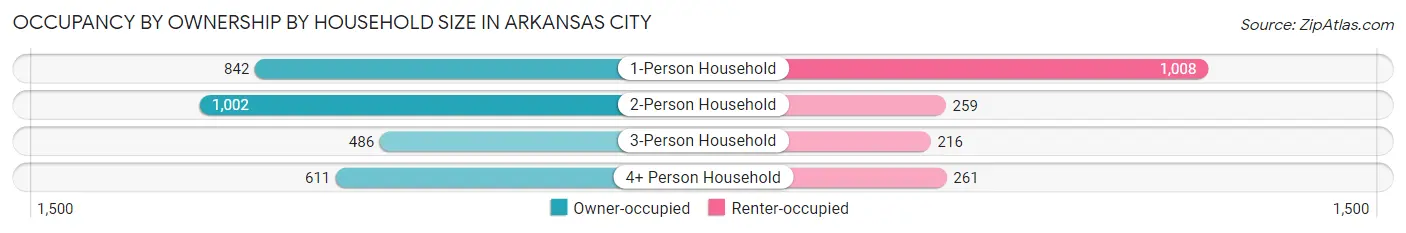
| Household Size | Owner-occupied | Renter-occupied |
| 1-Person Household | 842 (45.5%) | 1,008 (54.5%) |
| 2-Person Household | 1,002 (79.5%) | 259 (20.5%) |
| 3-Person Household | 486 (69.2%) | 216 (30.8%) |
| 4+ Person Household | 611 (70.1%) | 261 (29.9%) |
| Total Housing Units | 2,941 (62.8%) | 1,744 (37.2%) |
Occupancy by Educational Attainment in Arkansas City
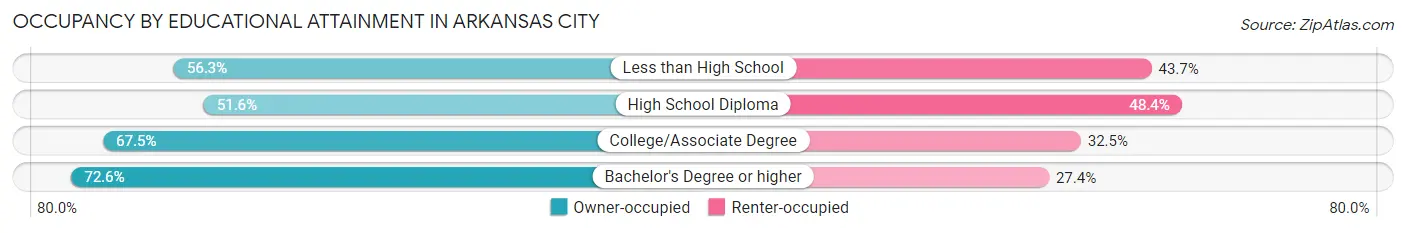
| Household Size | Owner-occupied | Renter-occupied |
| Less than High School | 254 (56.3%) | 197 (43.7%) |
| High School Diploma | 726 (51.6%) | 682 (48.4%) |
| College/Associate Degree | 1,209 (67.5%) | 581 (32.5%) |
| Bachelor's Degree or higher | 752 (72.6%) | 284 (27.4%) |
Occupancy by Age of Householder in Arkansas City
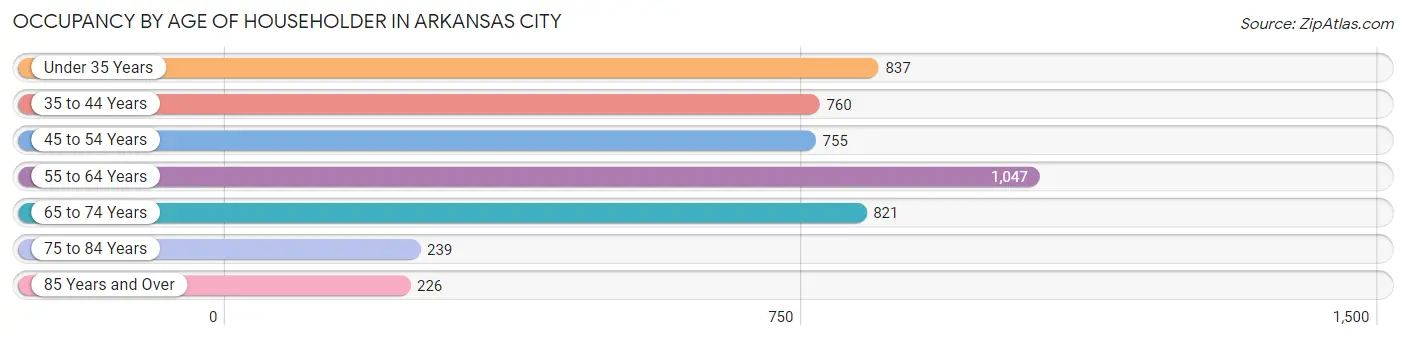
| Age Bracket | # Households | % Households |
| Under 35 Years | 837 | 17.9% |
| 35 to 44 Years | 760 | 16.2% |
| 45 to 54 Years | 755 | 16.1% |
| 55 to 64 Years | 1,047 | 22.4% |
| 65 to 74 Years | 821 | 17.5% |
| 75 to 84 Years | 239 | 5.1% |
| 85 Years and Over | 226 | 4.8% |
| Total | 4,685 | 100.0% |
Housing Finances in Arkansas City
Median Income by Occupancy in Arkansas City
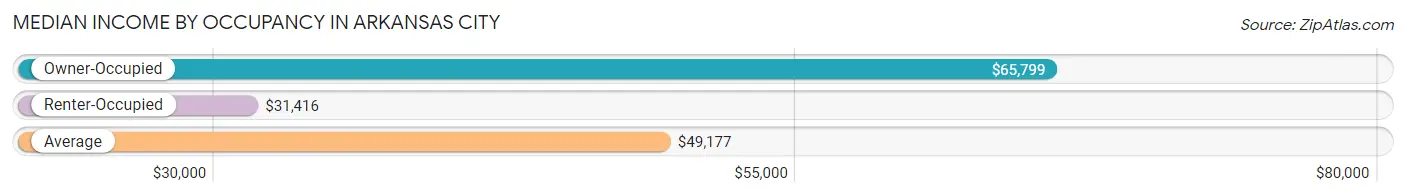
| Occupancy Type | # Households | Median Income |
| Owner-Occupied | 2,941 (62.8%) | $65,799 |
| Renter-Occupied | 1,744 (37.2%) | $31,416 |
| Average | 4,685 (100.0%) | $49,177 |
Occupancy by Householder Income Bracket in Arkansas City
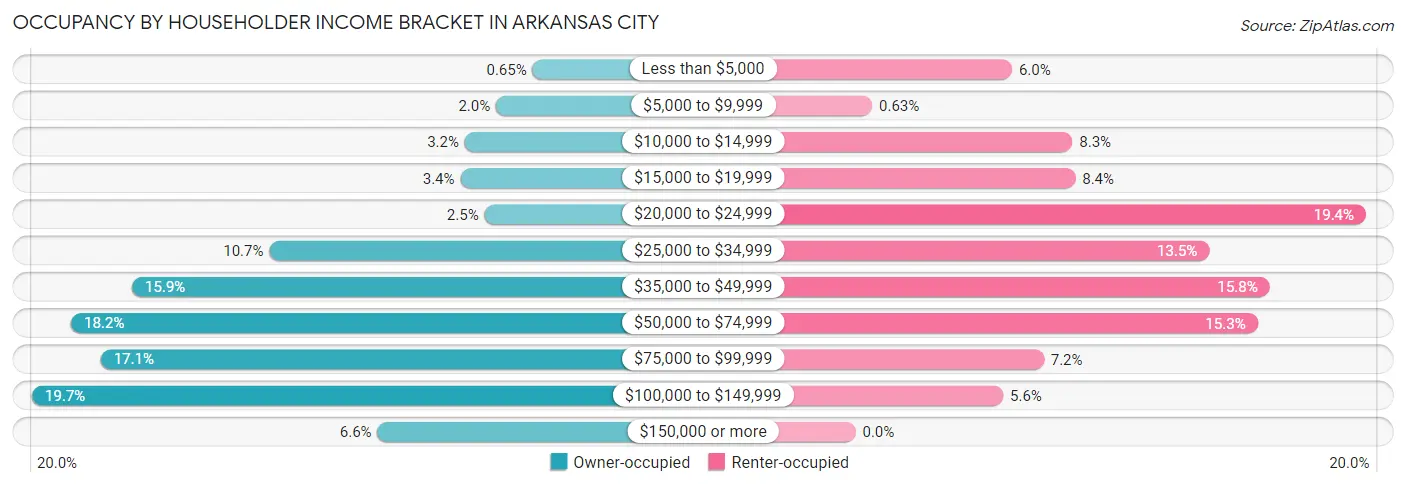
| Income Bracket | Owner-occupied | Renter-occupied |
| Less than $5,000 | 19 (0.6%) | 104 (6.0%) |
| $5,000 to $9,999 | 60 (2.0%) | 11 (0.6%) |
| $10,000 to $14,999 | 95 (3.2%) | 144 (8.3%) |
| $15,000 to $19,999 | 100 (3.4%) | 146 (8.4%) |
| $20,000 to $24,999 | 73 (2.5%) | 339 (19.4%) |
| $25,000 to $34,999 | 314 (10.7%) | 235 (13.5%) |
| $35,000 to $49,999 | 468 (15.9%) | 275 (15.8%) |
| $50,000 to $74,999 | 536 (18.2%) | 267 (15.3%) |
| $75,000 to $99,999 | 503 (17.1%) | 125 (7.2%) |
| $100,000 to $149,999 | 580 (19.7%) | 98 (5.6%) |
| $150,000 or more | 193 (6.6%) | 0 (0.0%) |
| Total | 2,941 (100.0%) | 1,744 (100.0%) |
Monthly Housing Cost Tiers in Arkansas City
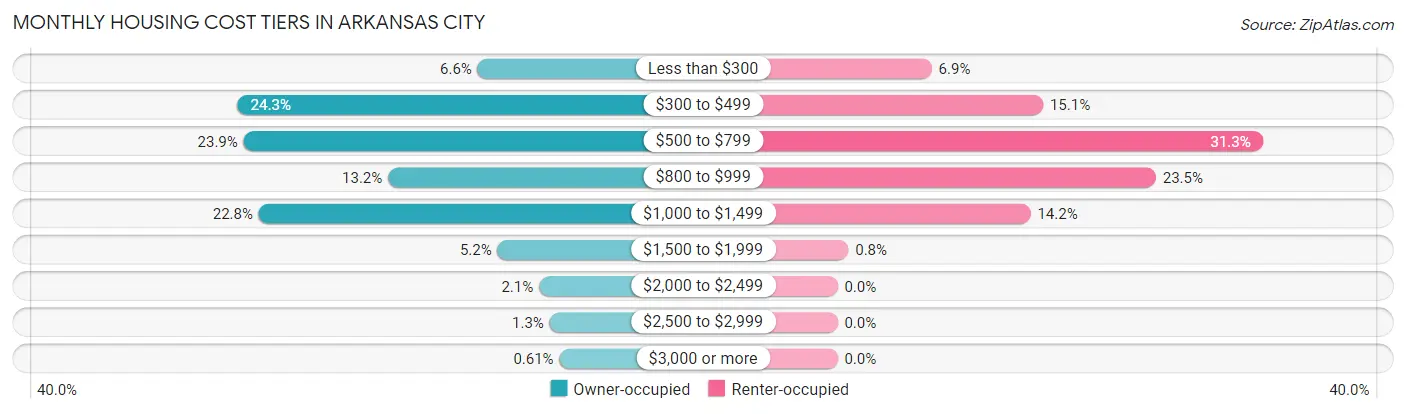
| Monthly Cost | Owner-occupied | Renter-occupied |
| Less than $300 | 195 (6.6%) | 121 (6.9%) |
| $300 to $499 | 715 (24.3%) | 264 (15.1%) |
| $500 to $799 | 702 (23.9%) | 546 (31.3%) |
| $800 to $999 | 389 (13.2%) | 409 (23.4%) |
| $1,000 to $1,499 | 669 (22.8%) | 248 (14.2%) |
| $1,500 to $1,999 | 152 (5.2%) | 14 (0.8%) |
| $2,000 to $2,499 | 62 (2.1%) | 0 (0.0%) |
| $2,500 to $2,999 | 39 (1.3%) | 0 (0.0%) |
| $3,000 or more | 18 (0.6%) | 0 (0.0%) |
| Total | 2,941 (100.0%) | 1,744 (100.0%) |
Physical Housing Characteristics in Arkansas City
Housing Structures in Arkansas City
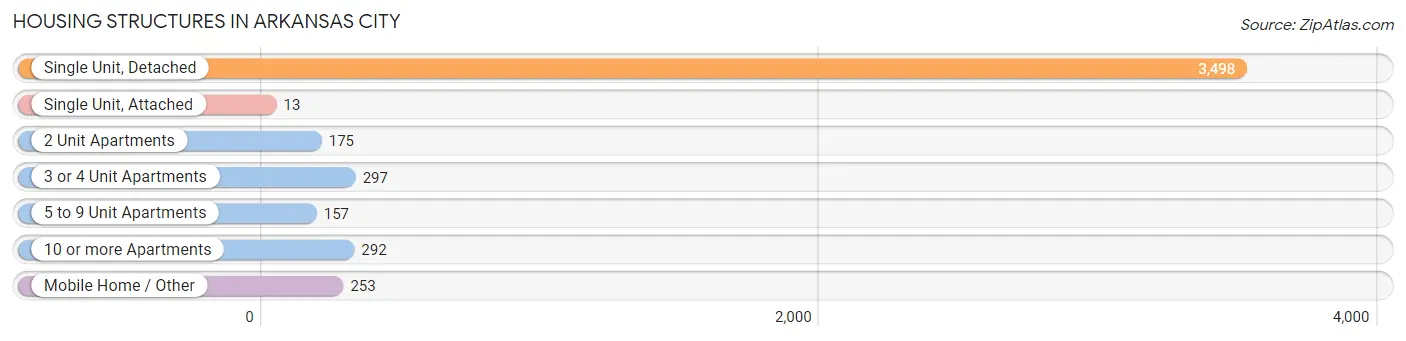
| Structure Type | # Housing Units | % Housing Units |
| Single Unit, Detached | 3,498 | 74.7% |
| Single Unit, Attached | 13 | 0.3% |
| 2 Unit Apartments | 175 | 3.7% |
| 3 or 4 Unit Apartments | 297 | 6.3% |
| 5 to 9 Unit Apartments | 157 | 3.4% |
| 10 or more Apartments | 292 | 6.2% |
| Mobile Home / Other | 253 | 5.4% |
| Total | 4,685 | 100.0% |
Housing Structures by Occupancy in Arkansas City
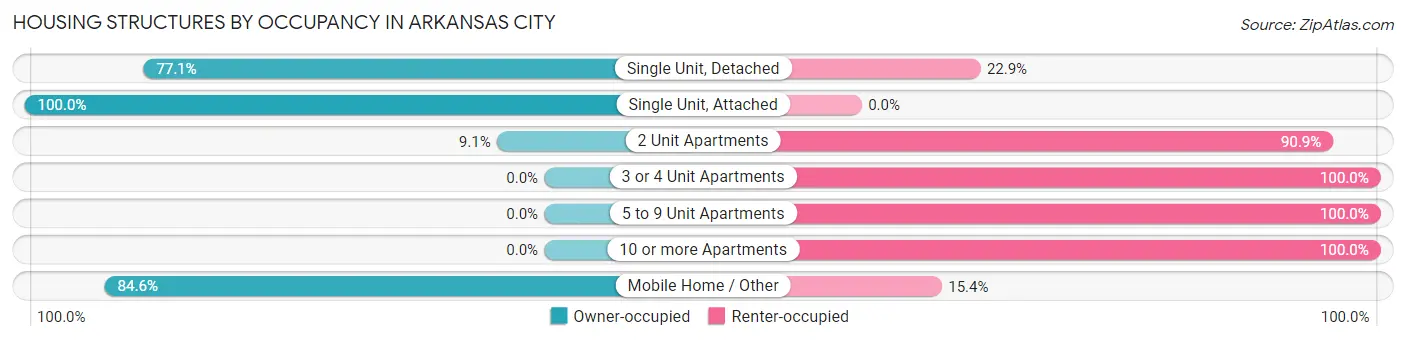
| Structure Type | Owner-occupied | Renter-occupied |
| Single Unit, Detached | 2,698 (77.1%) | 800 (22.9%) |
| Single Unit, Attached | 13 (100.0%) | 0 (0.0%) |
| 2 Unit Apartments | 16 (9.1%) | 159 (90.9%) |
| 3 or 4 Unit Apartments | 0 (0.0%) | 297 (100.0%) |
| 5 to 9 Unit Apartments | 0 (0.0%) | 157 (100.0%) |
| 10 or more Apartments | 0 (0.0%) | 292 (100.0%) |
| Mobile Home / Other | 214 (84.6%) | 39 (15.4%) |
| Total | 2,941 (62.8%) | 1,744 (37.2%) |
Housing Structures by Number of Rooms in Arkansas City
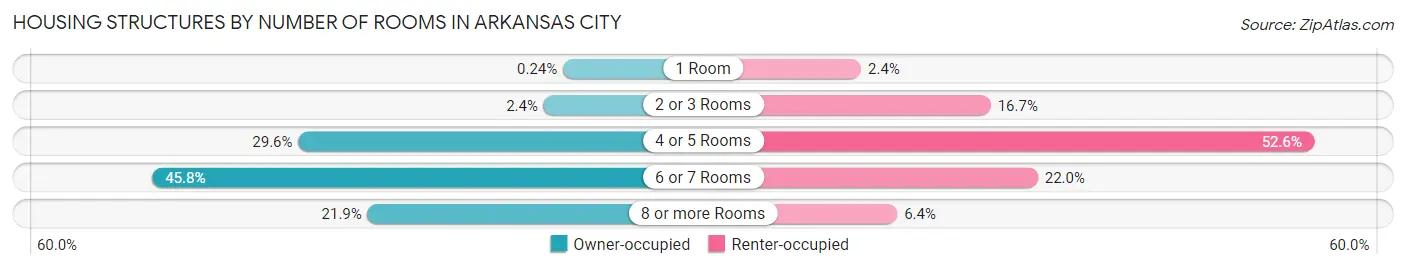
| Number of Rooms | Owner-occupied | Renter-occupied |
| 1 Room | 7 (0.2%) | 41 (2.4%) |
| 2 or 3 Rooms | 70 (2.4%) | 292 (16.7%) |
| 4 or 5 Rooms | 871 (29.6%) | 917 (52.6%) |
| 6 or 7 Rooms | 1,348 (45.8%) | 383 (22.0%) |
| 8 or more Rooms | 645 (21.9%) | 111 (6.4%) |
| Total | 2,941 (100.0%) | 1,744 (100.0%) |
Housing Structure by Heating Type in Arkansas City
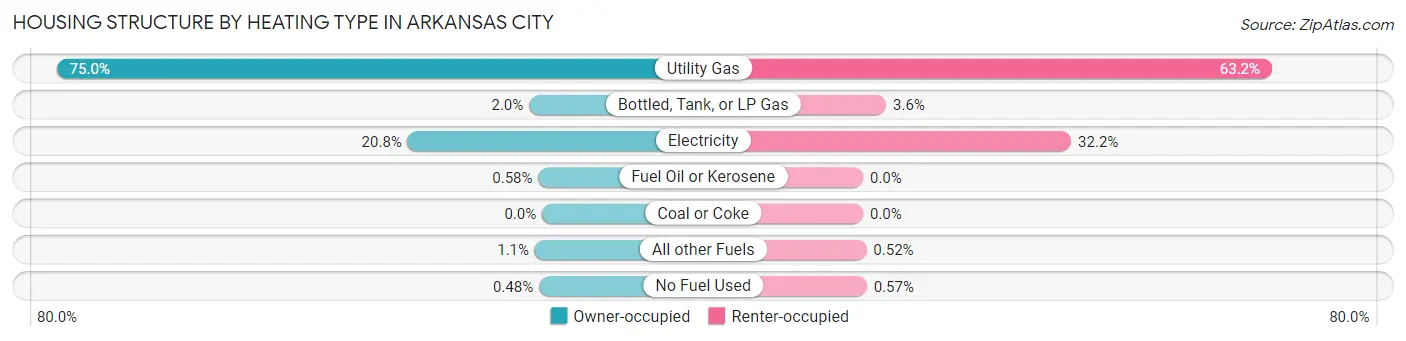
| Heating Type | Owner-occupied | Renter-occupied |
| Utility Gas | 2,207 (75.0%) | 1,102 (63.2%) |
| Bottled, Tank, or LP Gas | 59 (2.0%) | 62 (3.6%) |
| Electricity | 611 (20.8%) | 561 (32.2%) |
| Fuel Oil or Kerosene | 17 (0.6%) | 0 (0.0%) |
| Coal or Coke | 0 (0.0%) | 0 (0.0%) |
| All other Fuels | 33 (1.1%) | 9 (0.5%) |
| No Fuel Used | 14 (0.5%) | 10 (0.6%) |
| Total | 2,941 (100.0%) | 1,744 (100.0%) |
Household Vehicle Usage in Arkansas City
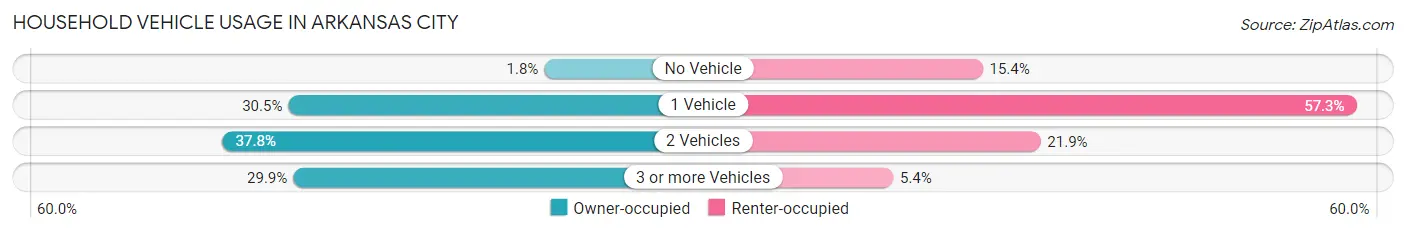
| Vehicles per Household | Owner-occupied | Renter-occupied |
| No Vehicle | 53 (1.8%) | 269 (15.4%) |
| 1 Vehicle | 896 (30.5%) | 999 (57.3%) |
| 2 Vehicles | 1,112 (37.8%) | 382 (21.9%) |
| 3 or more Vehicles | 880 (29.9%) | 94 (5.4%) |
| Total | 2,941 (100.0%) | 1,744 (100.0%) |
Real Estate & Mortgages in Arkansas City
Real Estate and Mortgage Overview in Arkansas City
| Characteristic | Without Mortgage | With Mortgage |
| Housing Units | 1,443 | 1,498 |
| Median Property Value | $70,600 | $90,500 |
| Median Household Income | $51,721 | $153 |
| Monthly Housing Costs | $425 | $18 |
| Real Estate Taxes | $1,200 | $19 |
Property Value by Mortgage Status in Arkansas City
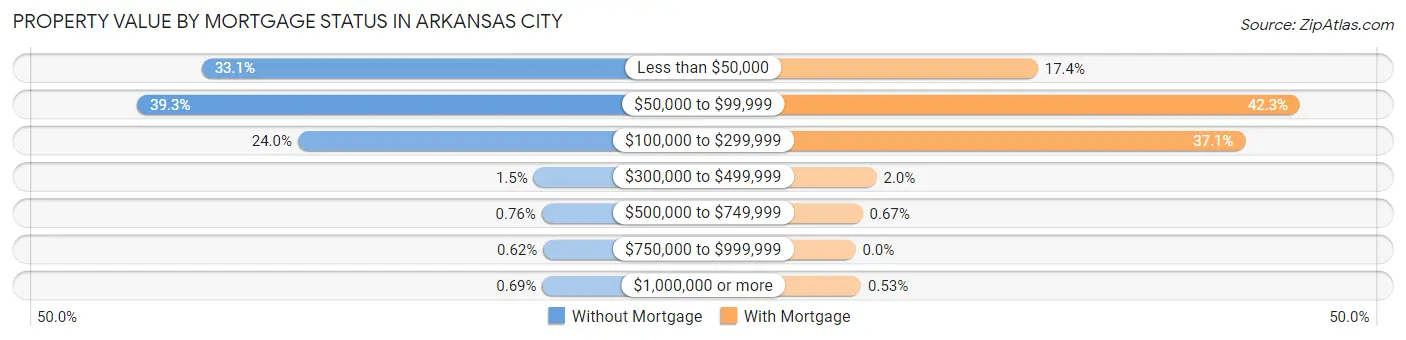
| Property Value | Without Mortgage | With Mortgage |
| Less than $50,000 | 478 (33.1%) | 260 (17.4%) |
| $50,000 to $99,999 | 567 (39.3%) | 634 (42.3%) |
| $100,000 to $299,999 | 346 (24.0%) | 556 (37.1%) |
| $300,000 to $499,999 | 22 (1.5%) | 30 (2.0%) |
| $500,000 to $749,999 | 11 (0.8%) | 10 (0.7%) |
| $750,000 to $999,999 | 9 (0.6%) | 0 (0.0%) |
| $1,000,000 or more | 10 (0.7%) | 8 (0.5%) |
| Total | 1,443 (100.0%) | 1,498 (100.0%) |
Household Income by Mortgage Status in Arkansas City
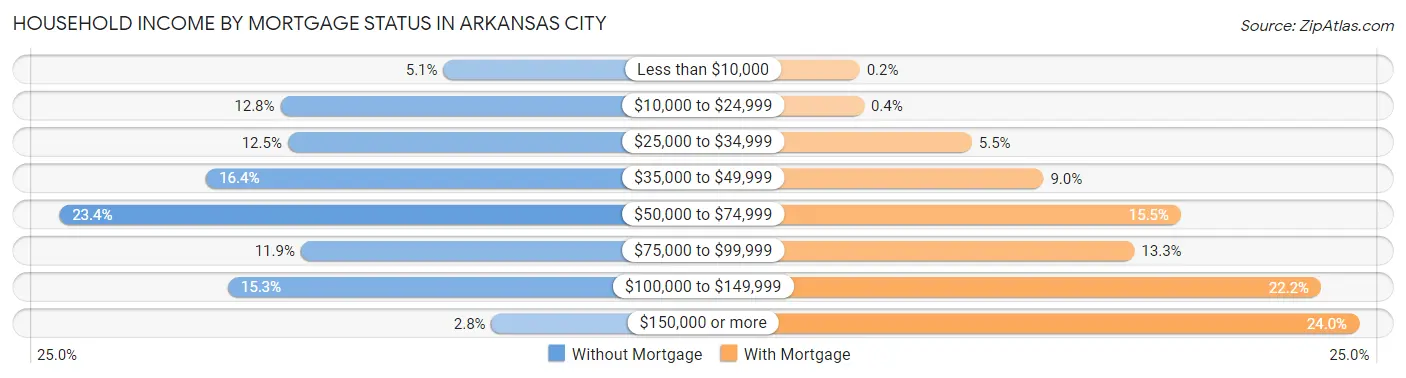
| Household Income | Without Mortgage | With Mortgage |
| Less than $10,000 | 73 (5.1%) | 3 (0.2%) |
| $10,000 to $24,999 | 185 (12.8%) | 6 (0.4%) |
| $25,000 to $34,999 | 180 (12.5%) | 83 (5.5%) |
| $35,000 to $49,999 | 236 (16.4%) | 134 (8.9%) |
| $50,000 to $74,999 | 337 (23.4%) | 232 (15.5%) |
| $75,000 to $99,999 | 171 (11.8%) | 199 (13.3%) |
| $100,000 to $149,999 | 221 (15.3%) | 332 (22.2%) |
| $150,000 or more | 40 (2.8%) | 359 (24.0%) |
| Total | 1,443 (100.0%) | 1,498 (100.0%) |
Property Value to Household Income Ratio in Arkansas City
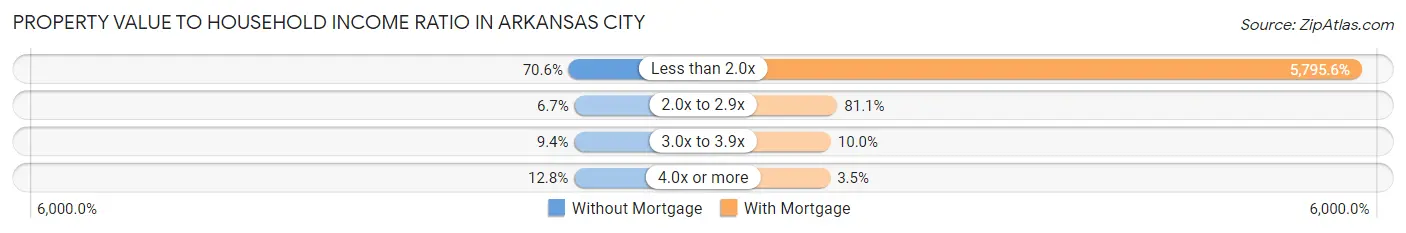
| Value-to-Income Ratio | Without Mortgage | With Mortgage |
| Less than 2.0x | 1,019 (70.6%) | 86,818 (5,795.6%) |
| 2.0x to 2.9x | 96 (6.7%) | 1,215 (81.1%) |
| 3.0x to 3.9x | 135 (9.4%) | 150 (10.0%) |
| 4.0x or more | 185 (12.8%) | 52 (3.5%) |
| Total | 1,443 (100.0%) | 1,498 (100.0%) |
Real Estate Taxes by Mortgage Status in Arkansas City
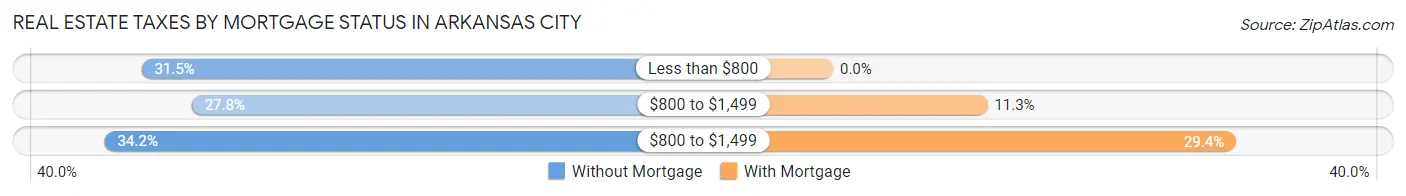
| Property Taxes | Without Mortgage | With Mortgage |
| Less than $800 | 454 (31.5%) | 0 (0.0%) |
| $800 to $1,499 | 401 (27.8%) | 169 (11.3%) |
| $800 to $1,499 | 493 (34.2%) | 441 (29.4%) |
| Total | 1,443 (100.0%) | 1,498 (100.0%) |
Health & Disability in Arkansas City
Health Insurance Coverage by Age in Arkansas City
| Age Bracket | With Coverage | Without Coverage |
| Under 6 Years | 868 (99.3%) | 6 (0.7%) |
| 6 to 18 Years | 2,002 (90.6%) | 207 (9.4%) |
| 19 to 25 Years | 1,080 (83.1%) | 219 (16.9%) |
| 26 to 34 Years | 1,110 (73.8%) | 394 (26.2%) |
| 35 to 44 Years | 1,197 (86.6%) | 185 (13.4%) |
| 45 to 54 Years | 1,016 (89.9%) | 114 (10.1%) |
| 55 to 64 Years | 1,495 (89.2%) | 180 (10.7%) |
| 65 to 74 Years | 1,143 (98.9%) | 13 (1.1%) |
| 75 Years and older | 575 (100.0%) | 0 (0.0%) |
| Total | 10,486 (88.8%) | 1,318 (11.2%) |
Health Insurance Coverage by Citizenship Status in Arkansas City
| Citizenship Status | With Coverage | Without Coverage |
| Native Born | 868 (99.3%) | 6 (0.7%) |
| Foreign Born, Citizen | 2,002 (90.6%) | 207 (9.4%) |
| Foreign Born, not a Citizen | 1,080 (83.1%) | 219 (16.9%) |
Health Insurance Coverage by Household Income in Arkansas City
| Household Income | With Coverage | Without Coverage |
| Under $25,000 | 1,611 (88.5%) | 209 (11.5%) |
| $25,000 to $49,999 | 2,080 (81.1%) | 486 (18.9%) |
| $50,000 to $74,999 | 2,527 (92.8%) | 197 (7.2%) |
| $75,000 to $99,999 | 1,648 (92.0%) | 144 (8.0%) |
| $100,000 and over | 2,137 (89.7%) | 244 (10.2%) |
Public vs Private Health Insurance Coverage by Age in Arkansas City
| Age Bracket | Public Insurance | Private Insurance |
| Under 6 | 442 (50.6%) | 512 (58.6%) |
| 6 to 18 Years | 1,008 (45.6%) | 1,271 (57.5%) |
| 19 to 25 Years | 169 (13.0%) | 947 (72.9%) |
| 25 to 34 Years | 273 (18.1%) | 851 (56.6%) |
| 35 to 44 Years | 271 (19.6%) | 1,038 (75.1%) |
| 45 to 54 Years | 246 (21.8%) | 914 (80.9%) |
| 55 to 64 Years | 444 (26.5%) | 1,164 (69.5%) |
| 65 to 74 Years | 1,111 (96.1%) | 649 (56.1%) |
| 75 Years and over | 575 (100.0%) | 293 (51.0%) |
| Total | 4,539 (38.5%) | 7,639 (64.7%) |
Disability Status by Sex by Age in Arkansas City
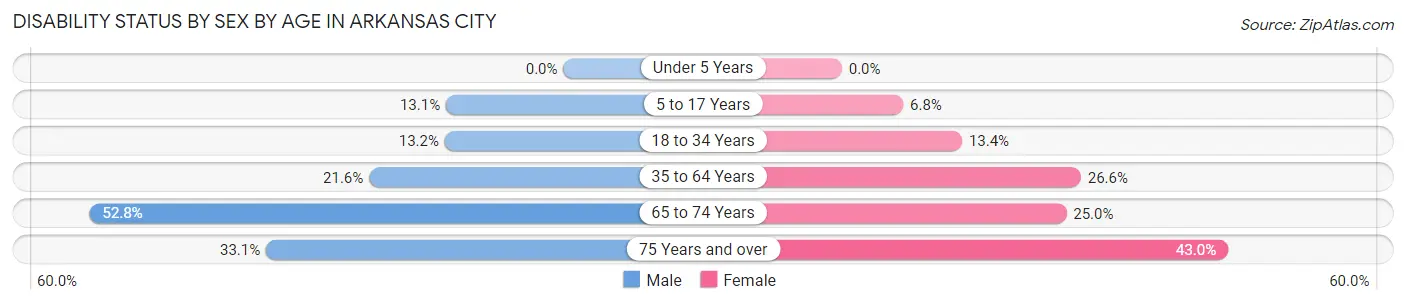
| Age Bracket | Male | Female |
| Under 5 Years | 0 (0.0%) | 0 (0.0%) |
| 5 to 17 Years | 118 (13.1%) | 82 (6.8%) |
| 18 to 34 Years | 204 (13.2%) | 200 (13.4%) |
| 35 to 64 Years | 445 (21.6%) | 567 (26.6%) |
| 65 to 74 Years | 304 (52.8%) | 145 (25.0%) |
| 75 Years and over | 98 (33.1%) | 120 (43.0%) |
Disability Class by Sex by Age in Arkansas City
Disability Class: Hearing Difficulty
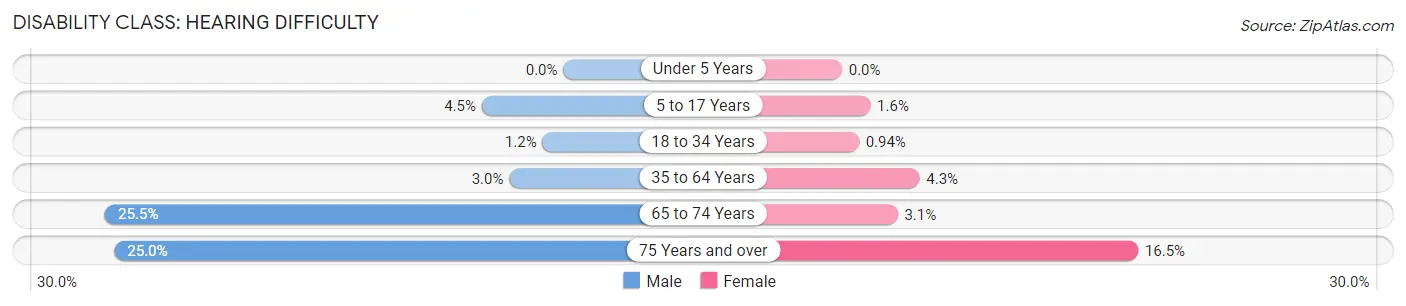
| Age Bracket | Male | Female |
| Under 5 Years | 0 (0.0%) | 0 (0.0%) |
| 5 to 17 Years | 41 (4.5%) | 19 (1.6%) |
| 18 to 34 Years | 18 (1.2%) | 14 (0.9%) |
| 35 to 64 Years | 62 (3.0%) | 92 (4.3%) |
| 65 to 74 Years | 147 (25.5%) | 18 (3.1%) |
| 75 Years and over | 74 (25.0%) | 46 (16.5%) |
Disability Class: Vision Difficulty
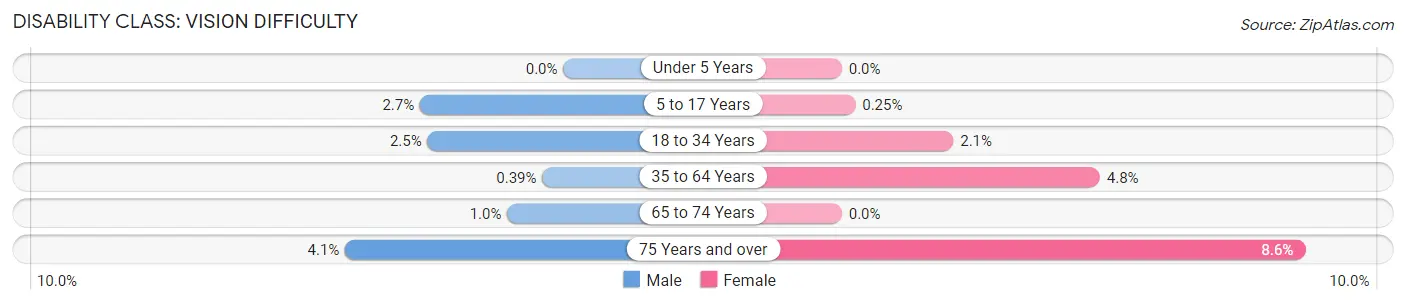
| Age Bracket | Male | Female |
| Under 5 Years | 0 (0.0%) | 0 (0.0%) |
| 5 to 17 Years | 24 (2.7%) | 3 (0.3%) |
| 18 to 34 Years | 39 (2.5%) | 31 (2.1%) |
| 35 to 64 Years | 8 (0.4%) | 102 (4.8%) |
| 65 to 74 Years | 6 (1.0%) | 0 (0.0%) |
| 75 Years and over | 12 (4.1%) | 24 (8.6%) |
Disability Class: Cognitive Difficulty
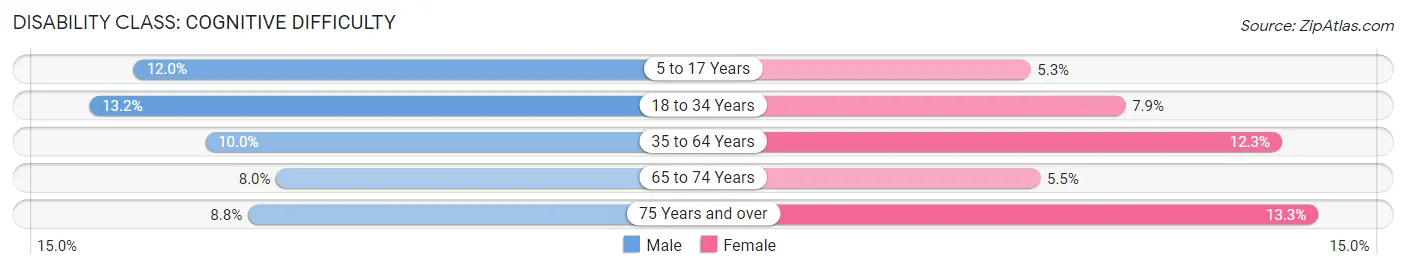
| Age Bracket | Male | Female |
| 5 to 17 Years | 108 (12.0%) | 63 (5.2%) |
| 18 to 34 Years | 204 (13.2%) | 118 (7.9%) |
| 35 to 64 Years | 205 (10.0%) | 261 (12.2%) |
| 65 to 74 Years | 46 (8.0%) | 32 (5.5%) |
| 75 Years and over | 26 (8.8%) | 37 (13.3%) |
Disability Class: Ambulatory Difficulty
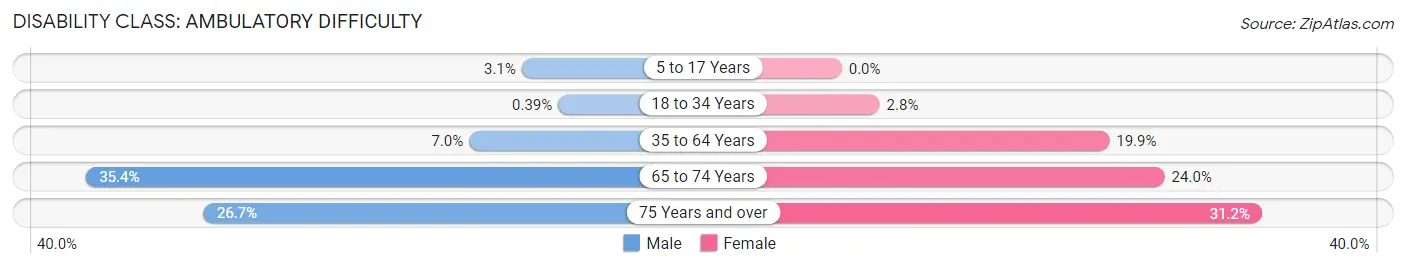
| Age Bracket | Male | Female |
| 5 to 17 Years | 28 (3.1%) | 0 (0.0%) |
| 18 to 34 Years | 6 (0.4%) | 42 (2.8%) |
| 35 to 64 Years | 144 (7.0%) | 423 (19.9%) |
| 65 to 74 Years | 204 (35.4%) | 139 (24.0%) |
| 75 Years and over | 79 (26.7%) | 87 (31.2%) |
Disability Class: Self-Care Difficulty
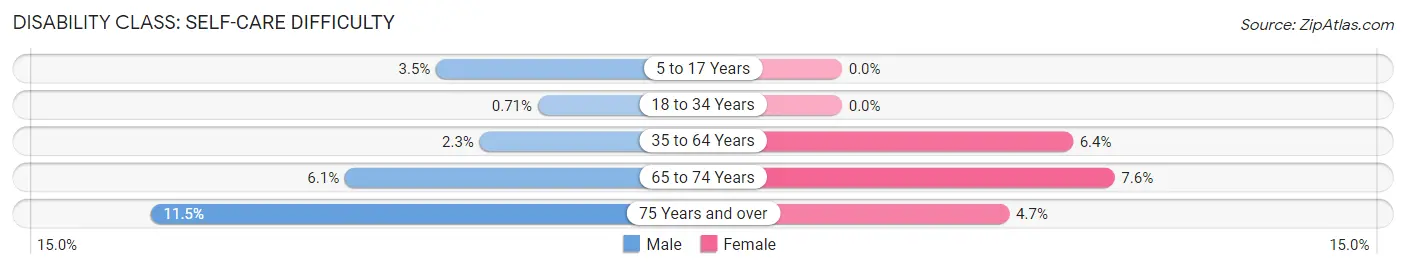
| Age Bracket | Male | Female |
| 5 to 17 Years | 32 (3.5%) | 0 (0.0%) |
| 18 to 34 Years | 11 (0.7%) | 0 (0.0%) |
| 35 to 64 Years | 48 (2.3%) | 137 (6.4%) |
| 65 to 74 Years | 35 (6.1%) | 44 (7.6%) |
| 75 Years and over | 34 (11.5%) | 13 (4.7%) |
Technology Access in Arkansas City
Computing Device Access in Arkansas City
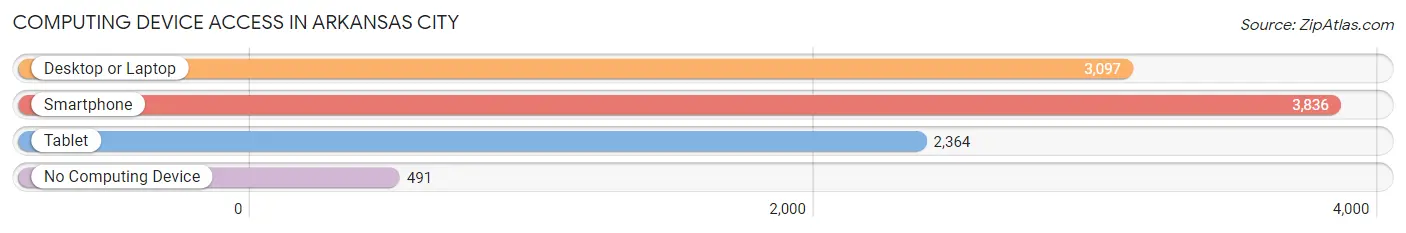
| Device Type | # Households | % Households |
| Desktop or Laptop | 3,097 | 66.1% |
| Smartphone | 3,836 | 81.9% |
| Tablet | 2,364 | 50.5% |
| No Computing Device | 491 | 10.5% |
| Total | 4,685 | 100.0% |
Internet Access in Arkansas City
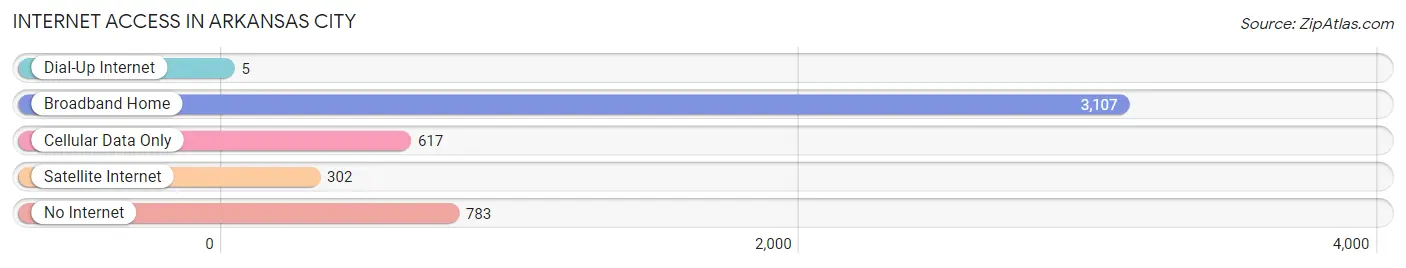
| Internet Type | # Households | % Households |
| Dial-Up Internet | 5 | 0.1% |
| Broadband Home | 3,107 | 66.3% |
| Cellular Data Only | 617 | 13.2% |
| Satellite Internet | 302 | 6.5% |
| No Internet | 783 | 16.7% |
| Total | 4,685 | 100.0% |
Arkansas City Summary
Arkansas City, Kansas is a city located in Cowley County, Kansas, United States. It is situated along the Arkansas River, near the Oklahoma border. The city has a population of 12,415 as of the 2010 census, making it the largest city in Cowley County.
History
The area that is now Arkansas City was first settled in 1868 by a group of settlers from Arkansas. The town was originally named "Creswell" after the first postmaster, but was later changed to Arkansas City in 1872. The city was incorporated in 1872 and was the first city in Cowley County.
In the late 19th century, Arkansas City was a major stop on the Chisholm Trail, a cattle trail that ran from Texas to Kansas. The city was also a major stop on the Santa Fe Trail, a trade route that ran from Missouri to New Mexico.
In the early 20th century, Arkansas City was a major center for oil production. The city was also home to a large number of Native American tribes, including the Kaw, Osage, and Pawnee.
Geography
Arkansas City is located in south-central Kansas, at the confluence of the Arkansas and Walnut Rivers. The city is situated at an elevation of 1,068 feet (326 m) above sea level.
The city has a total area of 8.3 square miles (21.5 km2), of which 8.2 square miles (21.3 km2) is land and 0.1 square miles (0.2 km2) is water.
Economy
Arkansas City is a major center for agriculture and manufacturing. The city is home to several large companies, including Tyson Foods, Cargill, and Koch Industries.
The city is also home to several educational institutions, including Cowley College and Southwestern College.
Demographics
As of the 2010 census, there were 12,415 people, 4,845 households, and 3,092 families residing in the city. The population density was 1,510.3 people per square mile (583.2/km2). There were 5,093 housing units at an average density of 617.7 per square mile (238.3/km2). The racial makeup of the city was 81.2% White, 4.2% African American, 1.2% Native American, 0.7% Asian, 0.1% Pacific Islander, 10.3% from other races, and 2.4% from two or more races. Hispanic or Latino of any race were 20.2% of the population.
There were 4,845 households, out of which 32.2% had children under the age of 18 living with them, 46.2% were married couples living together, 14.2% had a female householder with no husband present, and 34.2% were non-families. 28.7% of all households were made up of individuals, and 11.7% had someone living alone who was 65 years of age or older. The average household size was 2.50 and the average family size was 3.06.
In the city, the population was spread out, with 26.7% under the age of 18, 10.2% from 18 to 24, 27.2% from 25 to 44, 21.2% from 45 to 64, and 14.7% who were 65 years of age or older. The median age was 34 years. For every 100 females, there were 93.2 males. For every 100 females age 18 and over, there were 89.3 males.
The median income for a household in the city was $32,813, and the median income for a family was $39,945. Males had a median income of $30,917 versus $22,917 for females. The per capita income for the city was $16,945. About 11.2% of families and 14.3% of the population were below the poverty line, including 19.2% of those under age 18 and 8.7% of those age 65 or over.
Common Questions
What is Per Capita Income in Arkansas City?
Per Capita income in Arkansas City is $25,442.
What is the Median Family Income in Arkansas City?
Median Family Income in Arkansas City is $68,103.
What is the Median Household income in Arkansas City?
Median Household Income in Arkansas City is $49,177.
What is Income or Wage Gap in Arkansas City?
Income or Wage Gap in Arkansas City is 12.8%.
Women in Arkansas City earn 87.2 cents for every dollar earned by a man.
What is Inequality or Gini Index in Arkansas City?
Inequality or Gini Index in Arkansas City is 0.41.
What is the Total Population of Arkansas City?
Total Population of Arkansas City is 11,997.
What is the Total Male Population of Arkansas City?
Total Male Population of Arkansas City is 5,968.
What is the Total Female Population of Arkansas City?
Total Female Population of Arkansas City is 6,029.
What is the Ratio of Males per 100 Females in Arkansas City?
There are 98.99 Males per 100 Females in Arkansas City.
What is the Ratio of Females per 100 Males in Arkansas City?
There are 101.02 Females per 100 Males in Arkansas City.
What is the Median Population Age in Arkansas City?
Median Population Age in Arkansas City is 35.5 Years.
What is the Average Family Size in Arkansas City
Average Family Size in Arkansas City is 3.3 People.
What is the Average Household Size in Arkansas City
Average Household Size in Arkansas City is 2.4 People.
How Large is the Labor Force in Arkansas City?
There are 5,401 People in the Labor Forcein in Arkansas City.
What is the Percentage of People in the Labor Force in Arkansas City?
57.4% of People are in the Labor Force in Arkansas City.
What is the Unemployment Rate in Arkansas City?
Unemployment Rate in Arkansas City is 6.7%.