Liberal, KS Map & Demographics
Liberal Map
Liberal Overview
$25,078
PER CAPITA INCOME
$68,688
AVG FAMILY INCOME
$55,602
AVG HOUSEHOLD INCOME
30.5%
WAGE / INCOME GAP [ % ]
69.5¢/ $1
WAGE / INCOME GAP [ $ ]
$10,252
FAMILY INCOME DEFICIT
0.40
INEQUALITY / GINI INDEX
19,099
TOTAL POPULATION
9,936
MALE POPULATION
9,163
FEMALE POPULATION
108.44
MALES / 100 FEMALES
92.22
FEMALES / 100 MALES
30.4
MEDIAN AGE
3.8
AVG FAMILY SIZE
3.0
AVG HOUSEHOLD SIZE
9,583
LABOR FORCE [ PEOPLE ]
70.5%
PERCENT IN LABOR FORCE
2.7%
UNEMPLOYMENT RATE
Liberal Zip Codes
Liberal Area Codes
Income in Liberal
Income Overview in Liberal
Per Capita Income in Liberal is $25,078, while median incomes of families and households are $68,688 and $55,602 respectively.
| Characteristic | Number | Measure |
| Per Capita Income | 19,099 | $25,078 |
| Median Family Income | 4,056 | $68,688 |
| Mean Family Income | 4,056 | $81,074 |
| Median Household Income | 6,224 | $55,602 |
| Mean Household Income | 6,224 | $70,357 |
| Income Deficit | 4,056 | $10,252 |
| Wage / Income Gap (%) | 19,099 | 30.54% |
| Wage / Income Gap ($) | 19,099 | 69.46¢ per $1 |
| Gini / Inequality Index | 19,099 | 0.40 |
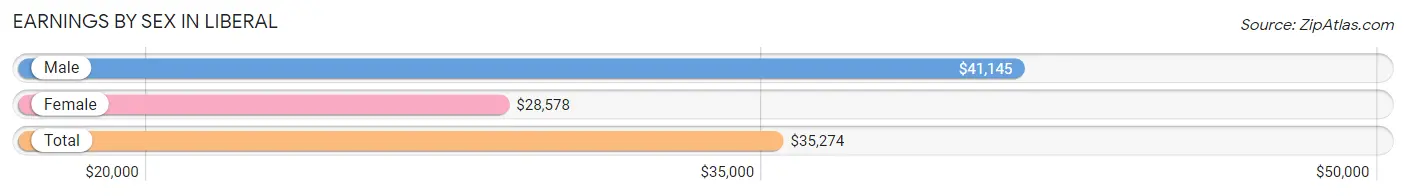
Earnings by Sex in Liberal
Average Earnings in Liberal are $35,274, $41,145 for men and $28,578 for women, a difference of 30.5%.
| Sex | Number | Average Earnings |
| Male | 5,607 (55.3%) | $41,145 |
| Female | 4,527 (44.7%) | $28,578 |
| Total | 10,134 (100.0%) | $35,274 |
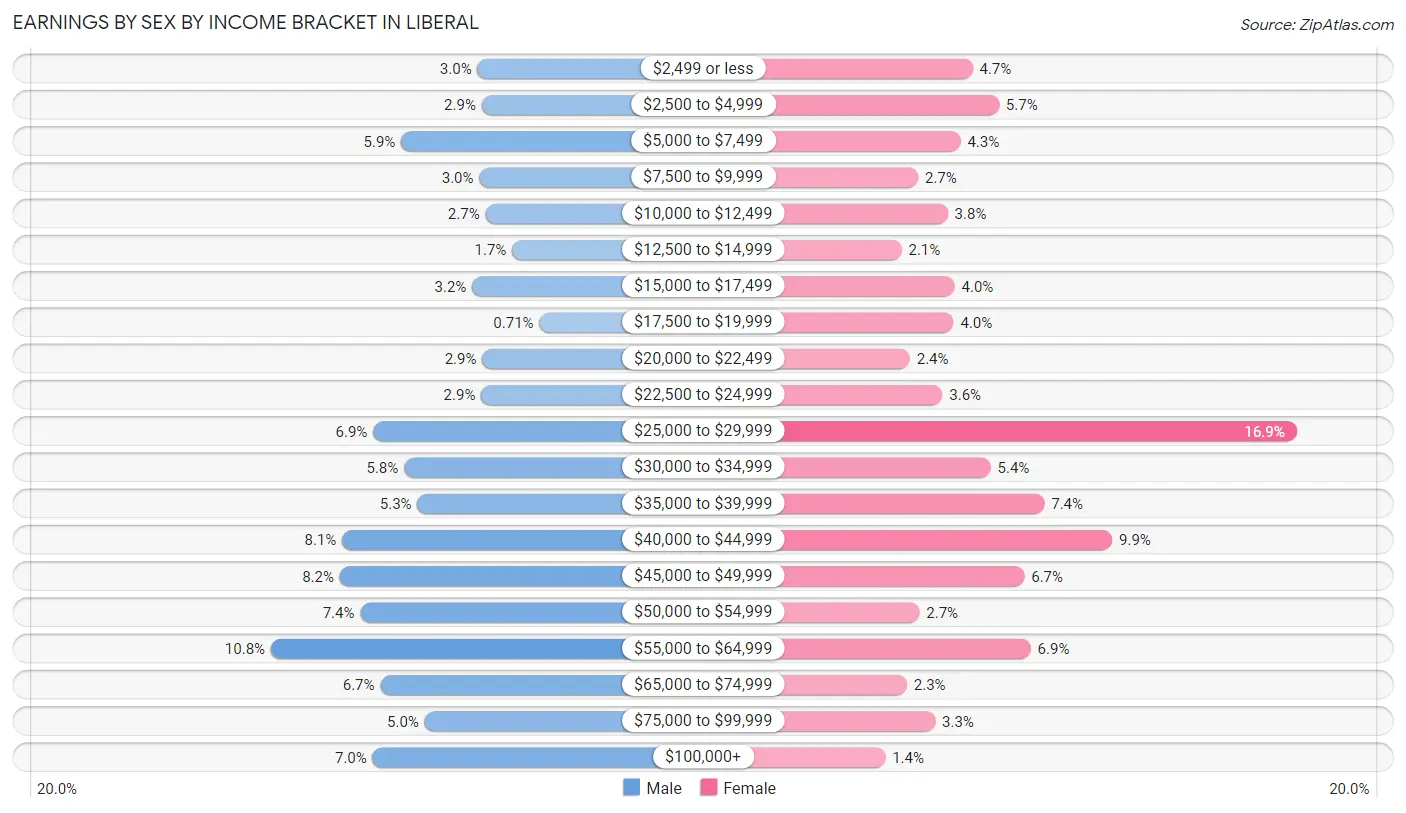
Earnings by Sex by Income Bracket in Liberal
The most common earnings brackets in Liberal are $55,000 to $64,999 for men (604 | 10.8%) and $25,000 to $29,999 for women (763 | 16.9%).
| Income | Male | Female |
| $2,499 or less | 170 (3.0%) | 213 (4.7%) |
| $2,500 to $4,999 | 161 (2.9%) | 258 (5.7%) |
| $5,000 to $7,499 | 330 (5.9%) | 193 (4.3%) |
| $7,500 to $9,999 | 166 (3.0%) | 121 (2.7%) |
| $10,000 to $12,499 | 153 (2.7%) | 171 (3.8%) |
| $12,500 to $14,999 | 97 (1.7%) | 93 (2.1%) |
| $15,000 to $17,499 | 181 (3.2%) | 183 (4.0%) |
| $17,500 to $19,999 | 40 (0.7%) | 181 (4.0%) |
| $20,000 to $22,499 | 160 (2.9%) | 107 (2.4%) |
| $22,500 to $24,999 | 162 (2.9%) | 162 (3.6%) |
| $25,000 to $29,999 | 389 (6.9%) | 763 (16.9%) |
| $30,000 to $34,999 | 324 (5.8%) | 244 (5.4%) |
| $35,000 to $39,999 | 296 (5.3%) | 335 (7.4%) |
| $40,000 to $44,999 | 454 (8.1%) | 450 (9.9%) |
| $45,000 to $49,999 | 459 (8.2%) | 301 (6.7%) |
| $50,000 to $54,999 | 416 (7.4%) | 123 (2.7%) |
| $55,000 to $64,999 | 604 (10.8%) | 312 (6.9%) |
| $65,000 to $74,999 | 374 (6.7%) | 102 (2.2%) |
| $75,000 to $99,999 | 281 (5.0%) | 150 (3.3%) |
| $100,000+ | 390 (7.0%) | 65 (1.4%) |
| Total | 5,607 (100.0%) | 4,527 (100.0%) |
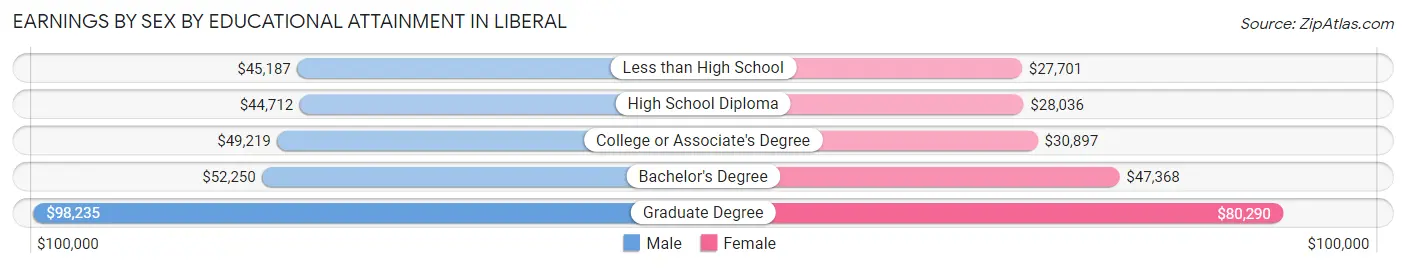
Earnings by Sex by Educational Attainment in Liberal
Average earnings in Liberal are $45,945 for men and $29,813 for women, a difference of 35.1%. Men with an educational attainment of graduate degree enjoy the highest average annual earnings of $98,235, while those with high school diploma education earn the least with $44,712. Women with an educational attainment of graduate degree earn the most with the average annual earnings of $80,290, while those with less than high school education have the smallest earnings of $27,701.
| Educational Attainment | Male Income | Female Income |
| Less than High School | $45,187 | $27,701 |
| High School Diploma | $44,712 | $28,036 |
| College or Associate's Degree | $49,219 | $30,897 |
| Bachelor's Degree | $52,250 | $47,368 |
| Graduate Degree | $98,235 | $80,290 |
| Total | $45,945 | $29,813 |
Family Income in Liberal
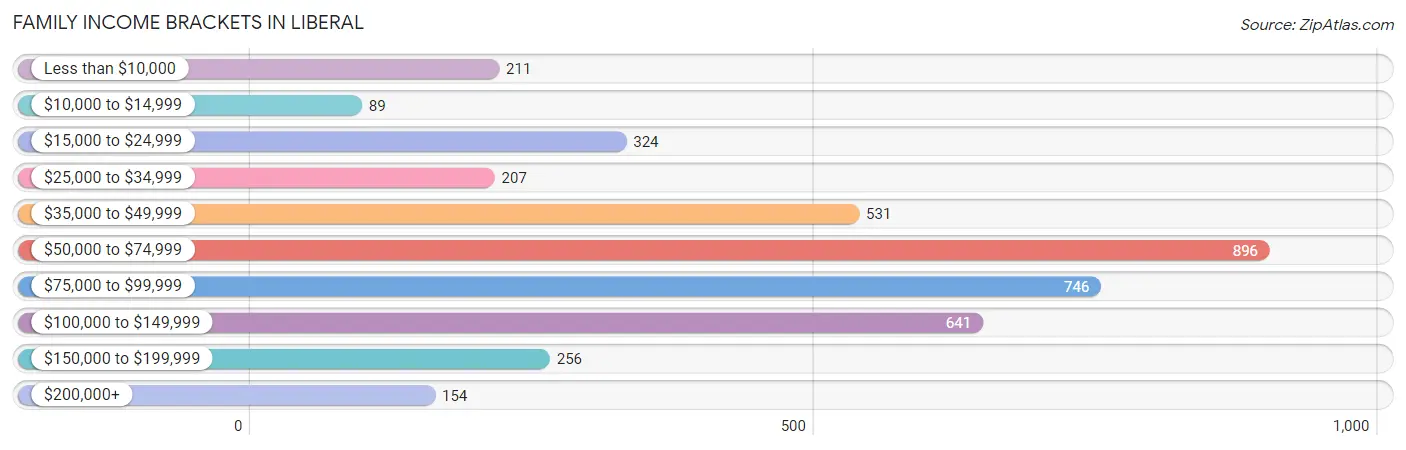
Family Income Brackets in Liberal
According to the Liberal family income data, there are 896 families falling into the $50,000 to $74,999 income range, which is the most common income bracket and makes up 22.1% of all families. Conversely, the $10,000 to $14,999 income bracket is the least frequent group with only 89 families (2.2%) belonging to this category.
| Income Bracket | # Families | % Families |
| Less than $10,000 | 211 | 5.2% |
| $10,000 to $14,999 | 89 | 2.2% |
| $15,000 to $24,999 | 324 | 8.0% |
| $25,000 to $34,999 | 207 | 5.1% |
| $35,000 to $49,999 | 531 | 13.1% |
| $50,000 to $74,999 | 896 | 22.1% |
| $75,000 to $99,999 | 746 | 18.4% |
| $100,000 to $149,999 | 641 | 15.8% |
| $150,000 to $199,999 | 256 | 6.3% |
| $200,000+ | 154 | 3.8% |
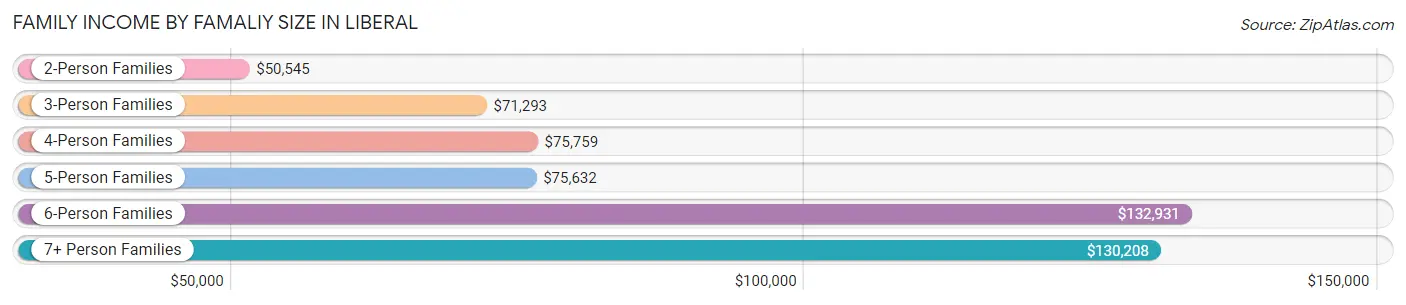
Family Income by Famaliy Size in Liberal
6-person families (176 | 4.3%) account for the highest median family income in Liberal with $132,931 per family, while 2-person families (1,261 | 31.1%) have the highest median income of $25,272 per family member.
| Income Bracket | # Families | Median Income |
| 2-Person Families | 1,261 (31.1%) | $50,545 |
| 3-Person Families | 982 (24.2%) | $71,293 |
| 4-Person Families | 875 (21.6%) | $75,759 |
| 5-Person Families | 714 (17.6%) | $75,632 |
| 6-Person Families | 176 (4.3%) | $132,931 |
| 7+ Person Families | 48 (1.2%) | $130,208 |
| Total | 4,056 (100.0%) | $68,688 |
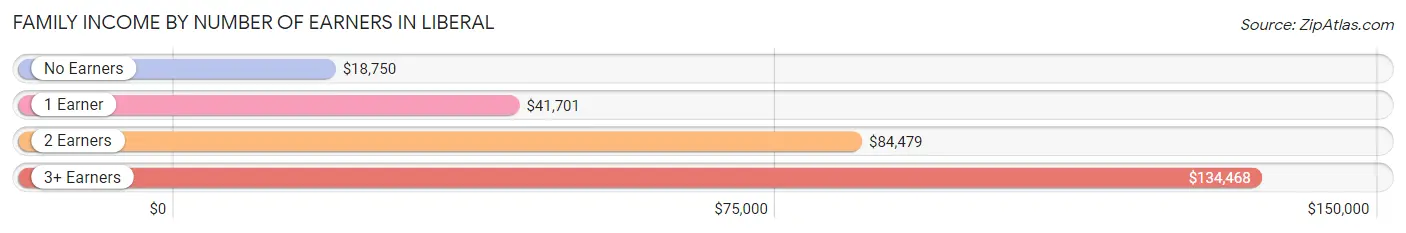
Family Income by Number of Earners in Liberal
The median family income in Liberal is $68,688, with families comprising 3+ earners (643) having the highest median family income of $134,468, while families with no earners (179) have the lowest median family income of $18,750, accounting for 15.9% and 4.4% of families, respectively.
| Number of Earners | # Families | Median Income |
| No Earners | 179 (4.4%) | $18,750 |
| 1 Earner | 1,500 (37.0%) | $41,701 |
| 2 Earners | 1,734 (42.7%) | $84,479 |
| 3+ Earners | 643 (15.9%) | $134,468 |
| Total | 4,056 (100.0%) | $68,688 |
Household Income in Liberal
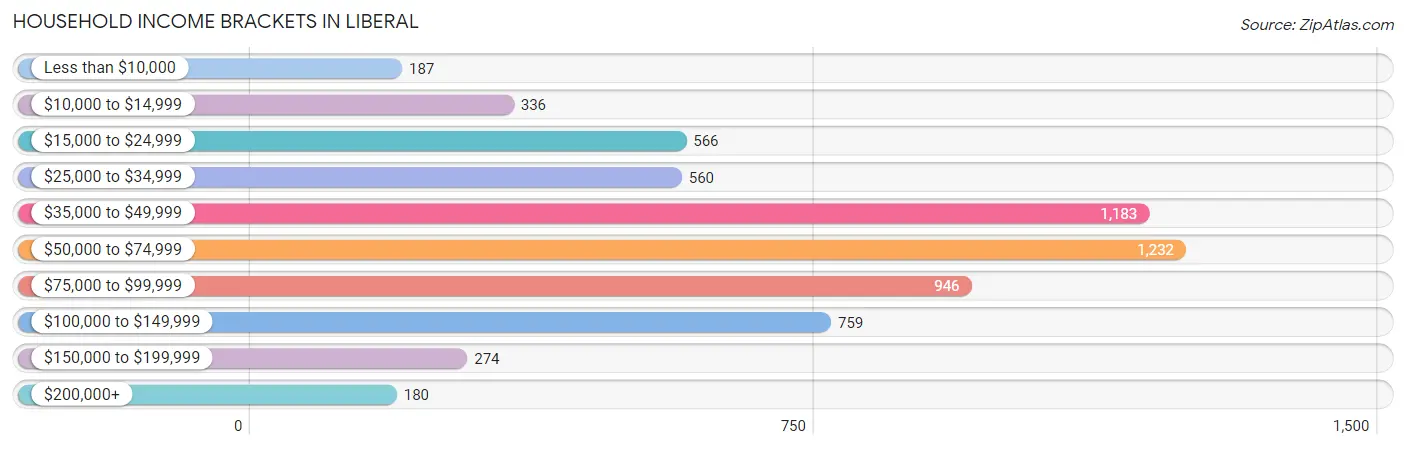
Household Income Brackets in Liberal
With 1,232 households falling in the category, the $50,000 to $74,999 income range is the most frequent in Liberal, accounting for 19.8% of all households. In contrast, only 180 households (2.9%) fall into the $200,000+ income bracket, making it the least populous group.
| Income Bracket | # Households | % Households |
| Less than $10,000 | 187 | 3.0% |
| $10,000 to $14,999 | 336 | 5.4% |
| $15,000 to $24,999 | 566 | 9.1% |
| $25,000 to $34,999 | 560 | 9.0% |
| $35,000 to $49,999 | 1,183 | 19.0% |
| $50,000 to $74,999 | 1,232 | 19.8% |
| $75,000 to $99,999 | 946 | 15.2% |
| $100,000 to $149,999 | 759 | 12.2% |
| $150,000 to $199,999 | 274 | 4.4% |
| $200,000+ | 180 | 2.9% |
Household Income by Householder Age in Liberal
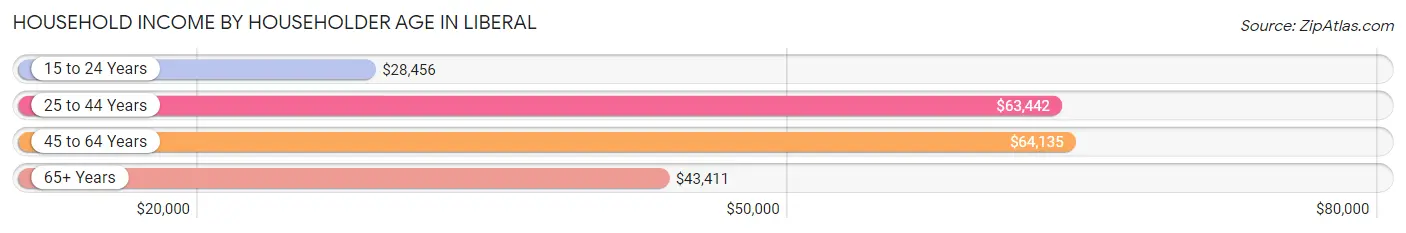
The median household income in Liberal is $55,602, with the highest median household income of $64,135 found in the 45 to 64 years age bracket for the primary householder. A total of 2,231 households (35.8%) fall into this category. Meanwhile, the 15 to 24 years age bracket for the primary householder has the lowest median household income of $28,456, with 497 households (8.0%) in this group.
| Income Bracket | # Households | Median Income |
| 15 to 24 Years | 497 (8.0%) | $28,456 |
| 25 to 44 Years | 2,430 (39.0%) | $63,442 |
| 45 to 64 Years | 2,231 (35.8%) | $64,135 |
| 65+ Years | 1,066 (17.1%) | $43,411 |
| Total | 6,224 (100.0%) | $55,602 |
Poverty in Liberal
Income Below Poverty by Sex and Age in Liberal
With 14.0% poverty level for males and 15.7% for females among the residents of Liberal, 5 year old males and 5 year old females are the most vulnerable to poverty, with 68 males (38.6%) and 26 females (34.2%) in their respective age groups living below the poverty level.
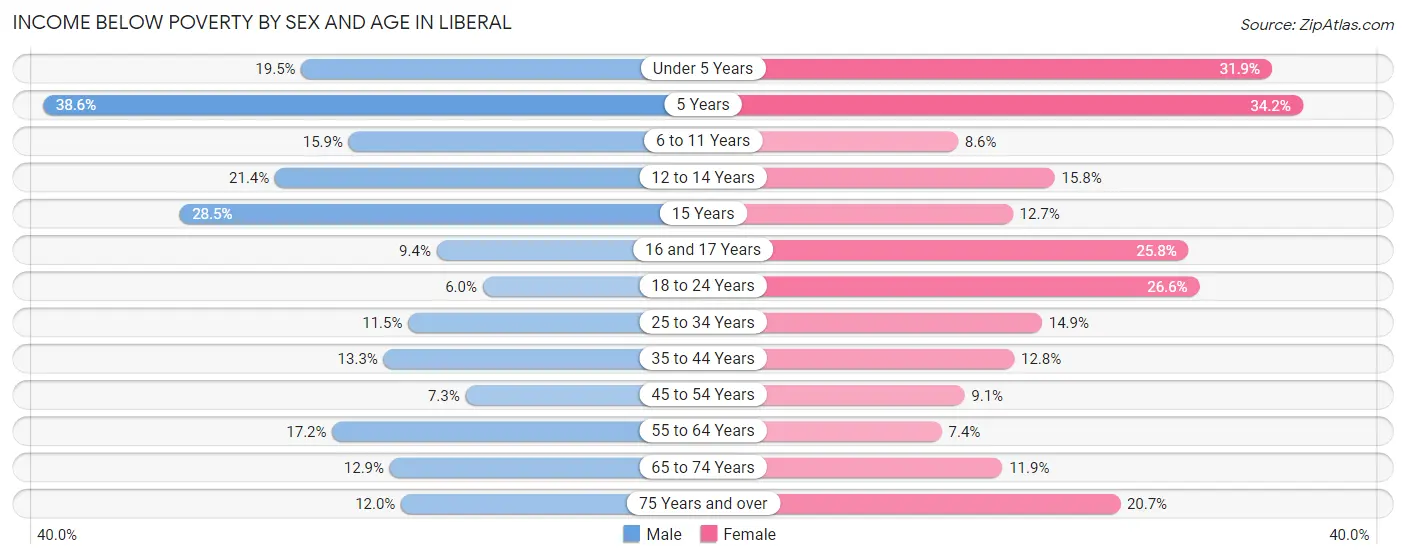
| Age Bracket | Male | Female |
| Under 5 Years | 169 (19.5%) | 251 (31.9%) |
| 5 Years | 68 (38.6%) | 26 (34.2%) |
| 6 to 11 Years | 176 (15.9%) | 94 (8.6%) |
| 12 to 14 Years | 92 (21.4%) | 73 (15.8%) |
| 15 Years | 73 (28.5%) | 27 (12.7%) |
| 16 and 17 Years | 28 (9.4%) | 43 (25.8%) |
| 18 to 24 Years | 56 (6.0%) | 236 (26.6%) |
| 25 to 34 Years | 165 (11.5%) | 207 (14.8%) |
| 35 to 44 Years | 172 (13.3%) | 137 (12.8%) |
| 45 to 54 Years | 81 (7.3%) | 87 (9.1%) |
| 55 to 64 Years | 177 (17.2%) | 67 (7.4%) |
| 65 to 74 Years | 59 (12.9%) | 61 (11.9%) |
| 75 Years and over | 33 (12.0%) | 101 (20.6%) |
| Total | 1,349 (14.0%) | 1,410 (15.7%) |
Income Above Poverty by Sex and Age in Liberal
According to the poverty statistics in Liberal, males aged 18 to 24 years and females aged 55 to 64 years are the age groups that are most secure financially, with 94.0% of males and 92.6% of females in these age groups living above the poverty line.
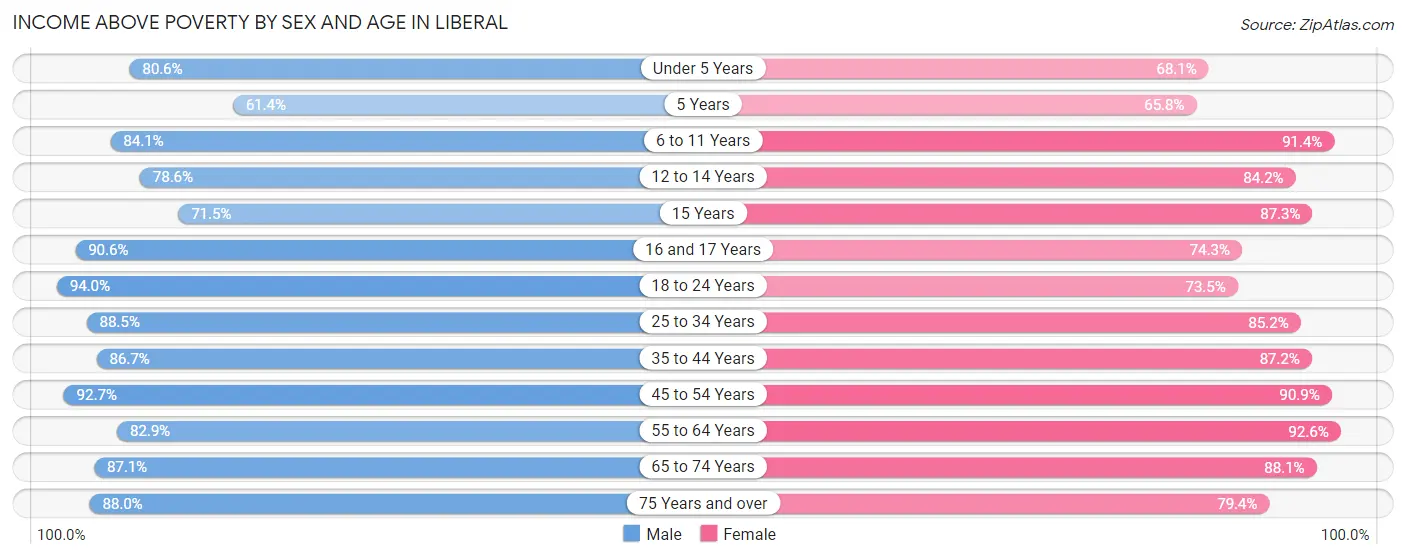
| Age Bracket | Male | Female |
| Under 5 Years | 700 (80.5%) | 535 (68.1%) |
| 5 Years | 108 (61.4%) | 50 (65.8%) |
| 6 to 11 Years | 929 (84.1%) | 998 (91.4%) |
| 12 to 14 Years | 338 (78.6%) | 389 (84.2%) |
| 15 Years | 183 (71.5%) | 186 (87.3%) |
| 16 and 17 Years | 270 (90.6%) | 124 (74.3%) |
| 18 to 24 Years | 881 (94.0%) | 653 (73.5%) |
| 25 to 34 Years | 1,268 (88.5%) | 1,187 (85.2%) |
| 35 to 44 Years | 1,117 (86.7%) | 934 (87.2%) |
| 45 to 54 Years | 1,035 (92.7%) | 869 (90.9%) |
| 55 to 64 Years | 855 (82.9%) | 837 (92.6%) |
| 65 to 74 Years | 399 (87.1%) | 451 (88.1%) |
| 75 Years and over | 241 (88.0%) | 388 (79.3%) |
| Total | 8,324 (86.1%) | 7,601 (84.4%) |
Income Below Poverty Among Married-Couple Families in Liberal
The poverty statistics for married-couple families in Liberal show that 7.5% or 209 of the total 2,800 families live below the poverty line. Families with 1 or 2 children have the highest poverty rate of 16.2%, comprising of 130 families. On the other hand, families with no children have the lowest poverty rate of 2.1%, which includes 27 families.
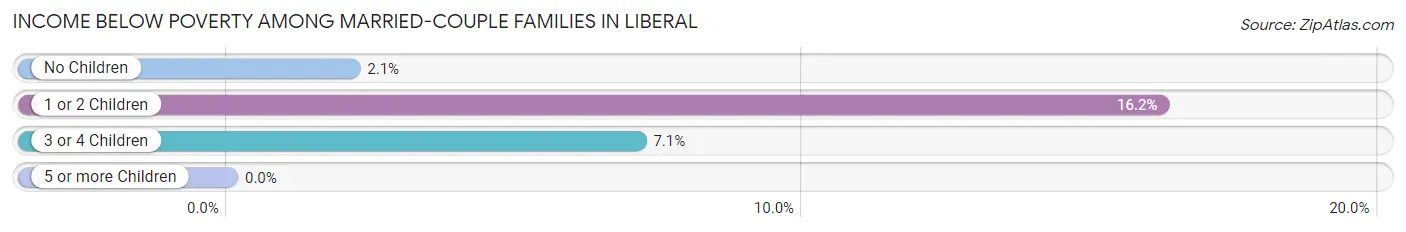
| Children | Above Poverty | Below Poverty |
| No Children | 1,240 (97.9%) | 27 (2.1%) |
| 1 or 2 Children | 672 (83.8%) | 130 (16.2%) |
| 3 or 4 Children | 679 (92.9%) | 52 (7.1%) |
| 5 or more Children | 0 (0.0%) | 0 (0.0%) |
| Total | 2,591 (92.5%) | 209 (7.5%) |
Income Below Poverty Among Single-Parent Households in Liberal
According to the poverty data in Liberal, 34.6% or 126 single-father households and 24.0% or 214 single-mother households are living below the poverty line. Among single-father households, those with 3 or 4 children have the highest poverty rate, with 78 households (66.7%) experiencing poverty. Likewise, among single-mother households, those with 1 or 2 children have the highest poverty rate, with 171 households (27.3%) falling below the poverty line.
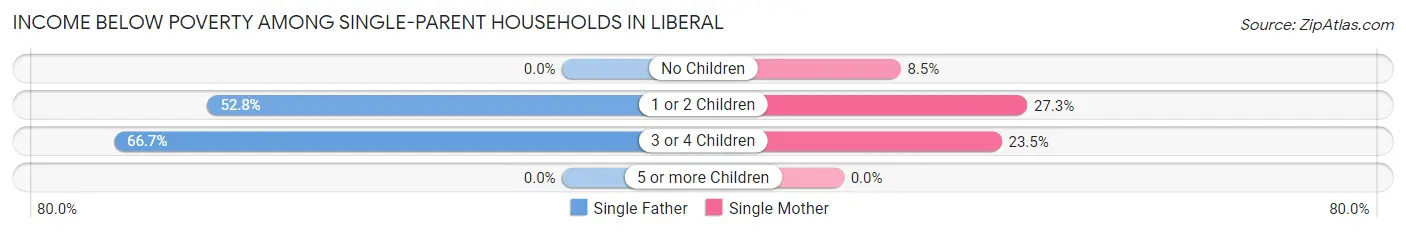
| Children | Single Father | Single Mother |
| No Children | 0 (0.0%) | 11 (8.5%) |
| 1 or 2 Children | 48 (52.7%) | 171 (27.3%) |
| 3 or 4 Children | 78 (66.7%) | 32 (23.5%) |
| 5 or more Children | 0 (0.0%) | 0 (0.0%) |
| Total | 126 (34.6%) | 214 (24.0%) |
Income Below Poverty Among Married-Couple vs Single-Parent Households in Liberal
The poverty data for Liberal shows that 209 of the married-couple family households (7.5%) and 340 of the single-parent households (27.1%) are living below the poverty level. Within the married-couple family households, those with 1 or 2 children have the highest poverty rate, with 130 households (16.2%) falling below the poverty line. Among the single-parent households, those with 3 or 4 children have the highest poverty rate, with 110 household (43.5%) living below poverty.
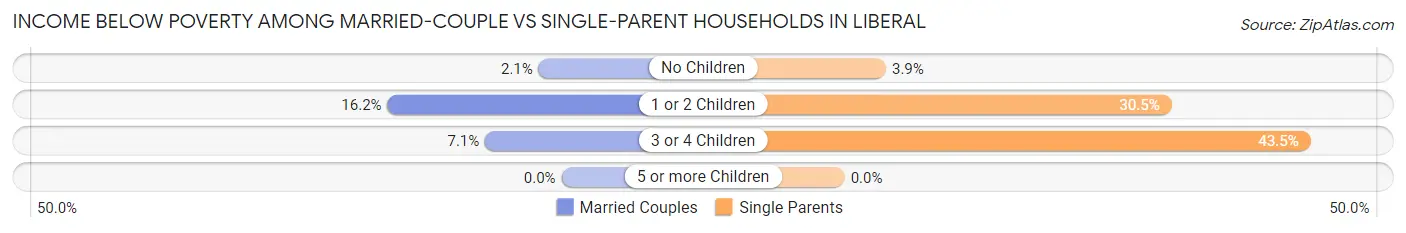
| Children | Married-Couple Families | Single-Parent Households |
| No Children | 27 (2.1%) | 11 (3.8%) |
| 1 or 2 Children | 130 (16.2%) | 219 (30.5%) |
| 3 or 4 Children | 52 (7.1%) | 110 (43.5%) |
| 5 or more Children | 0 (0.0%) | 0 (0.0%) |
| Total | 209 (7.5%) | 340 (27.1%) |
Race in Liberal
The most populous races in Liberal are Hispanic or Latino (12,649 | 66.2%), White / Caucasian (8,466 | 44.3%), and Some other Race (5,174 | 27.1%).
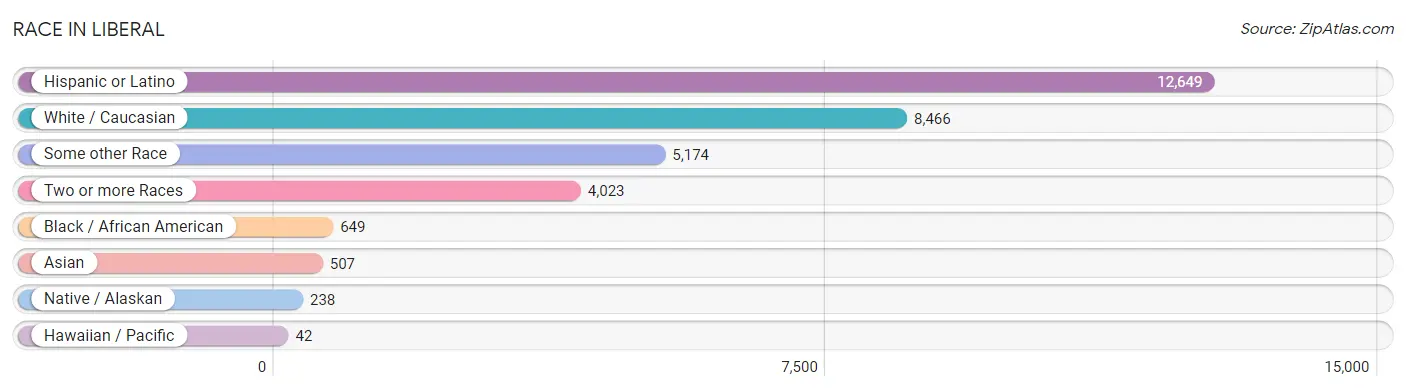
| Race | # Population | % Population |
| Asian | 507 | 2.6% |
| Black / African American | 649 | 3.4% |
| Hawaiian / Pacific | 42 | 0.2% |
| Hispanic or Latino | 12,649 | 66.2% |
| Native / Alaskan | 238 | 1.3% |
| White / Caucasian | 8,466 | 44.3% |
| Two or more Races | 4,023 | 21.1% |
| Some other Race | 5,174 | 27.1% |
| Total | 19,099 | 100.0% |
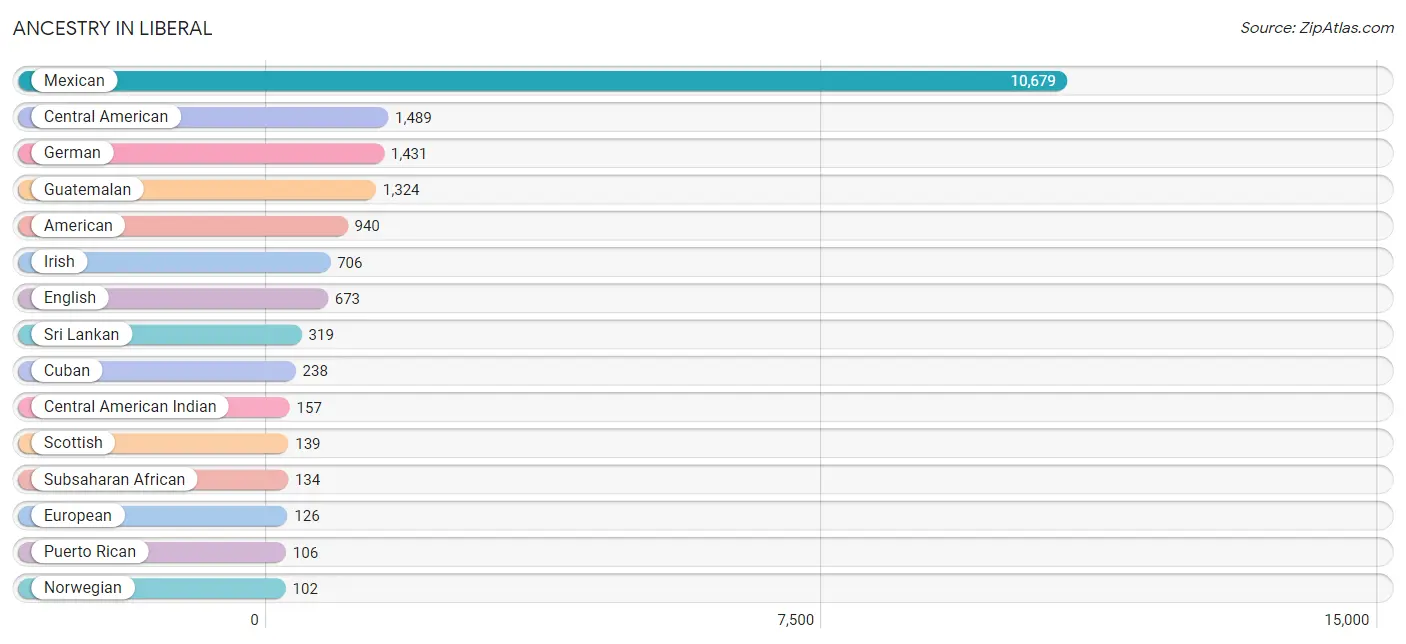
Ancestry in Liberal
The most populous ancestries reported in Liberal are Mexican (10,679 | 55.9%), Central American (1,489 | 7.8%), German (1,431 | 7.5%), Guatemalan (1,324 | 6.9%), and American (940 | 4.9%), together accounting for 83.1% of all Liberal residents.
| Ancestry | # Population | % Population |
| African | 43 | 0.2% |
| American | 940 | 4.9% |
| Arab | 5 | 0.0% |
| Austrian | 5 | 0.0% |
| Bhutanese | 59 | 0.3% |
| Brazilian | 6 | 0.0% |
| Burmese | 11 | 0.1% |
| Central American | 1,489 | 7.8% |
| Central American Indian | 157 | 0.8% |
| Cherokee | 20 | 0.1% |
| Choctaw | 13 | 0.1% |
| Croatian | 6 | 0.0% |
| Cuban | 238 | 1.3% |
| Czechoslovakian | 14 | 0.1% |
| Danish | 6 | 0.0% |
| Dominican | 25 | 0.1% |
| Dutch | 63 | 0.3% |
| Eastern European | 15 | 0.1% |
| English | 673 | 3.5% |
| European | 126 | 0.7% |
| Finnish | 20 | 0.1% |
| French | 22 | 0.1% |
| French Canadian | 56 | 0.3% |
| German | 1,431 | 7.5% |
| Guatemalan | 1,324 | 6.9% |
| Haitian | 15 | 0.1% |
| Honduran | 97 | 0.5% |
| Irish | 706 | 3.7% |
| Italian | 76 | 0.4% |
| Japanese | 41 | 0.2% |
| Lebanese | 5 | 0.0% |
| Malaysian | 52 | 0.3% |
| Mexican | 10,679 | 55.9% |
| Nicaraguan | 32 | 0.2% |
| Norwegian | 102 | 0.5% |
| Polish | 25 | 0.1% |
| Portuguese | 7 | 0.0% |
| Puerto Rican | 106 | 0.6% |
| Russian | 28 | 0.2% |
| Salvadoran | 36 | 0.2% |
| Samoan | 42 | 0.2% |
| Scandinavian | 28 | 0.2% |
| Scotch-Irish | 78 | 0.4% |
| Scottish | 139 | 0.7% |
| South American | 39 | 0.2% |
| Spaniard | 10 | 0.1% |
| Spanish | 1 | 0.0% |
| Sri Lankan | 319 | 1.7% |
| Subsaharan African | 134 | 0.7% |
| Swedish | 67 | 0.4% |
| Swiss | 67 | 0.4% |
| Thai | 84 | 0.4% |
| Venezuelan | 39 | 0.2% |
| Welsh | 25 | 0.1% | View All 54 Rows |
Immigrants in Liberal
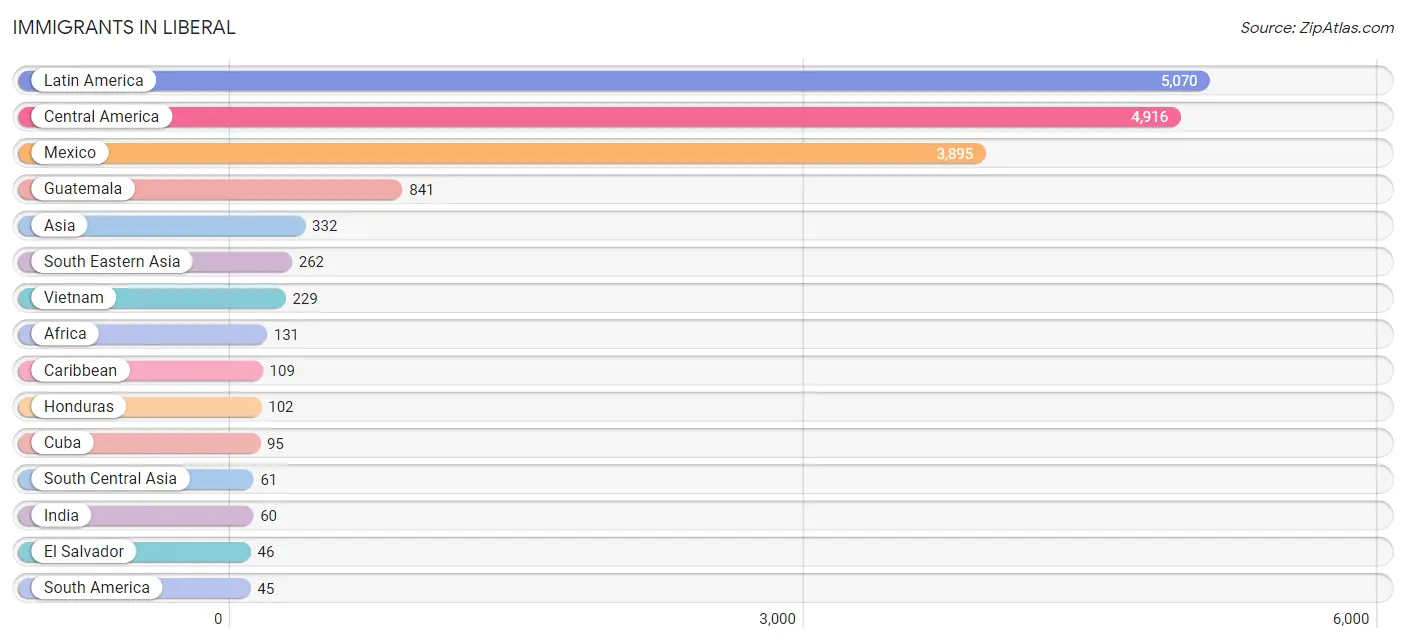
The most numerous immigrant groups reported in Liberal came from Latin America (5,070 | 26.6%), Central America (4,916 | 25.7%), Mexico (3,895 | 20.4%), Guatemala (841 | 4.4%), and Asia (332 | 1.7%), together accounting for 78.8% of all Liberal residents.
| Immigration Origin | # Population | % Population |
| Africa | 131 | 0.7% |
| Asia | 332 | 1.7% |
| Brazil | 6 | 0.0% |
| Cambodia | 16 | 0.1% |
| Canada | 29 | 0.2% |
| Caribbean | 109 | 0.6% |
| Central America | 4,916 | 25.7% |
| Cuba | 95 | 0.5% |
| Eastern Africa | 43 | 0.2% |
| Eastern Asia | 9 | 0.1% |
| Eastern Europe | 11 | 0.1% |
| El Salvador | 46 | 0.2% |
| Eritrea | 43 | 0.2% |
| Europe | 21 | 0.1% |
| Guatemala | 841 | 4.4% |
| Honduras | 102 | 0.5% |
| India | 60 | 0.3% |
| Korea | 9 | 0.1% |
| Laos | 17 | 0.1% |
| Latin America | 5,070 | 26.6% |
| Mexico | 3,895 | 20.4% |
| Nicaragua | 32 | 0.2% |
| Poland | 11 | 0.1% |
| South America | 45 | 0.2% |
| South Central Asia | 61 | 0.3% |
| South Eastern Asia | 262 | 1.4% |
| Southern Europe | 10 | 0.1% |
| Spain | 10 | 0.1% |
| Sri Lanka | 1 | 0.0% |
| Venezuela | 39 | 0.2% |
| Vietnam | 229 | 1.2% | View All 31 Rows |
Sex and Age in Liberal
Sex and Age in Liberal
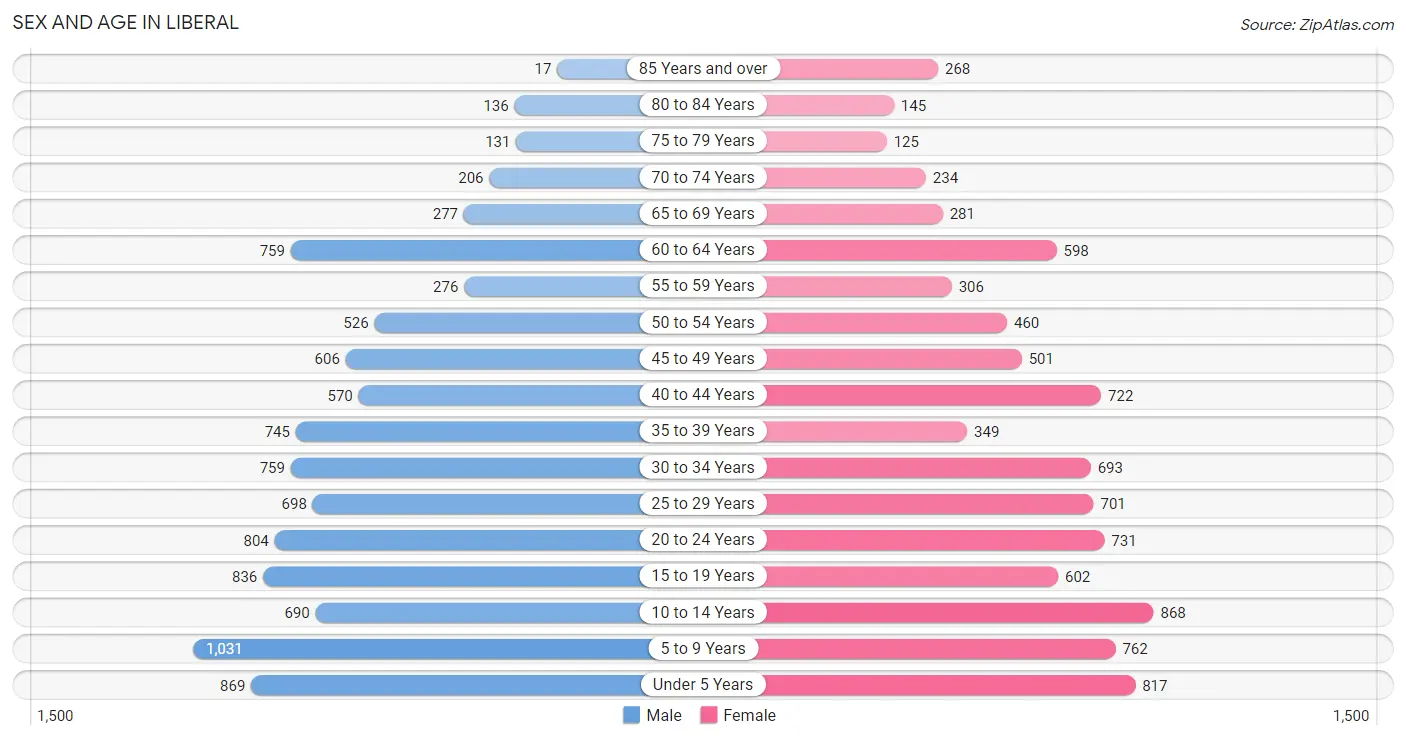
The most populous age groups in Liberal are 5 to 9 Years (1,031 | 10.4%) for men and 10 to 14 Years (868 | 9.5%) for women.
| Age Bracket | Male | Female |
| Under 5 Years | 869 (8.7%) | 817 (8.9%) |
| 5 to 9 Years | 1,031 (10.4%) | 762 (8.3%) |
| 10 to 14 Years | 690 (6.9%) | 868 (9.5%) |
| 15 to 19 Years | 836 (8.4%) | 602 (6.6%) |
| 20 to 24 Years | 804 (8.1%) | 731 (8.0%) |
| 25 to 29 Years | 698 (7.0%) | 701 (7.6%) |
| 30 to 34 Years | 759 (7.6%) | 693 (7.6%) |
| 35 to 39 Years | 745 (7.5%) | 349 (3.8%) |
| 40 to 44 Years | 570 (5.7%) | 722 (7.9%) |
| 45 to 49 Years | 606 (6.1%) | 501 (5.5%) |
| 50 to 54 Years | 526 (5.3%) | 460 (5.0%) |
| 55 to 59 Years | 276 (2.8%) | 306 (3.3%) |
| 60 to 64 Years | 759 (7.6%) | 598 (6.5%) |
| 65 to 69 Years | 277 (2.8%) | 281 (3.1%) |
| 70 to 74 Years | 206 (2.1%) | 234 (2.5%) |
| 75 to 79 Years | 131 (1.3%) | 125 (1.4%) |
| 80 to 84 Years | 136 (1.4%) | 145 (1.6%) |
| 85 Years and over | 17 (0.2%) | 268 (2.9%) |
| Total | 9,936 (100.0%) | 9,163 (100.0%) |
Families and Households in Liberal
Median Family Size in Liberal
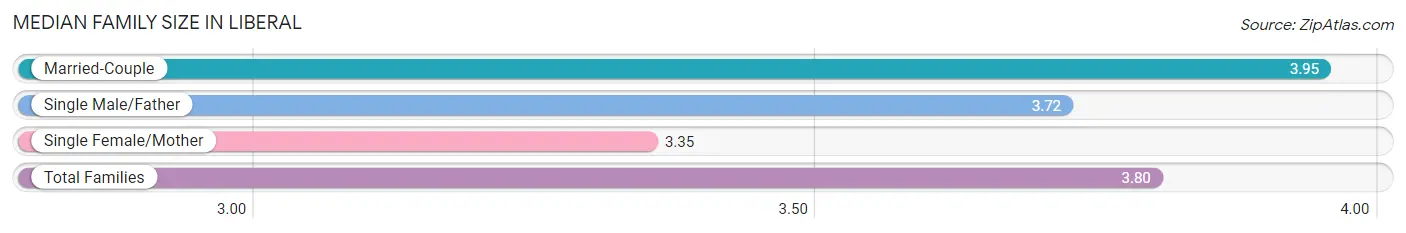
The median family size in Liberal is 3.80 persons per family, with married-couple families (2,800 | 69.0%) accounting for the largest median family size of 3.95 persons per family. On the other hand, single female/mother families (892 | 22.0%) represent the smallest median family size with 3.35 persons per family.
| Family Type | # Families | Family Size |
| Married-Couple | 2,800 (69.0%) | 3.95 |
| Single Male/Father | 364 (9.0%) | 3.72 |
| Single Female/Mother | 892 (22.0%) | 3.35 |
| Total Families | 4,056 (100.0%) | 3.80 |
Median Household Size in Liberal
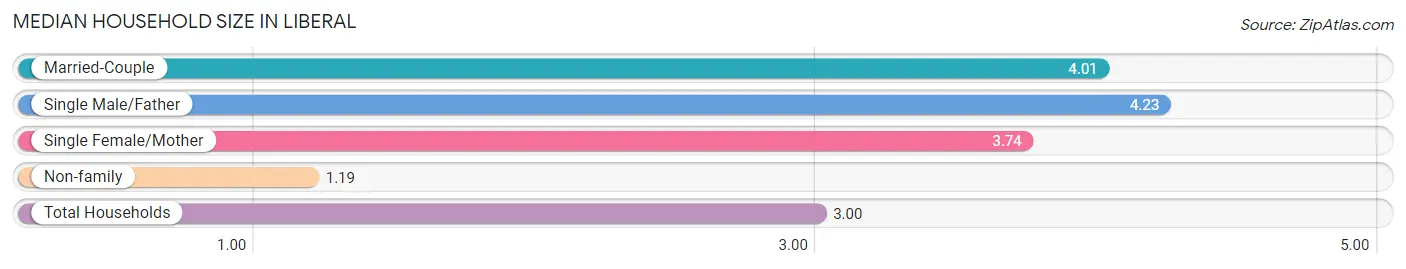
The median household size in Liberal is 3.00 persons per household, with single male/father households (364 | 5.9%) accounting for the largest median household size of 4.23 persons per household. non-family households (2,168 | 34.8%) represent the smallest median household size with 1.19 persons per household.
| Household Type | # Households | Household Size |
| Married-Couple | 2,800 (45.0%) | 4.01 |
| Single Male/Father | 364 (5.9%) | 4.23 |
| Single Female/Mother | 892 (14.3%) | 3.74 |
| Non-family | 2,168 (34.8%) | 1.19 |
| Total Households | 6,224 (100.0%) | 3.00 |
Household Size by Marriage Status in Liberal
Out of a total of 6,224 households in Liberal, 4,056 (65.2%) are family households, while 2,168 (34.8%) are nonfamily households. The most numerous type of family households are 3-person households, comprising 1,125, and the most common type of nonfamily households are 1-person households, comprising 1,881.
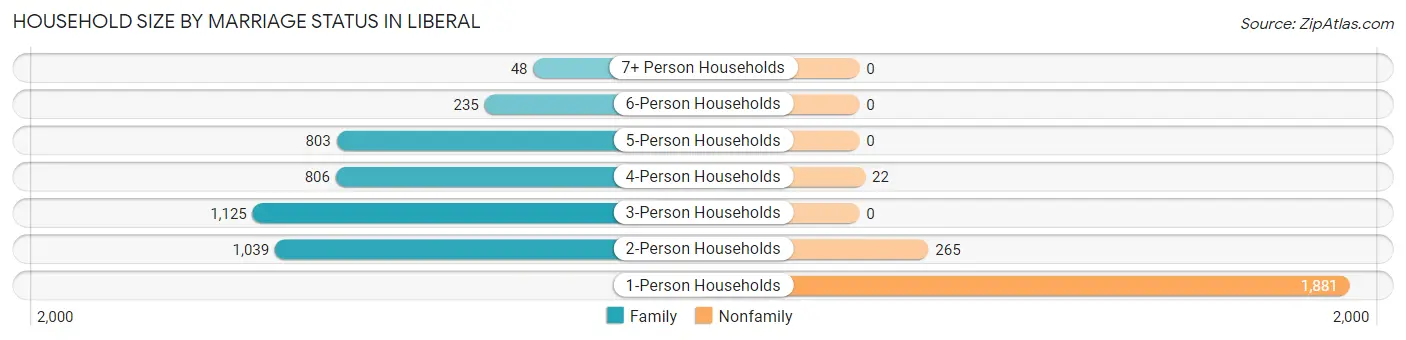
| Household Size | Family Households | Nonfamily Households |
| 1-Person Households | - | 1,881 (30.2%) |
| 2-Person Households | 1,039 (16.7%) | 265 (4.3%) |
| 3-Person Households | 1,125 (18.1%) | 0 (0.0%) |
| 4-Person Households | 806 (13.0%) | 22 (0.4%) |
| 5-Person Households | 803 (12.9%) | 0 (0.0%) |
| 6-Person Households | 235 (3.8%) | 0 (0.0%) |
| 7+ Person Households | 48 (0.8%) | 0 (0.0%) |
| Total | 4,056 (65.2%) | 2,168 (34.8%) |
Female Fertility in Liberal
Fertility by Age in Liberal
Average fertility rate in Liberal is 86.0 births per 1,000 women. Women in the age bracket of 20 to 34 years have the highest fertility rate with 142.0 births per 1,000 women. Women in the age bracket of 20 to 34 years acount for 78.8% of all women with births.
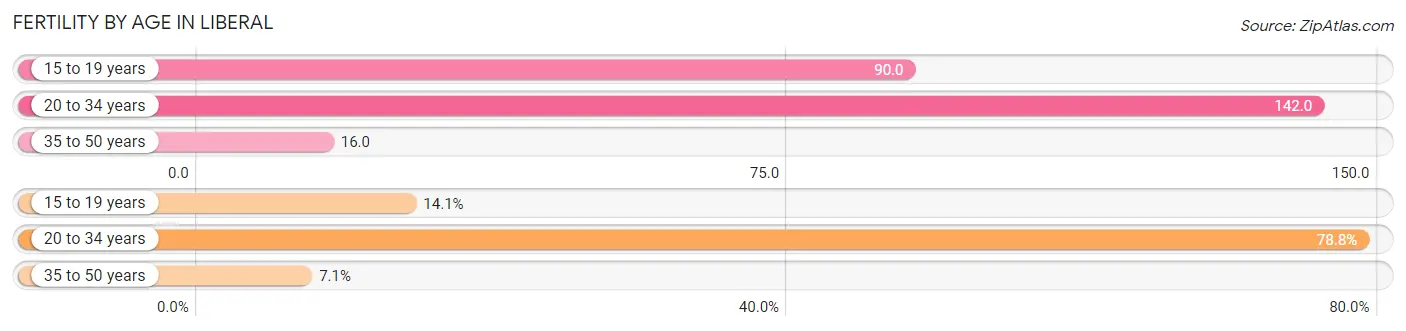
| Age Bracket | Women with Births | Births / 1,000 Women |
| 15 to 19 years | 54 (14.1%) | 90.0 |
| 20 to 34 years | 301 (78.8%) | 142.0 |
| 35 to 50 years | 27 (7.1%) | 16.0 |
| Total | 382 (100.0%) | 86.0 |
Fertility by Age by Marriage Status in Liberal
44.5% of women with births (382) in Liberal are married. The highest percentage of unmarried women with births falls into 15 to 19 years age bracket with 75.9% of them unmarried at the time of birth, while the lowest percentage of unmarried women with births belong to 35 to 50 years age bracket with 0.0% of them unmarried.
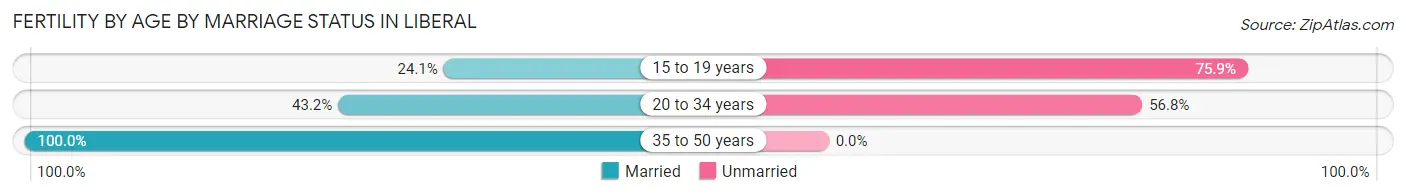
| Age Bracket | Married | Unmarried |
| 15 to 19 years | 13 (24.1%) | 41 (75.9%) |
| 20 to 34 years | 130 (43.2%) | 171 (56.8%) |
| 35 to 50 years | 27 (100.0%) | 0 (0.0%) |
| Total | 170 (44.5%) | 212 (55.5%) |
Fertility by Education in Liberal
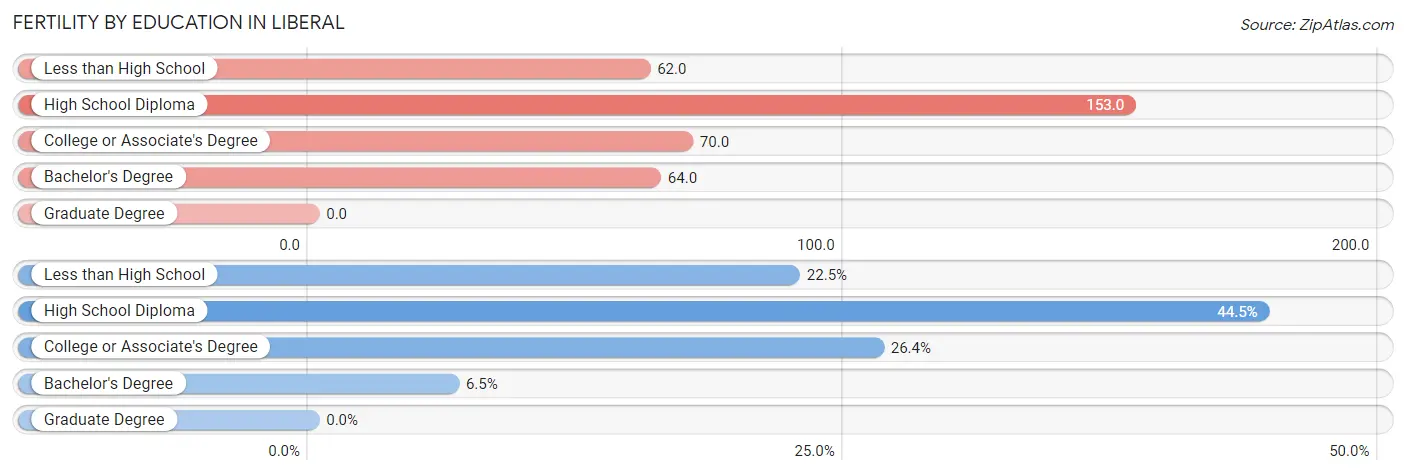
| Educational Attainment | Women with Births | Births / 1,000 Women |
| Less than High School | 86 (22.5%) | 62.0 |
| High School Diploma | 170 (44.5%) | 153.0 |
| College or Associate's Degree | 101 (26.4%) | 70.0 |
| Bachelor's Degree | 25 (6.5%) | 64.0 |
| Graduate Degree | 0 (0.0%) | 0.0 |
| Total | 382 (100.0%) | 86.0 |
Fertility by Education by Marriage Status in Liberal
55.5% of women with births in Liberal are unmarried. Women with the educational attainment of bachelor's degree are most likely to be married with 100.0% of them married at childbirth, while women with the educational attainment of high school diploma are least likely to be married with 85.3% of them unmarried at childbirth.
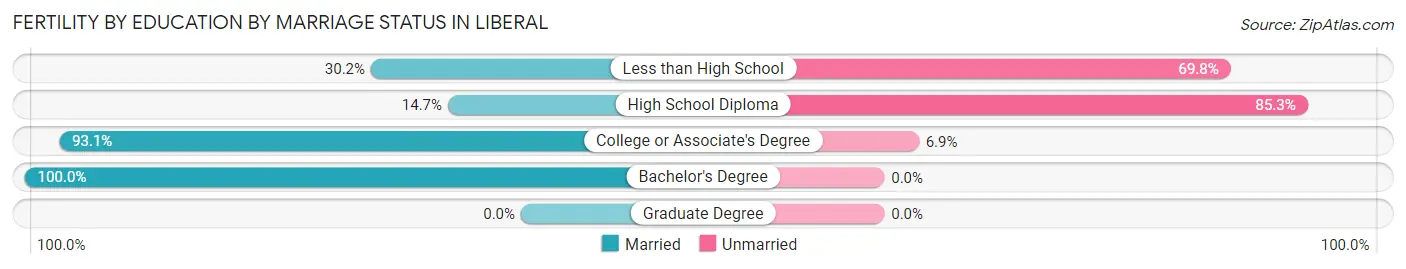
| Educational Attainment | Married | Unmarried |
| Less than High School | 26 (30.2%) | 60 (69.8%) |
| High School Diploma | 25 (14.7%) | 145 (85.3%) |
| College or Associate's Degree | 94 (93.1%) | 7 (6.9%) |
| Bachelor's Degree | 25 (100.0%) | 0 (0.0%) |
| Graduate Degree | 0 (0.0%) | 0 (0.0%) |
| Total | 170 (44.5%) | 212 (55.5%) |
Employment Characteristics in Liberal
Employment by Class of Employer in Liberal
Among the 9,055 employed individuals in Liberal, private company employees (6,628 | 73.2%), local government employees (849 | 9.4%), and self-employed (not incorporated) (527 | 5.8%) make up the most common classes of employment.
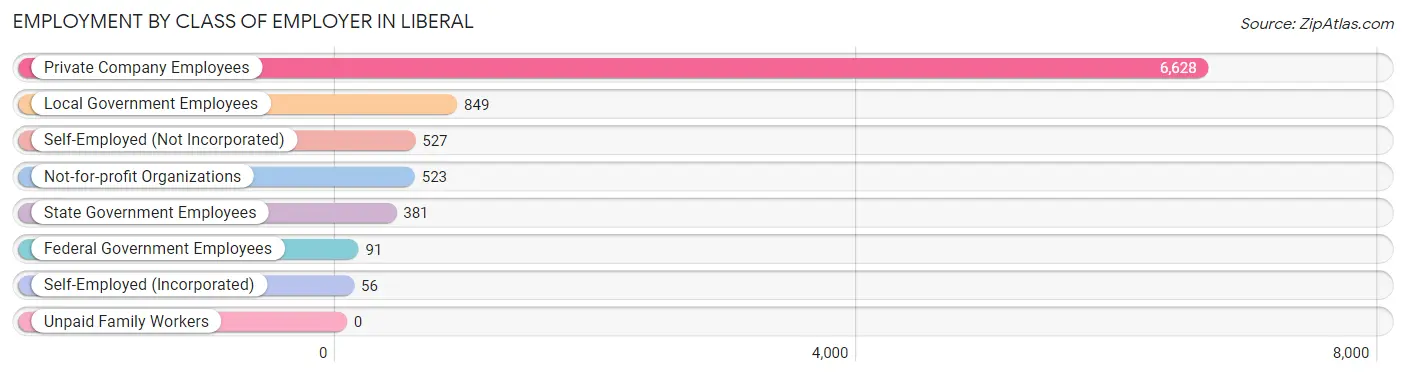
| Employer Class | # Employees | % Employees |
| Private Company Employees | 6,628 | 73.2% |
| Self-Employed (Incorporated) | 56 | 0.6% |
| Self-Employed (Not Incorporated) | 527 | 5.8% |
| Not-for-profit Organizations | 523 | 5.8% |
| Local Government Employees | 849 | 9.4% |
| State Government Employees | 381 | 4.2% |
| Federal Government Employees | 91 | 1.0% |
| Unpaid Family Workers | 0 | 0.0% |
| Total | 9,055 | 100.0% |
Employment Status by Age in Liberal
According to the labor force statistics for Liberal, out of the total population over 16 years of age (13,593), 70.5% or 9,583 individuals are in the labor force, with 2.7% or 259 of them unemployed. The age group with the highest labor force participation rate is 45 to 54 years, with 91.0% or 1,905 individuals in the labor force. Within the labor force, the 16 to 19 years age range has the highest percentage of unemployed individuals, with 10.8% or 60 of them being unemployed.
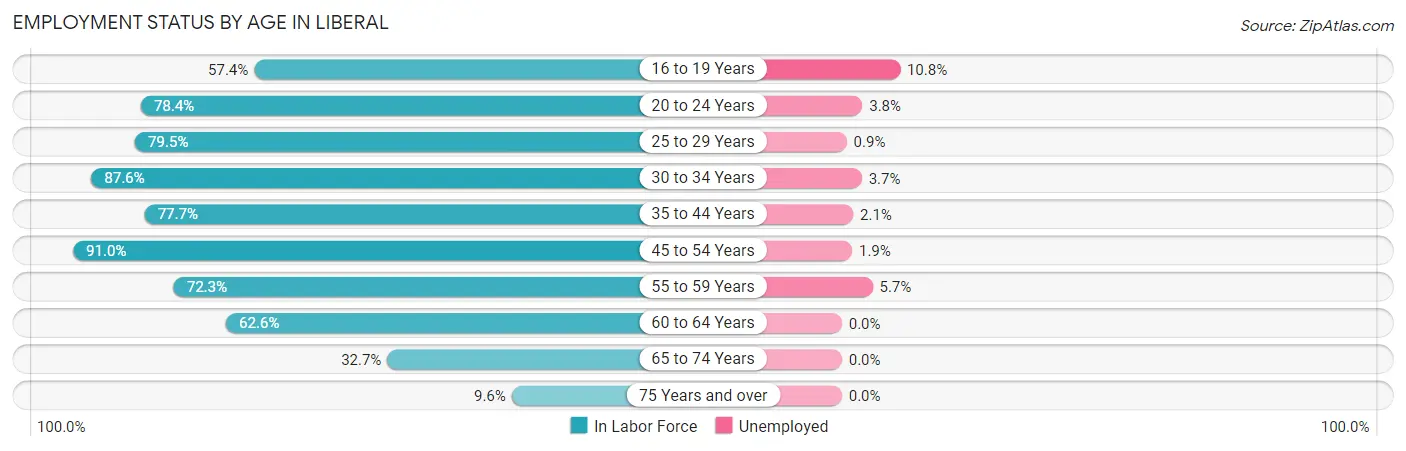
| Age Bracket | In Labor Force | Unemployed |
| 16 to 19 Years | 556 (57.4%) | 60 (10.8%) |
| 20 to 24 Years | 1,203 (78.4%) | 46 (3.8%) |
| 25 to 29 Years | 1,112 (79.5%) | 10 (0.9%) |
| 30 to 34 Years | 1,272 (87.6%) | 47 (3.7%) |
| 35 to 44 Years | 1,854 (77.7%) | 39 (2.1%) |
| 45 to 54 Years | 1,905 (91.0%) | 36 (1.9%) |
| 55 to 59 Years | 421 (72.3%) | 24 (5.7%) |
| 60 to 64 Years | 849 (62.6%) | 0 (0.0%) |
| 65 to 74 Years | 326 (32.7%) | 0 (0.0%) |
| 75 Years and over | 79 (9.6%) | 0 (0.0%) |
| Total | 9,583 (70.5%) | 259 (2.7%) |
Employment Status by Educational Attainment in Liberal
According to labor force statistics for Liberal, 80.0% of individuals (7,415) out of the total population between 25 and 64 years of age (9,269) are in the labor force, with 2.1% or 156 of them being unemployed. The group with the highest labor force participation rate are those with the educational attainment of college / associate degree, with 84.1% or 2,102 individuals in the labor force. Within the labor force, individuals with less than high school education have the highest percentage of unemployment, with 5.1% or 114 of them being unemployed.
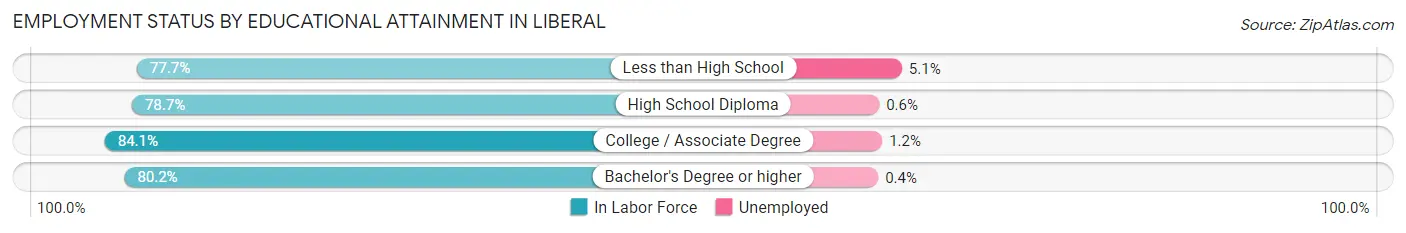
| Educational Attainment | In Labor Force | Unemployed |
| Less than High School | 2,232 (77.7%) | 147 (5.1%) |
| High School Diploma | 2,374 (78.7%) | 18 (0.6%) |
| College / Associate Degree | 2,102 (84.1%) | 30 (1.2%) |
| Bachelor's Degree or higher | 706 (80.2%) | 4 (0.4%) |
| Total | 7,415 (80.0%) | 195 (2.1%) |
Employment Occupations by Sex in Liberal
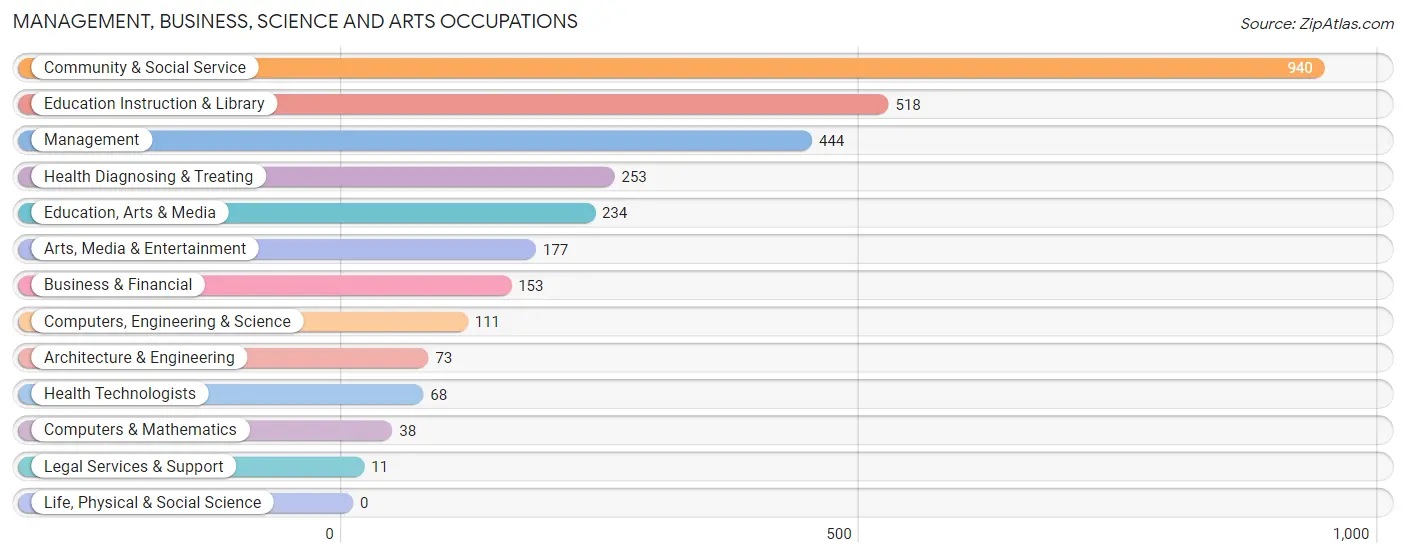
Management, Business, Science and Arts Occupations
The most common Management, Business, Science and Arts occupations in Liberal are Community & Social Service (940 | 10.1%), Education Instruction & Library (518 | 5.6%), Management (444 | 4.8%), Health Diagnosing & Treating (253 | 2.7%), and Education, Arts & Media (234 | 2.5%).
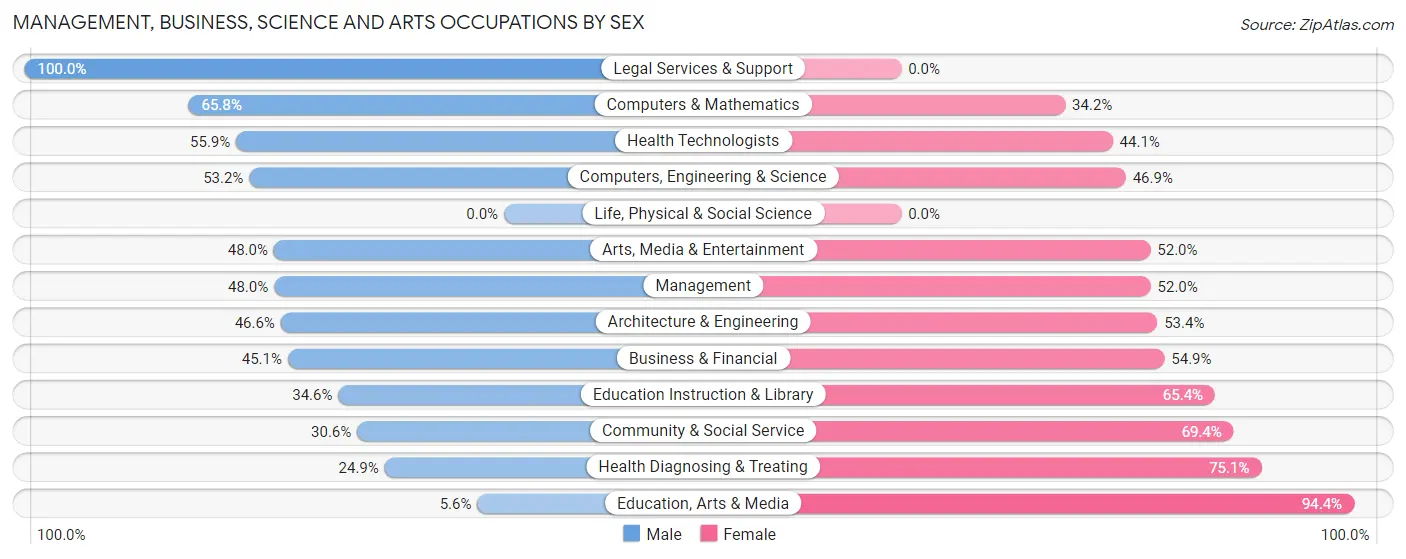
Management, Business, Science and Arts Occupations by Sex
Within the Management, Business, Science and Arts occupations in Liberal, the most male-oriented occupations are Legal Services & Support (100.0%), Computers & Mathematics (65.8%), and Health Technologists (55.9%), while the most female-oriented occupations are Education, Arts & Media (94.4%), Health Diagnosing & Treating (75.1%), and Community & Social Service (69.4%).
| Occupation | Male | Female |
| Management | 213 (48.0%) | 231 (52.0%) |
| Business & Financial | 69 (45.1%) | 84 (54.9%) |
| Computers, Engineering & Science | 59 (53.1%) | 52 (46.9%) |
| Computers & Mathematics | 25 (65.8%) | 13 (34.2%) |
| Architecture & Engineering | 34 (46.6%) | 39 (53.4%) |
| Life, Physical & Social Science | 0 (0.0%) | 0 (0.0%) |
| Community & Social Service | 288 (30.6%) | 652 (69.4%) |
| Education, Arts & Media | 13 (5.6%) | 221 (94.4%) |
| Legal Services & Support | 11 (100.0%) | 0 (0.0%) |
| Education Instruction & Library | 179 (34.6%) | 339 (65.4%) |
| Arts, Media & Entertainment | 85 (48.0%) | 92 (52.0%) |
| Health Diagnosing & Treating | 63 (24.9%) | 190 (75.1%) |
| Health Technologists | 38 (55.9%) | 30 (44.1%) |
| Total (Category) | 692 (36.4%) | 1,209 (63.6%) |
| Total (Overall) | 5,175 (55.6%) | 4,140 (44.4%) |
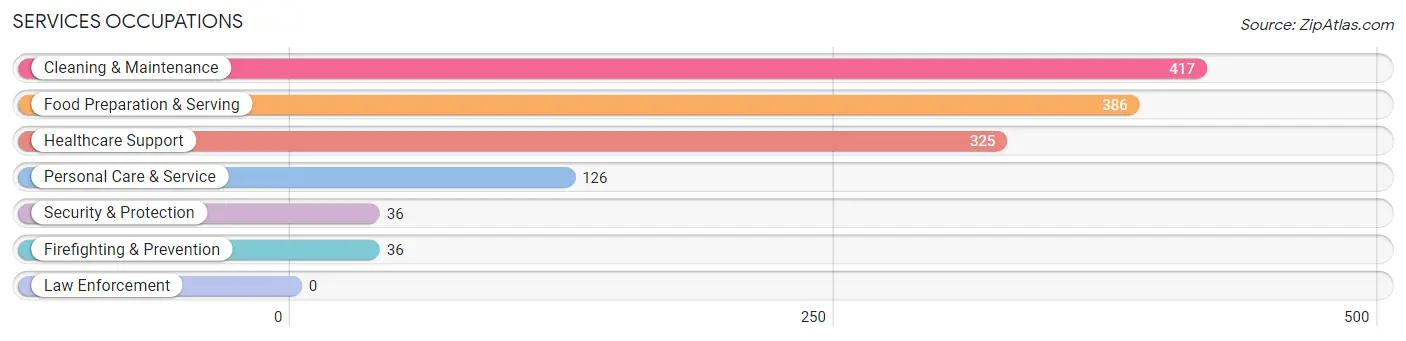
Services Occupations
The most common Services occupations in Liberal are Cleaning & Maintenance (417 | 4.5%), Food Preparation & Serving (386 | 4.1%), Healthcare Support (325 | 3.5%), Personal Care & Service (126 | 1.3%), and Security & Protection (36 | 0.4%).
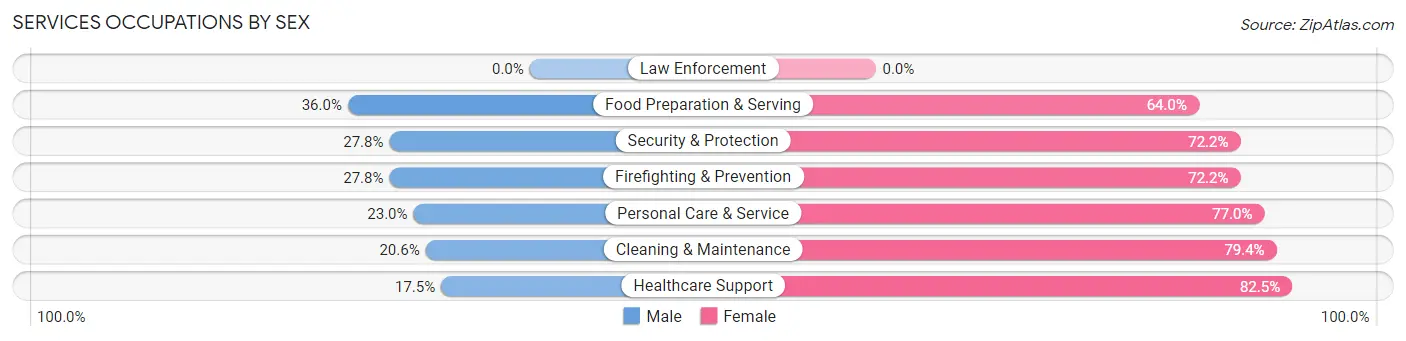
Services Occupations by Sex
Within the Services occupations in Liberal, the most male-oriented occupations are Food Preparation & Serving (36.0%), Security & Protection (27.8%), and Firefighting & Prevention (27.8%), while the most female-oriented occupations are Healthcare Support (82.5%), Cleaning & Maintenance (79.4%), and Personal Care & Service (77.0%).
| Occupation | Male | Female |
| Healthcare Support | 57 (17.5%) | 268 (82.5%) |
| Security & Protection | 10 (27.8%) | 26 (72.2%) |
| Firefighting & Prevention | 10 (27.8%) | 26 (72.2%) |
| Law Enforcement | 0 (0.0%) | 0 (0.0%) |
| Food Preparation & Serving | 139 (36.0%) | 247 (64.0%) |
| Cleaning & Maintenance | 86 (20.6%) | 331 (79.4%) |
| Personal Care & Service | 29 (23.0%) | 97 (77.0%) |
| Total (Category) | 321 (24.9%) | 969 (75.1%) |
| Total (Overall) | 5,175 (55.6%) | 4,140 (44.4%) |
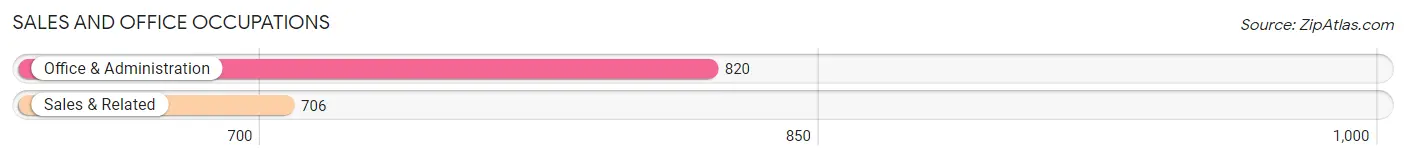
Sales and Office Occupations
The most common Sales and Office occupations in Liberal are Office & Administration (820 | 8.8%), and Sales & Related (706 | 7.6%).
Sales and Office Occupations by Sex
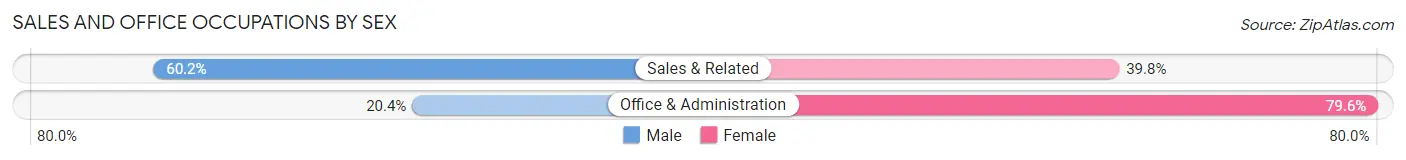
| Occupation | Male | Female |
| Sales & Related | 425 (60.2%) | 281 (39.8%) |
| Office & Administration | 167 (20.4%) | 653 (79.6%) |
| Total (Category) | 592 (38.8%) | 934 (61.2%) |
| Total (Overall) | 5,175 (55.6%) | 4,140 (44.4%) |
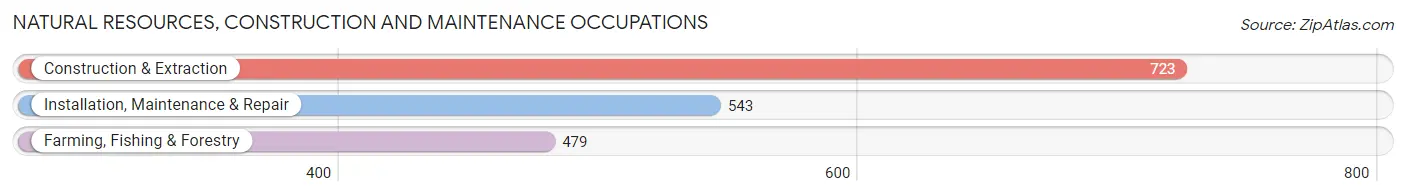
Natural Resources, Construction and Maintenance Occupations
The most common Natural Resources, Construction and Maintenance occupations in Liberal are Construction & Extraction (723 | 7.8%), Installation, Maintenance & Repair (543 | 5.8%), and Farming, Fishing & Forestry (479 | 5.1%).
Natural Resources, Construction and Maintenance Occupations by Sex
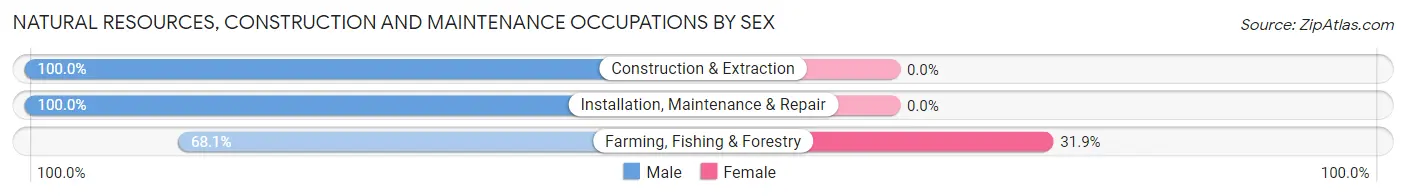
| Occupation | Male | Female |
| Farming, Fishing & Forestry | 326 (68.1%) | 153 (31.9%) |
| Construction & Extraction | 723 (100.0%) | 0 (0.0%) |
| Installation, Maintenance & Repair | 543 (100.0%) | 0 (0.0%) |
| Total (Category) | 1,592 (91.2%) | 153 (8.8%) |
| Total (Overall) | 5,175 (55.6%) | 4,140 (44.4%) |
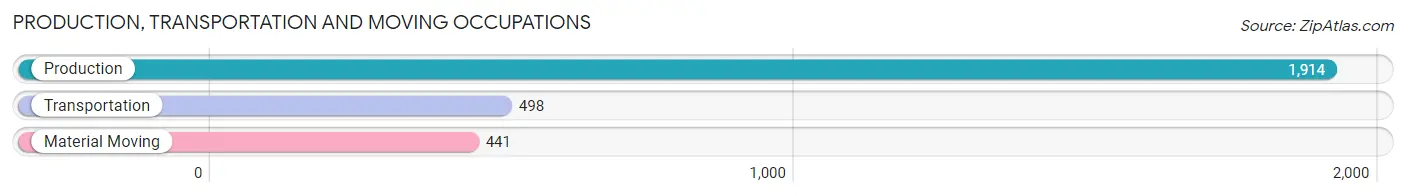
Production, Transportation and Moving Occupations
The most common Production, Transportation and Moving occupations in Liberal are Production (1,914 | 20.5%), Transportation (498 | 5.3%), and Material Moving (441 | 4.7%).
Production, Transportation and Moving Occupations by Sex
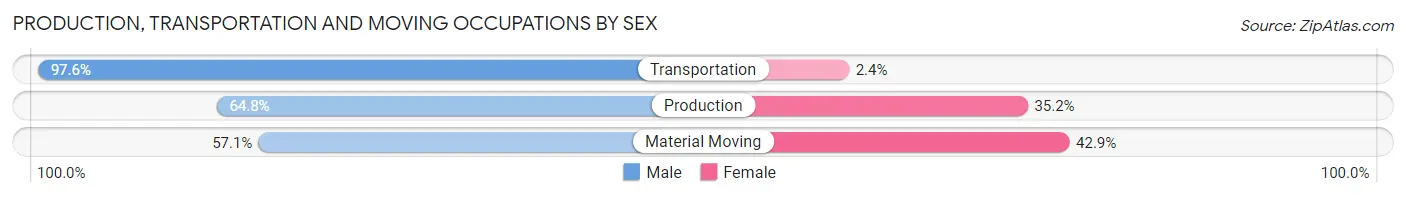
| Occupation | Male | Female |
| Production | 1,240 (64.8%) | 674 (35.2%) |
| Transportation | 486 (97.6%) | 12 (2.4%) |
| Material Moving | 252 (57.1%) | 189 (42.9%) |
| Total (Category) | 1,978 (69.3%) | 875 (30.7%) |
| Total (Overall) | 5,175 (55.6%) | 4,140 (44.4%) |
Employment Industries by Sex in Liberal
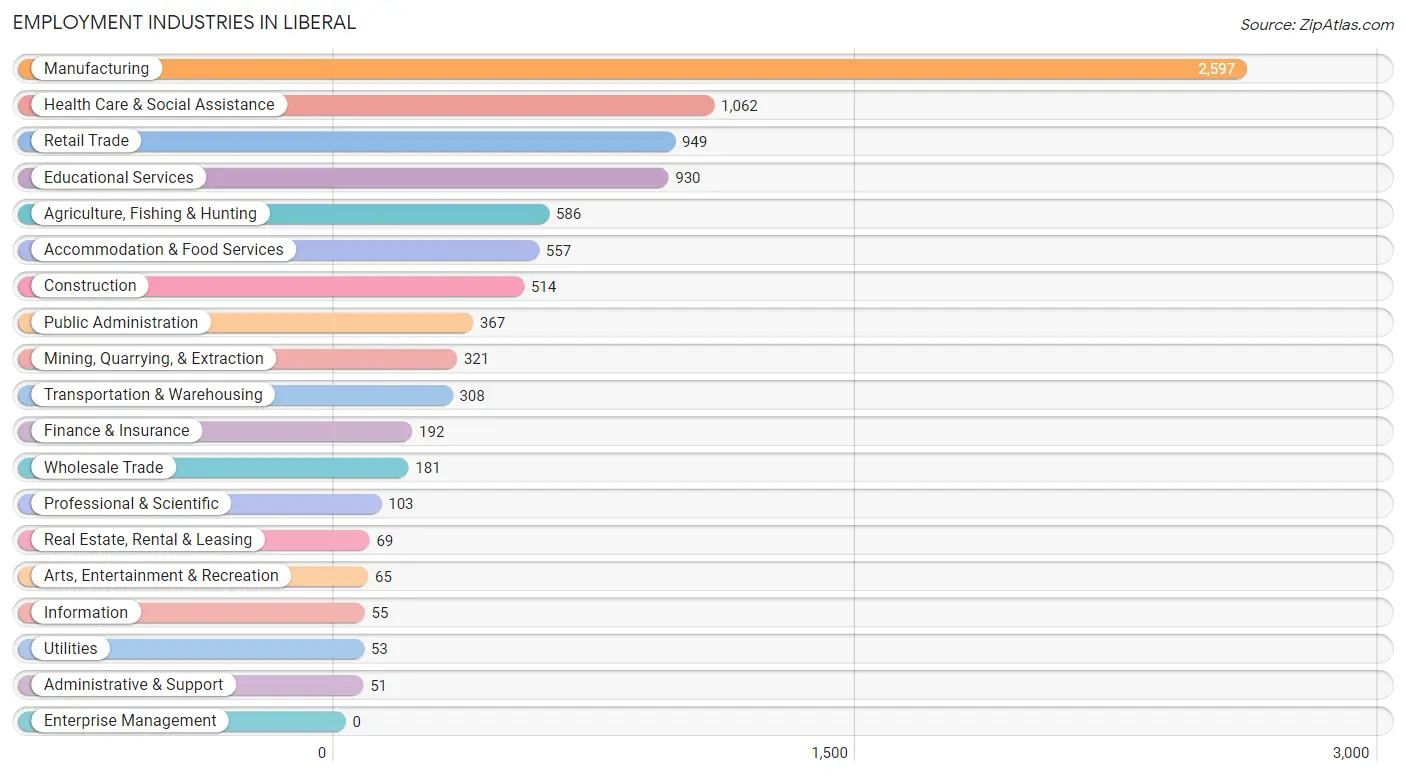
Employment Industries in Liberal
The major employment industries in Liberal include Manufacturing (2,597 | 27.9%), Health Care & Social Assistance (1,062 | 11.4%), Retail Trade (949 | 10.2%), Educational Services (930 | 10.0%), and Agriculture, Fishing & Hunting (586 | 6.3%).
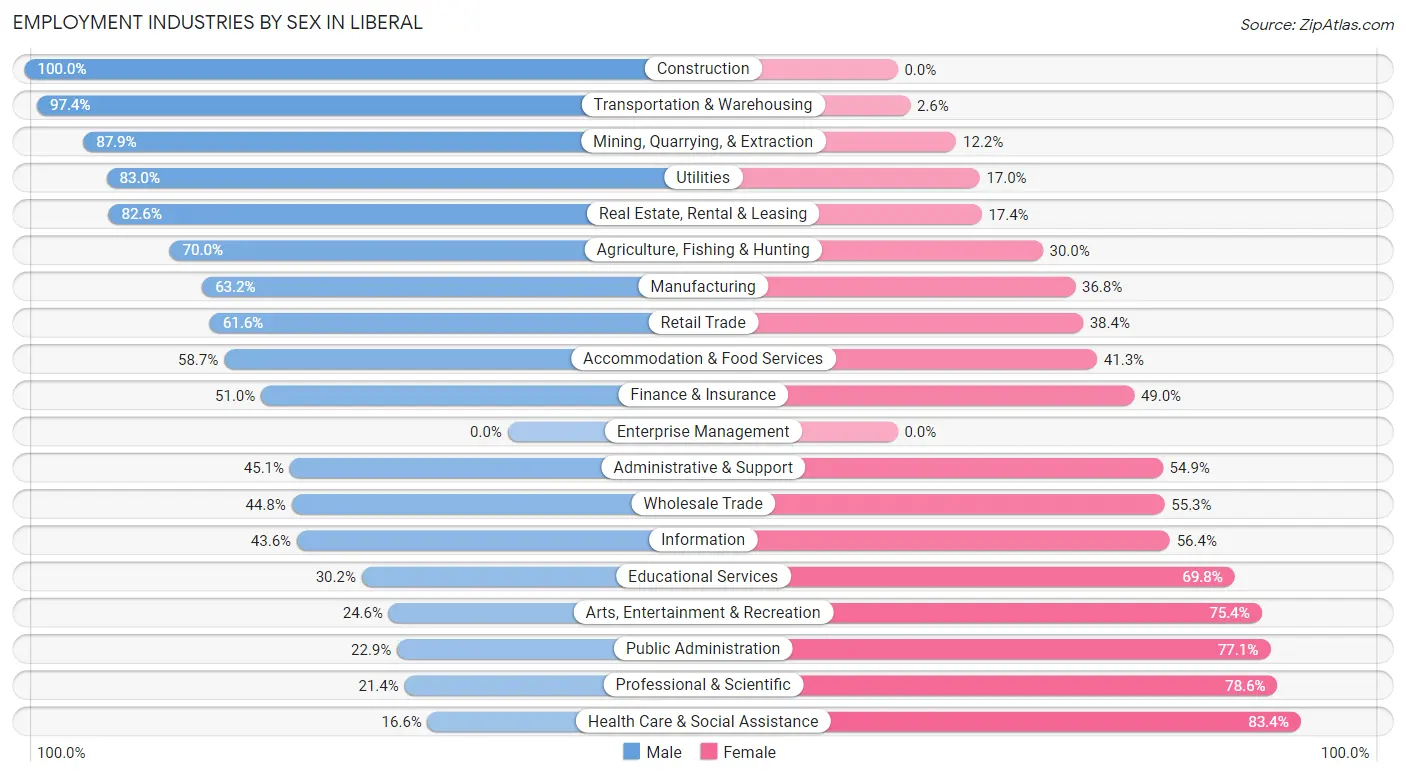
Employment Industries by Sex in Liberal
The Liberal industries that see more men than women are Construction (100.0%), Transportation & Warehousing (97.4%), and Mining, Quarrying, & Extraction (87.8%), whereas the industries that tend to have a higher number of women are Health Care & Social Assistance (83.4%), Professional & Scientific (78.6%), and Public Administration (77.1%).
| Industry | Male | Female |
| Agriculture, Fishing & Hunting | 410 (70.0%) | 176 (30.0%) |
| Mining, Quarrying, & Extraction | 282 (87.8%) | 39 (12.1%) |
| Construction | 514 (100.0%) | 0 (0.0%) |
| Manufacturing | 1,642 (63.2%) | 955 (36.8%) |
| Wholesale Trade | 81 (44.8%) | 100 (55.2%) |
| Retail Trade | 585 (61.6%) | 364 (38.4%) |
| Transportation & Warehousing | 300 (97.4%) | 8 (2.6%) |
| Utilities | 44 (83.0%) | 9 (17.0%) |
| Information | 24 (43.6%) | 31 (56.4%) |
| Finance & Insurance | 98 (51.0%) | 94 (49.0%) |
| Real Estate, Rental & Leasing | 57 (82.6%) | 12 (17.4%) |
| Professional & Scientific | 22 (21.4%) | 81 (78.6%) |
| Enterprise Management | 0 (0.0%) | 0 (0.0%) |
| Administrative & Support | 23 (45.1%) | 28 (54.9%) |
| Educational Services | 281 (30.2%) | 649 (69.8%) |
| Health Care & Social Assistance | 176 (16.6%) | 886 (83.4%) |
| Arts, Entertainment & Recreation | 16 (24.6%) | 49 (75.4%) |
| Accommodation & Food Services | 327 (58.7%) | 230 (41.3%) |
| Public Administration | 84 (22.9%) | 283 (77.1%) |
| Total | 5,175 (55.6%) | 4,140 (44.4%) |
Education in Liberal
School Enrollment in Liberal
The most common levels of schooling among the 5,388 students in Liberal are elementary school (1,420 | 26.4%), middle school (1,327 | 24.6%), and high school (944 | 17.5%).
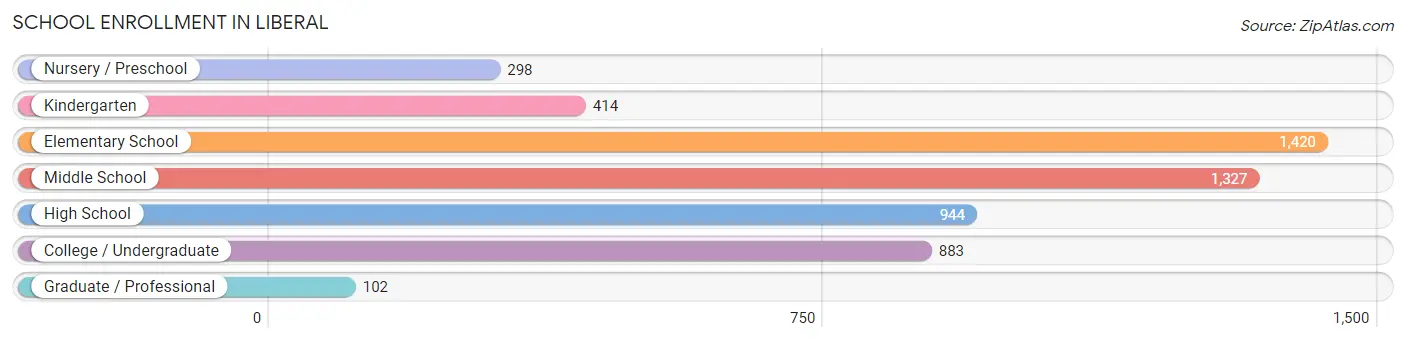
| School Level | # Students | % Students |
| Nursery / Preschool | 298 | 5.5% |
| Kindergarten | 414 | 7.7% |
| Elementary School | 1,420 | 26.4% |
| Middle School | 1,327 | 24.6% |
| High School | 944 | 17.5% |
| College / Undergraduate | 883 | 16.4% |
| Graduate / Professional | 102 | 1.9% |
| Total | 5,388 | 100.0% |
School Enrollment by Age by Funding Source in Liberal
Out of a total of 5,388 students who are enrolled in schools in Liberal, 113 (2.1%) attend a private institution, while the remaining 5,275 (97.9%) are enrolled in public schools. The age group of 25 to 34 year olds has the highest likelihood of being enrolled in private schools, with 41 (25.3% in the age bracket) enrolled. Conversely, the age group of 3 to 4 year olds has the lowest likelihood of being enrolled in a private school, with 230 (100.0% in the age bracket) attending a public institution.
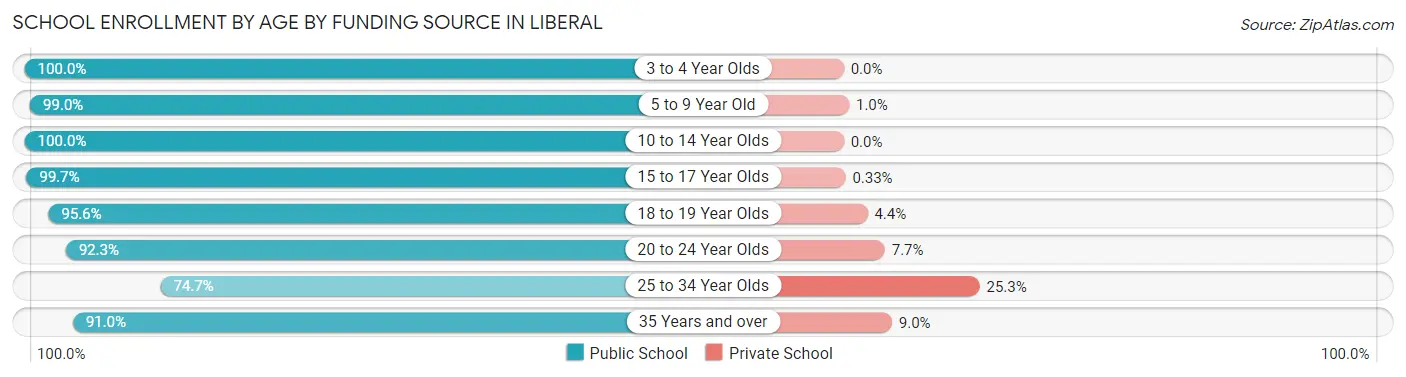
| Age Bracket | Public School | Private School |
| 3 to 4 Year Olds | 230 (100.0%) | 0 (0.0%) |
| 5 to 9 Year Old | 1,676 (99.0%) | 17 (1.0%) |
| 10 to 14 Year Olds | 1,558 (100.0%) | 0 (0.0%) |
| 15 to 17 Year Olds | 917 (99.7%) | 3 (0.3%) |
| 18 to 19 Year Olds | 302 (95.6%) | 14 (4.4%) |
| 20 to 24 Year Olds | 398 (92.3%) | 33 (7.7%) |
| 25 to 34 Year Olds | 121 (74.7%) | 41 (25.3%) |
| 35 Years and over | 71 (91.0%) | 7 (9.0%) |
| Total | 5,275 (97.9%) | 113 (2.1%) |
Educational Attainment by Field of Study in Liberal
Education (224 | 20.9%), social sciences (180 | 16.8%), business (168 | 15.7%), literature & languages (114 | 10.7%), and science & technology (107 | 10.0%) are the most common fields of study among 1,069 individuals in Liberal who have obtained a bachelor's degree or higher.
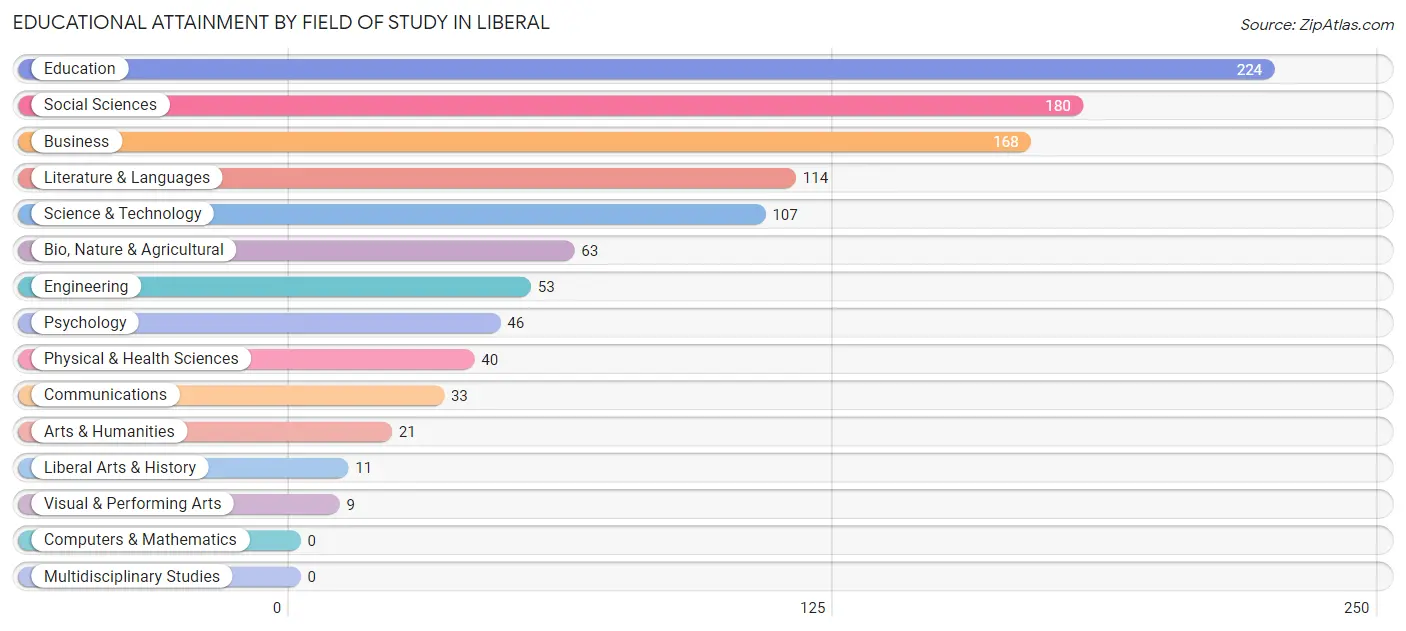
| Field of Study | # Graduates | % Graduates |
| Computers & Mathematics | 0 | 0.0% |
| Bio, Nature & Agricultural | 63 | 5.9% |
| Physical & Health Sciences | 40 | 3.7% |
| Psychology | 46 | 4.3% |
| Social Sciences | 180 | 16.8% |
| Engineering | 53 | 5.0% |
| Multidisciplinary Studies | 0 | 0.0% |
| Science & Technology | 107 | 10.0% |
| Business | 168 | 15.7% |
| Education | 224 | 20.9% |
| Literature & Languages | 114 | 10.7% |
| Liberal Arts & History | 11 | 1.0% |
| Visual & Performing Arts | 9 | 0.8% |
| Communications | 33 | 3.1% |
| Arts & Humanities | 21 | 2.0% |
| Total | 1,069 | 100.0% |
Transportation & Commute in Liberal
Vehicle Availability by Sex in Liberal
The most prevalent vehicle ownership categories in Liberal are males with 2 vehicles (1,804, accounting for 35.8%) and females with 2 vehicles (1,343, making up 46.5%).
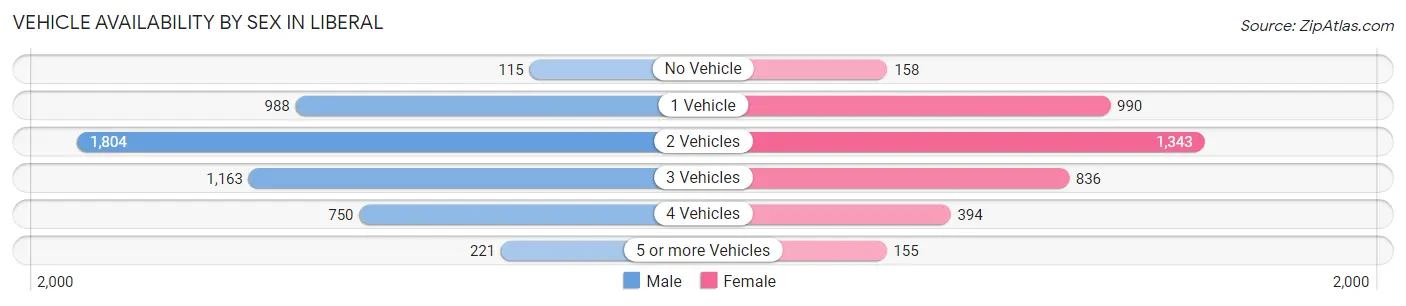
| Vehicles Available | Male | Female |
| No Vehicle | 115 (2.3%) | 158 (4.1%) |
| 1 Vehicle | 988 (19.6%) | 990 (25.5%) |
| 2 Vehicles | 1,804 (35.8%) | 1,343 (34.6%) |
| 3 Vehicles | 1,163 (23.1%) | 836 (21.6%) |
| 4 Vehicles | 750 (14.9%) | 394 (10.2%) |
| 5 or more Vehicles | 221 (4.4%) | 155 (4.0%) |
| Total | 5,041 (100.0%) | 3,876 (100.0%) |
Commute Time in Liberal
The most frequently occuring commute durations in Liberal are 5 to 9 minutes (2,920 commuters, 33.3%), 10 to 14 minutes (2,593 commuters, 29.5%), and 15 to 19 minutes (1,421 commuters, 16.2%).
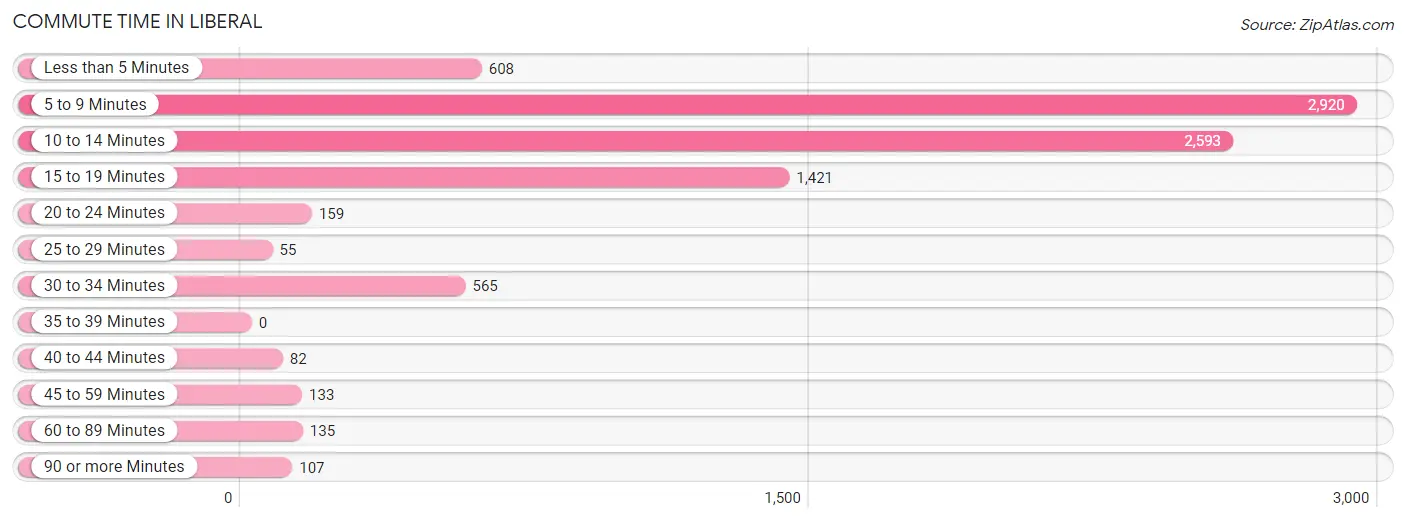
| Commute Time | # Commuters | % Commuters |
| Less than 5 Minutes | 608 | 6.9% |
| 5 to 9 Minutes | 2,920 | 33.3% |
| 10 to 14 Minutes | 2,593 | 29.5% |
| 15 to 19 Minutes | 1,421 | 16.2% |
| 20 to 24 Minutes | 159 | 1.8% |
| 25 to 29 Minutes | 55 | 0.6% |
| 30 to 34 Minutes | 565 | 6.4% |
| 35 to 39 Minutes | 0 | 0.0% |
| 40 to 44 Minutes | 82 | 0.9% |
| 45 to 59 Minutes | 133 | 1.5% |
| 60 to 89 Minutes | 135 | 1.5% |
| 90 or more Minutes | 107 | 1.2% |
Commute Time by Sex in Liberal
The most common commute times in Liberal are 10 to 14 minutes (1,510 commuters, 29.7%) for males and 5 to 9 minutes (1,558 commuters, 42.1%) for females.
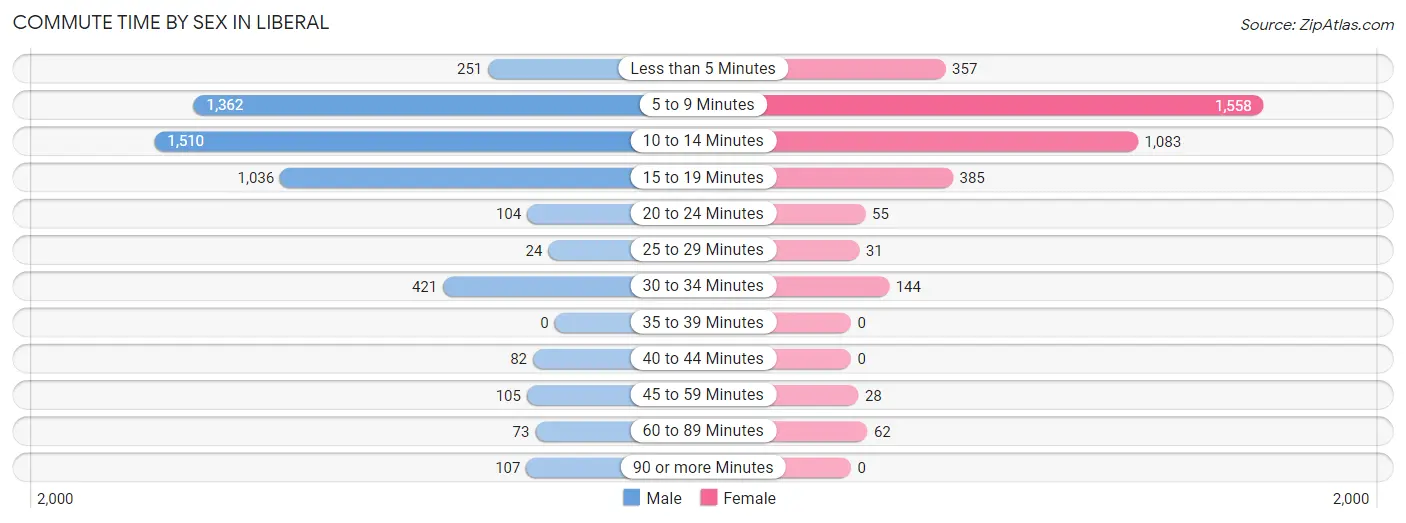
| Commute Time | Male | Female |
| Less than 5 Minutes | 251 (5.0%) | 357 (9.6%) |
| 5 to 9 Minutes | 1,362 (26.8%) | 1,558 (42.1%) |
| 10 to 14 Minutes | 1,510 (29.7%) | 1,083 (29.2%) |
| 15 to 19 Minutes | 1,036 (20.4%) | 385 (10.4%) |
| 20 to 24 Minutes | 104 (2.1%) | 55 (1.5%) |
| 25 to 29 Minutes | 24 (0.5%) | 31 (0.8%) |
| 30 to 34 Minutes | 421 (8.3%) | 144 (3.9%) |
| 35 to 39 Minutes | 0 (0.0%) | 0 (0.0%) |
| 40 to 44 Minutes | 82 (1.6%) | 0 (0.0%) |
| 45 to 59 Minutes | 105 (2.1%) | 28 (0.8%) |
| 60 to 89 Minutes | 73 (1.4%) | 62 (1.7%) |
| 90 or more Minutes | 107 (2.1%) | 0 (0.0%) |
Time of Departure to Work by Sex in Liberal
The most frequent times of departure to work in Liberal are 6:00 AM to 6:29 AM (694, 13.7%) for males and 7:30 AM to 7:59 AM (714, 19.3%) for females.
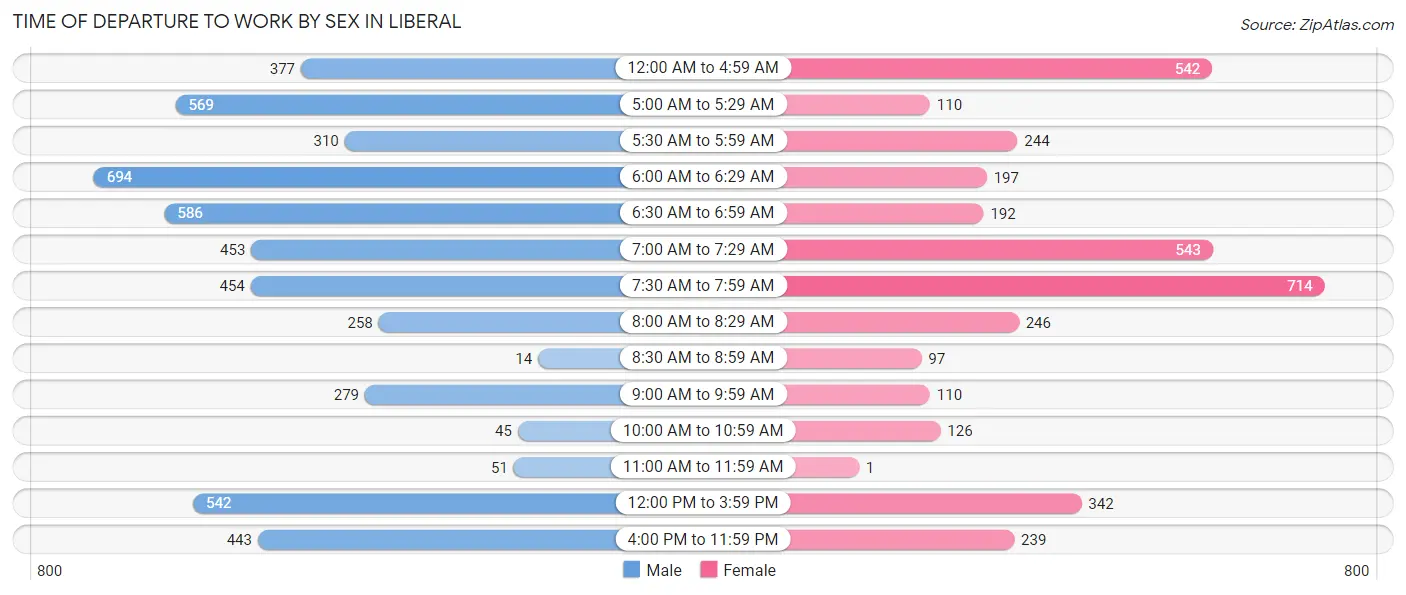
| Time of Departure | Male | Female |
| 12:00 AM to 4:59 AM | 377 (7.4%) | 542 (14.6%) |
| 5:00 AM to 5:29 AM | 569 (11.2%) | 110 (3.0%) |
| 5:30 AM to 5:59 AM | 310 (6.1%) | 244 (6.6%) |
| 6:00 AM to 6:29 AM | 694 (13.7%) | 197 (5.3%) |
| 6:30 AM to 6:59 AM | 586 (11.6%) | 192 (5.2%) |
| 7:00 AM to 7:29 AM | 453 (8.9%) | 543 (14.7%) |
| 7:30 AM to 7:59 AM | 454 (8.9%) | 714 (19.3%) |
| 8:00 AM to 8:29 AM | 258 (5.1%) | 246 (6.6%) |
| 8:30 AM to 8:59 AM | 14 (0.3%) | 97 (2.6%) |
| 9:00 AM to 9:59 AM | 279 (5.5%) | 110 (3.0%) |
| 10:00 AM to 10:59 AM | 45 (0.9%) | 126 (3.4%) |
| 11:00 AM to 11:59 AM | 51 (1.0%) | 1 (0.0%) |
| 12:00 PM to 3:59 PM | 542 (10.7%) | 342 (9.2%) |
| 4:00 PM to 11:59 PM | 443 (8.7%) | 239 (6.5%) |
| Total | 5,075 (100.0%) | 3,703 (100.0%) |
Housing Occupancy in Liberal
Occupancy by Ownership in Liberal
Of the total 6,224 dwellings in Liberal, owner-occupied units account for 3,891 (62.5%), while renter-occupied units make up 2,333 (37.5%).
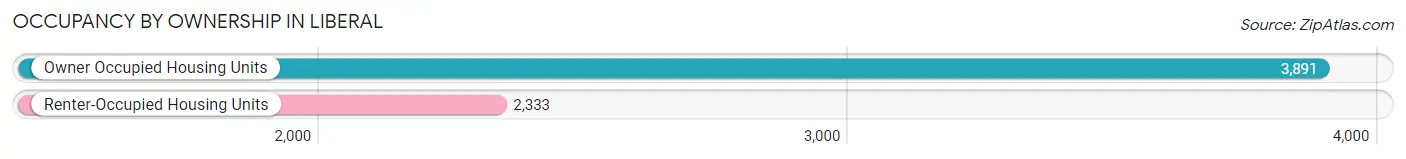
| Occupancy | # Housing Units | % Housing Units |
| Owner Occupied Housing Units | 3,891 | 62.5% |
| Renter-Occupied Housing Units | 2,333 | 37.5% |
| Total Occupied Housing Units | 6,224 | 100.0% |
Occupancy by Household Size in Liberal
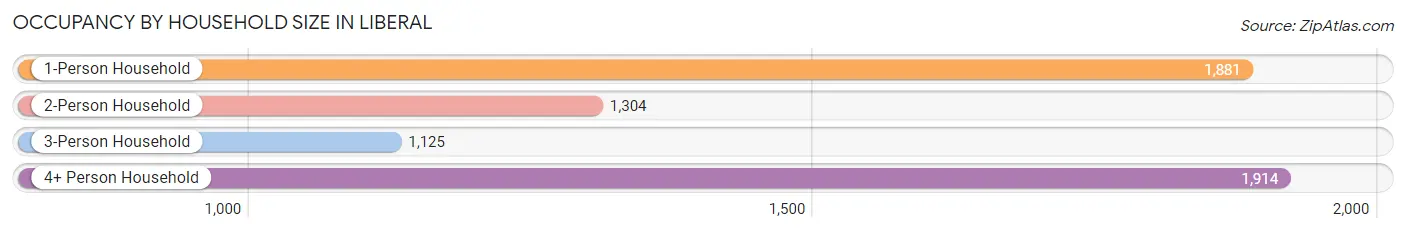
| Household Size | # Housing Units | % Housing Units |
| 1-Person Household | 1,881 | 30.2% |
| 2-Person Household | 1,304 | 20.9% |
| 3-Person Household | 1,125 | 18.1% |
| 4+ Person Household | 1,914 | 30.7% |
| Total Housing Units | 6,224 | 100.0% |
Occupancy by Ownership by Household Size in Liberal
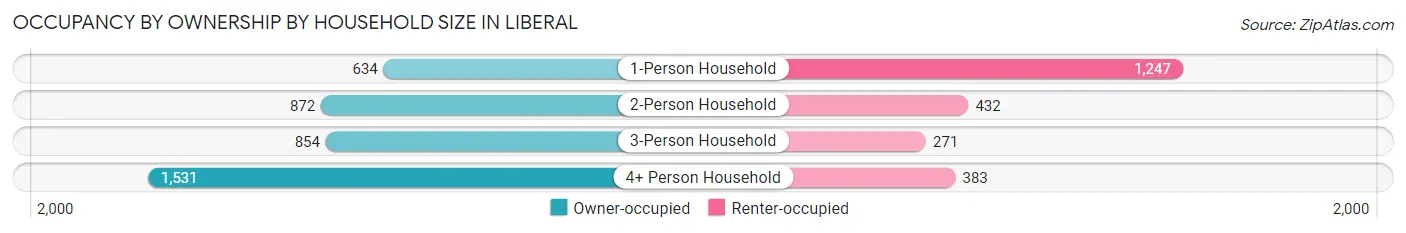
| Household Size | Owner-occupied | Renter-occupied |
| 1-Person Household | 634 (33.7%) | 1,247 (66.3%) |
| 2-Person Household | 872 (66.9%) | 432 (33.1%) |
| 3-Person Household | 854 (75.9%) | 271 (24.1%) |
| 4+ Person Household | 1,531 (80.0%) | 383 (20.0%) |
| Total Housing Units | 3,891 (62.5%) | 2,333 (37.5%) |
Occupancy by Educational Attainment in Liberal
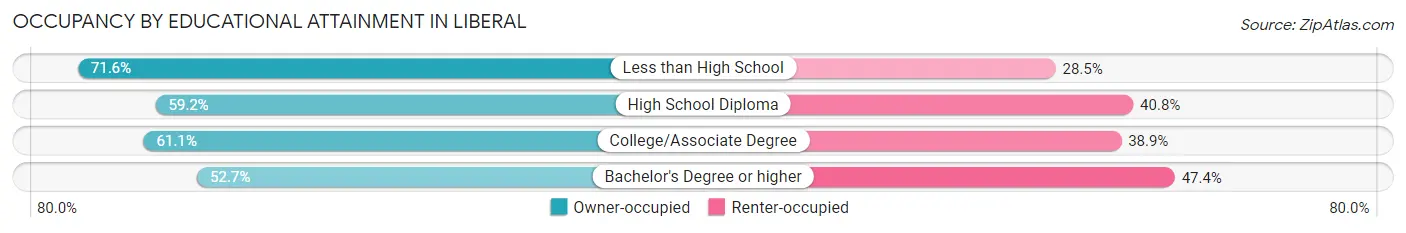
| Household Size | Owner-occupied | Renter-occupied |
| Less than High School | 1,217 (71.6%) | 484 (28.4%) |
| High School Diploma | 1,045 (59.2%) | 719 (40.8%) |
| College/Associate Degree | 1,271 (61.1%) | 808 (38.9%) |
| Bachelor's Degree or higher | 358 (52.6%) | 322 (47.3%) |
Occupancy by Age of Householder in Liberal
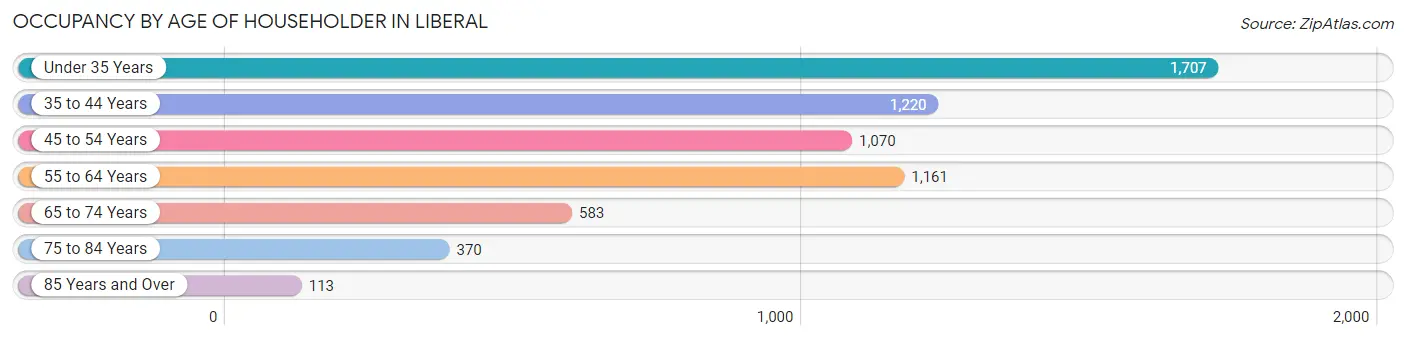
| Age Bracket | # Households | % Households |
| Under 35 Years | 1,707 | 27.4% |
| 35 to 44 Years | 1,220 | 19.6% |
| 45 to 54 Years | 1,070 | 17.2% |
| 55 to 64 Years | 1,161 | 18.6% |
| 65 to 74 Years | 583 | 9.4% |
| 75 to 84 Years | 370 | 5.9% |
| 85 Years and Over | 113 | 1.8% |
| Total | 6,224 | 100.0% |
Housing Finances in Liberal
Median Income by Occupancy in Liberal
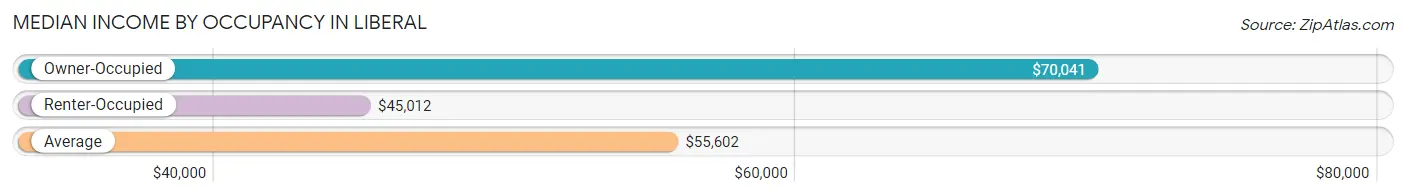
| Occupancy Type | # Households | Median Income |
| Owner-Occupied | 3,891 (62.5%) | $70,041 |
| Renter-Occupied | 2,333 (37.5%) | $45,012 |
| Average | 6,224 (100.0%) | $55,602 |
Occupancy by Householder Income Bracket in Liberal
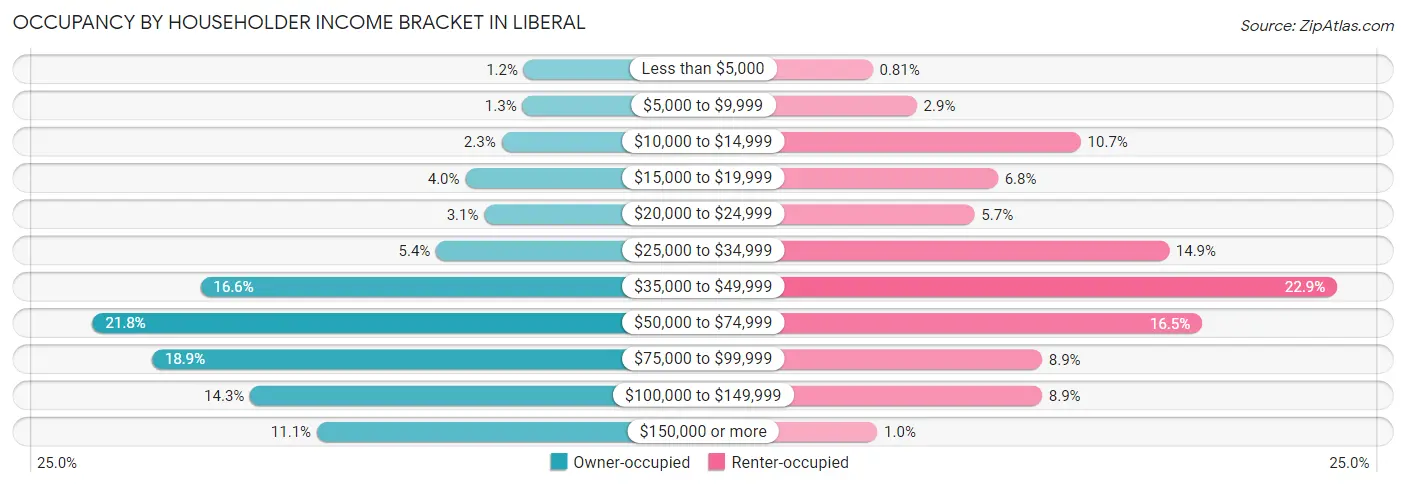
| Income Bracket | Owner-occupied | Renter-occupied |
| Less than $5,000 | 48 (1.2%) | 19 (0.8%) |
| $5,000 to $9,999 | 50 (1.3%) | 68 (2.9%) |
| $10,000 to $14,999 | 89 (2.3%) | 250 (10.7%) |
| $15,000 to $19,999 | 156 (4.0%) | 158 (6.8%) |
| $20,000 to $24,999 | 121 (3.1%) | 132 (5.7%) |
| $25,000 to $34,999 | 210 (5.4%) | 348 (14.9%) |
| $35,000 to $49,999 | 647 (16.6%) | 535 (22.9%) |
| $50,000 to $74,999 | 847 (21.8%) | 385 (16.5%) |
| $75,000 to $99,999 | 737 (18.9%) | 207 (8.9%) |
| $100,000 to $149,999 | 555 (14.3%) | 207 (8.9%) |
| $150,000 or more | 431 (11.1%) | 24 (1.0%) |
| Total | 3,891 (100.0%) | 2,333 (100.0%) |
Monthly Housing Cost Tiers in Liberal
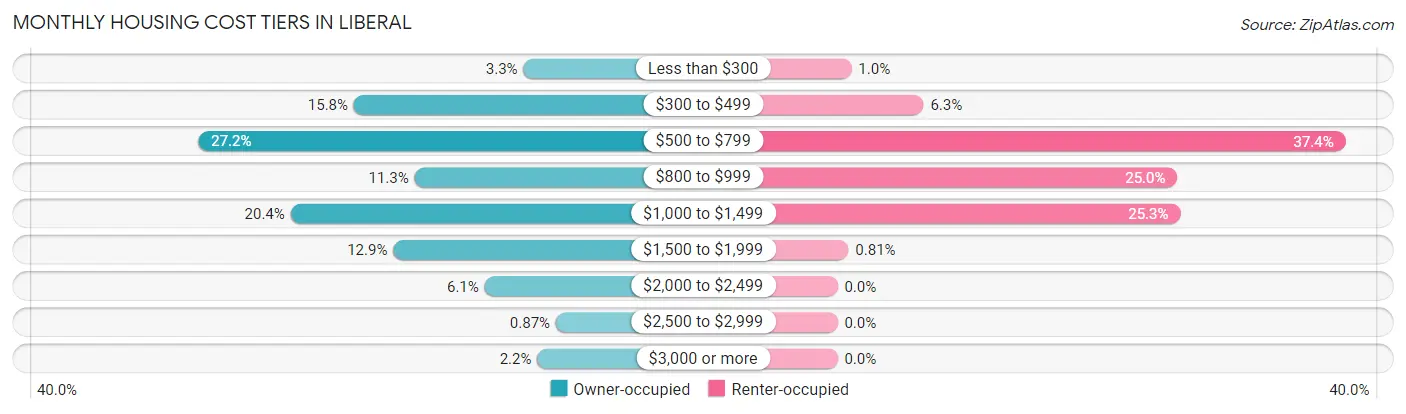
| Monthly Cost | Owner-occupied | Renter-occupied |
| Less than $300 | 127 (3.3%) | 24 (1.0%) |
| $300 to $499 | 613 (15.8%) | 148 (6.3%) |
| $500 to $799 | 1,059 (27.2%) | 873 (37.4%) |
| $800 to $999 | 439 (11.3%) | 584 (25.0%) |
| $1,000 to $1,499 | 794 (20.4%) | 589 (25.3%) |
| $1,500 to $1,999 | 500 (12.9%) | 19 (0.8%) |
| $2,000 to $2,499 | 238 (6.1%) | 0 (0.0%) |
| $2,500 to $2,999 | 34 (0.9%) | 0 (0.0%) |
| $3,000 or more | 87 (2.2%) | 0 (0.0%) |
| Total | 3,891 (100.0%) | 2,333 (100.0%) |
Physical Housing Characteristics in Liberal
Housing Structures in Liberal
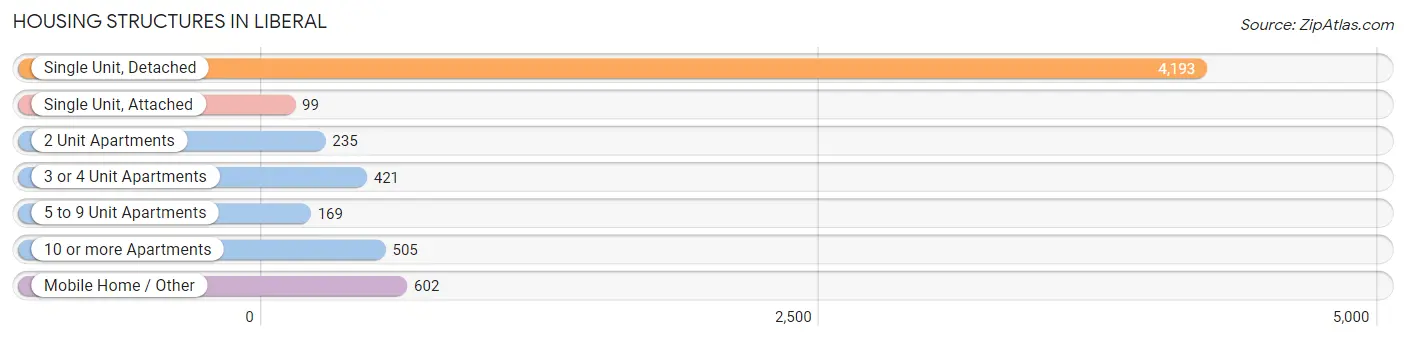
| Structure Type | # Housing Units | % Housing Units |
| Single Unit, Detached | 4,193 | 67.4% |
| Single Unit, Attached | 99 | 1.6% |
| 2 Unit Apartments | 235 | 3.8% |
| 3 or 4 Unit Apartments | 421 | 6.8% |
| 5 to 9 Unit Apartments | 169 | 2.7% |
| 10 or more Apartments | 505 | 8.1% |
| Mobile Home / Other | 602 | 9.7% |
| Total | 6,224 | 100.0% |
Housing Structures by Occupancy in Liberal
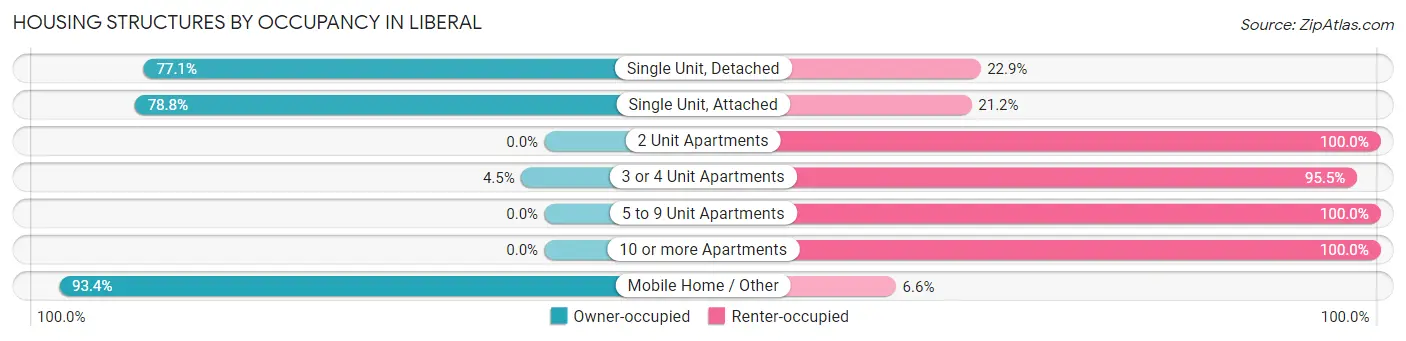
| Structure Type | Owner-occupied | Renter-occupied |
| Single Unit, Detached | 3,232 (77.1%) | 961 (22.9%) |
| Single Unit, Attached | 78 (78.8%) | 21 (21.2%) |
| 2 Unit Apartments | 0 (0.0%) | 235 (100.0%) |
| 3 or 4 Unit Apartments | 19 (4.5%) | 402 (95.5%) |
| 5 to 9 Unit Apartments | 0 (0.0%) | 169 (100.0%) |
| 10 or more Apartments | 0 (0.0%) | 505 (100.0%) |
| Mobile Home / Other | 562 (93.4%) | 40 (6.6%) |
| Total | 3,891 (62.5%) | 2,333 (37.5%) |
Housing Structures by Number of Rooms in Liberal
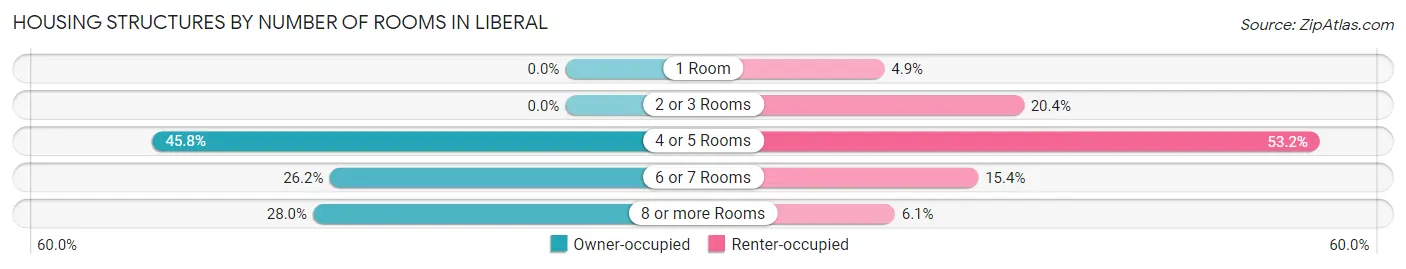
| Number of Rooms | Owner-occupied | Renter-occupied |
| 1 Room | 0 (0.0%) | 115 (4.9%) |
| 2 or 3 Rooms | 0 (0.0%) | 476 (20.4%) |
| 4 or 5 Rooms | 1,782 (45.8%) | 1,242 (53.2%) |
| 6 or 7 Rooms | 1,019 (26.2%) | 358 (15.3%) |
| 8 or more Rooms | 1,090 (28.0%) | 142 (6.1%) |
| Total | 3,891 (100.0%) | 2,333 (100.0%) |
Housing Structure by Heating Type in Liberal
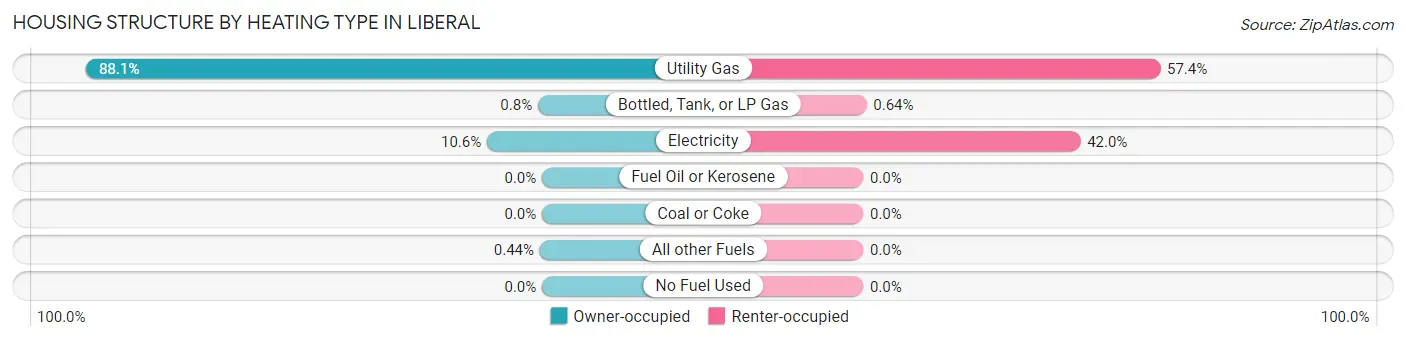
| Heating Type | Owner-occupied | Renter-occupied |
| Utility Gas | 3,429 (88.1%) | 1,339 (57.4%) |
| Bottled, Tank, or LP Gas | 31 (0.8%) | 15 (0.6%) |
| Electricity | 414 (10.6%) | 979 (42.0%) |
| Fuel Oil or Kerosene | 0 (0.0%) | 0 (0.0%) |
| Coal or Coke | 0 (0.0%) | 0 (0.0%) |
| All other Fuels | 17 (0.4%) | 0 (0.0%) |
| No Fuel Used | 0 (0.0%) | 0 (0.0%) |
| Total | 3,891 (100.0%) | 2,333 (100.0%) |
Household Vehicle Usage in Liberal
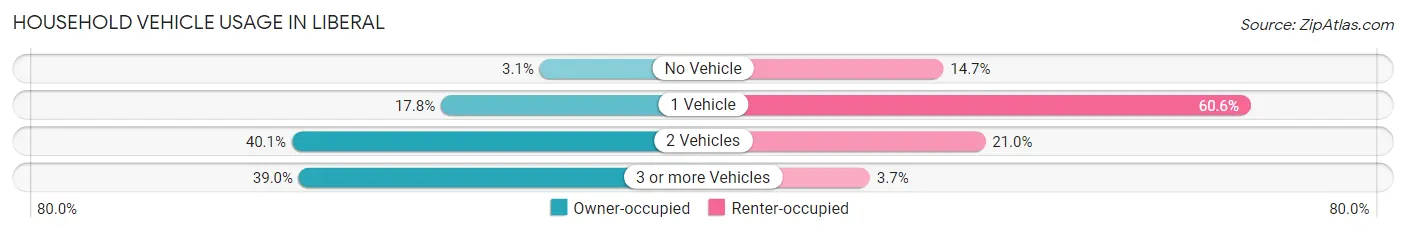
| Vehicles per Household | Owner-occupied | Renter-occupied |
| No Vehicle | 119 (3.1%) | 343 (14.7%) |
| 1 Vehicle | 693 (17.8%) | 1,414 (60.6%) |
| 2 Vehicles | 1,560 (40.1%) | 489 (21.0%) |
| 3 or more Vehicles | 1,519 (39.0%) | 87 (3.7%) |
| Total | 3,891 (100.0%) | 2,333 (100.0%) |
Real Estate & Mortgages in Liberal
Real Estate and Mortgage Overview in Liberal
| Characteristic | Without Mortgage | With Mortgage |
| Housing Units | 2,078 | 1,813 |
| Median Property Value | $102,700 | $155,700 |
| Median Household Income | $62,581 | $230 |
| Monthly Housing Costs | $564 | $87 |
| Real Estate Taxes | $1,862 | $36 |
Property Value by Mortgage Status in Liberal
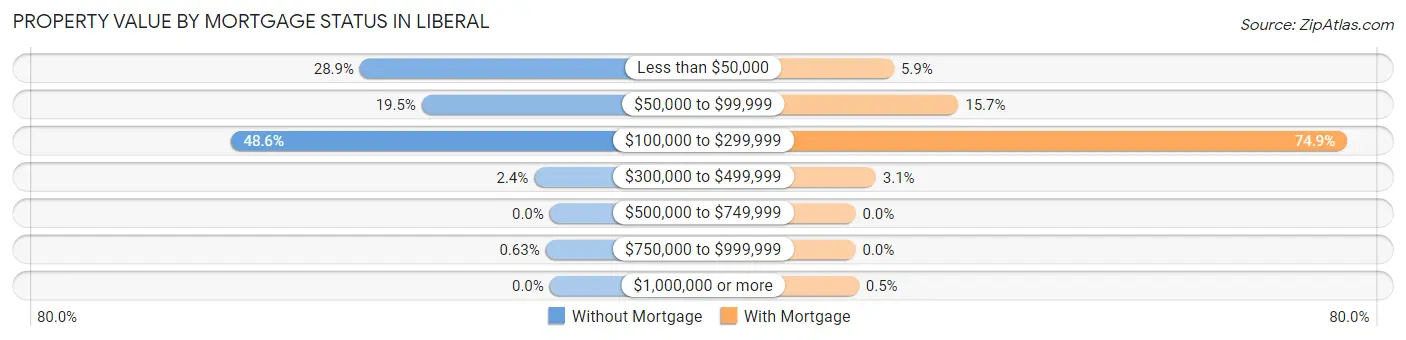
| Property Value | Without Mortgage | With Mortgage |
| Less than $50,000 | 601 (28.9%) | 106 (5.9%) |
| $50,000 to $99,999 | 405 (19.5%) | 284 (15.7%) |
| $100,000 to $299,999 | 1,010 (48.6%) | 1,358 (74.9%) |
| $300,000 to $499,999 | 49 (2.4%) | 56 (3.1%) |
| $500,000 to $749,999 | 0 (0.0%) | 0 (0.0%) |
| $750,000 to $999,999 | 13 (0.6%) | 0 (0.0%) |
| $1,000,000 or more | 0 (0.0%) | 9 (0.5%) |
| Total | 2,078 (100.0%) | 1,813 (100.0%) |
Household Income by Mortgage Status in Liberal
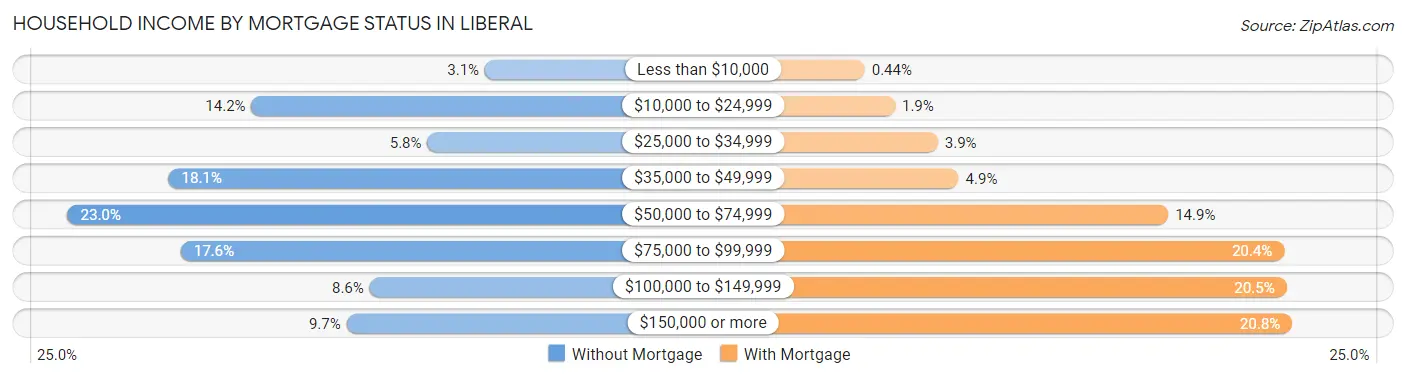
| Household Income | Without Mortgage | With Mortgage |
| Less than $10,000 | 64 (3.1%) | 8 (0.4%) |
| $10,000 to $24,999 | 295 (14.2%) | 34 (1.9%) |
| $25,000 to $34,999 | 121 (5.8%) | 71 (3.9%) |
| $35,000 to $49,999 | 377 (18.1%) | 89 (4.9%) |
| $50,000 to $74,999 | 477 (23.0%) | 270 (14.9%) |
| $75,000 to $99,999 | 365 (17.6%) | 370 (20.4%) |
| $100,000 to $149,999 | 178 (8.6%) | 372 (20.5%) |
| $150,000 or more | 201 (9.7%) | 377 (20.8%) |
| Total | 2,078 (100.0%) | 1,813 (100.0%) |
Property Value to Household Income Ratio in Liberal
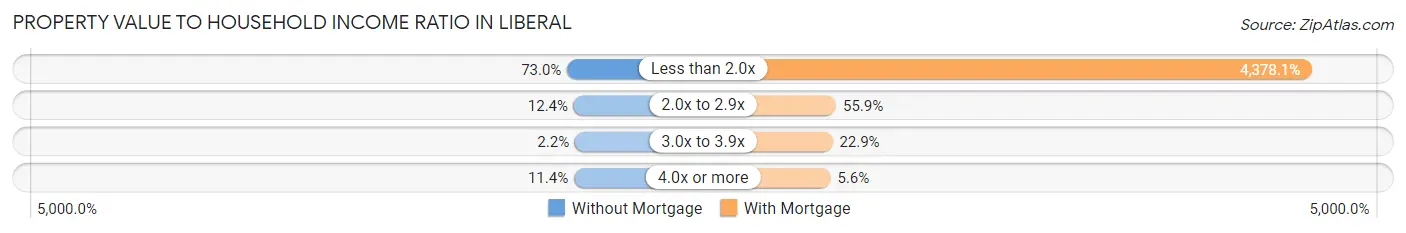
| Value-to-Income Ratio | Without Mortgage | With Mortgage |
| Less than 2.0x | 1,517 (73.0%) | 79,375 (4,378.1%) |
| 2.0x to 2.9x | 257 (12.4%) | 1,013 (55.9%) |
| 3.0x to 3.9x | 45 (2.2%) | 415 (22.9%) |
| 4.0x or more | 236 (11.4%) | 101 (5.6%) |
| Total | 2,078 (100.0%) | 1,813 (100.0%) |
Real Estate Taxes by Mortgage Status in Liberal
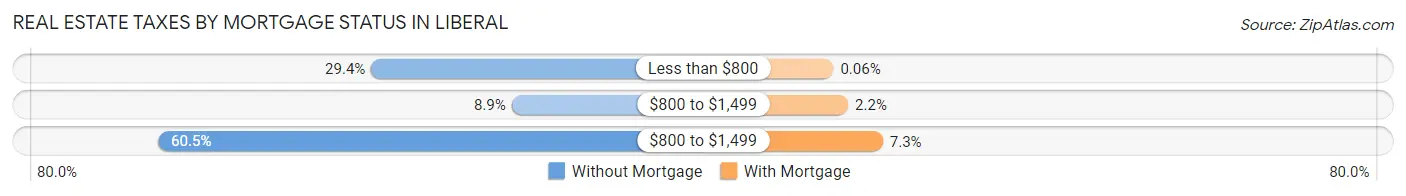
| Property Taxes | Without Mortgage | With Mortgage |
| Less than $800 | 610 (29.4%) | 1 (0.1%) |
| $800 to $1,499 | 184 (8.8%) | 40 (2.2%) |
| $800 to $1,499 | 1,257 (60.5%) | 132 (7.3%) |
| Total | 2,078 (100.0%) | 1,813 (100.0%) |
Health & Disability in Liberal
Health Insurance Coverage by Age in Liberal
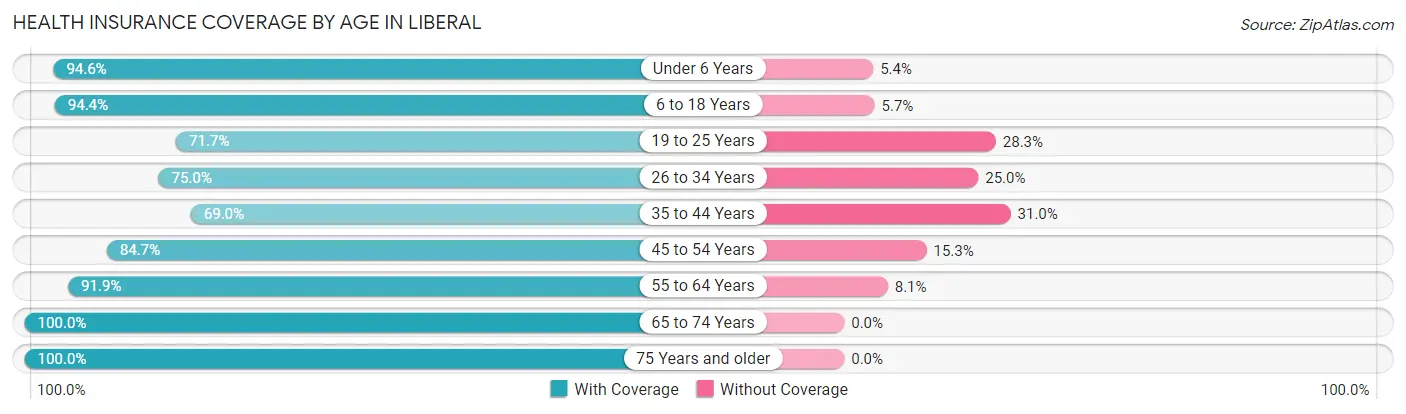
| Age Bracket | With Coverage | Without Coverage |
| Under 6 Years | 1,843 (94.6%) | 105 (5.4%) |
| 6 to 18 Years | 3,991 (94.4%) | 239 (5.7%) |
| 19 to 25 Years | 1,528 (71.7%) | 602 (28.3%) |
| 26 to 34 Years | 1,879 (75.0%) | 626 (25.0%) |
| 35 to 44 Years | 1,631 (69.0%) | 733 (31.0%) |
| 45 to 54 Years | 1,760 (84.7%) | 319 (15.3%) |
| 55 to 64 Years | 1,779 (91.9%) | 157 (8.1%) |
| 65 to 74 Years | 970 (100.0%) | 0 (0.0%) |
| 75 Years and older | 763 (100.0%) | 0 (0.0%) |
| Total | 16,144 (85.3%) | 2,781 (14.7%) |
Health Insurance Coverage by Citizenship Status in Liberal
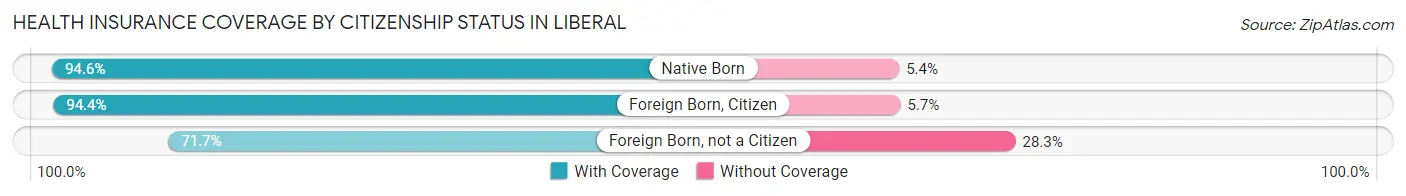
| Citizenship Status | With Coverage | Without Coverage |
| Native Born | 1,843 (94.6%) | 105 (5.4%) |
| Foreign Born, Citizen | 3,991 (94.4%) | 239 (5.7%) |
| Foreign Born, not a Citizen | 1,528 (71.7%) | 602 (28.3%) |
Health Insurance Coverage by Household Income in Liberal
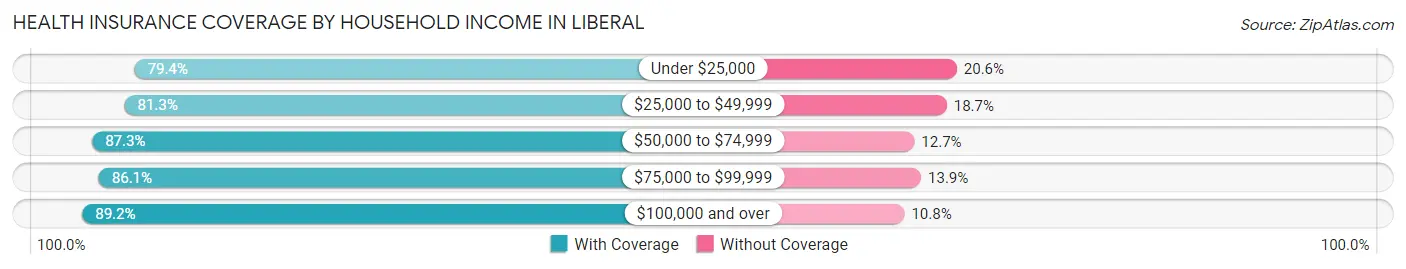
| Household Income | With Coverage | Without Coverage |
| Under $25,000 | 1,859 (79.4%) | 483 (20.6%) |
| $25,000 to $49,999 | 3,427 (81.3%) | 790 (18.7%) |
| $50,000 to $74,999 | 2,965 (87.3%) | 430 (12.7%) |
| $75,000 to $99,999 | 3,289 (86.1%) | 532 (13.9%) |
| $100,000 and over | 4,374 (89.2%) | 530 (10.8%) |
Public vs Private Health Insurance Coverage by Age in Liberal
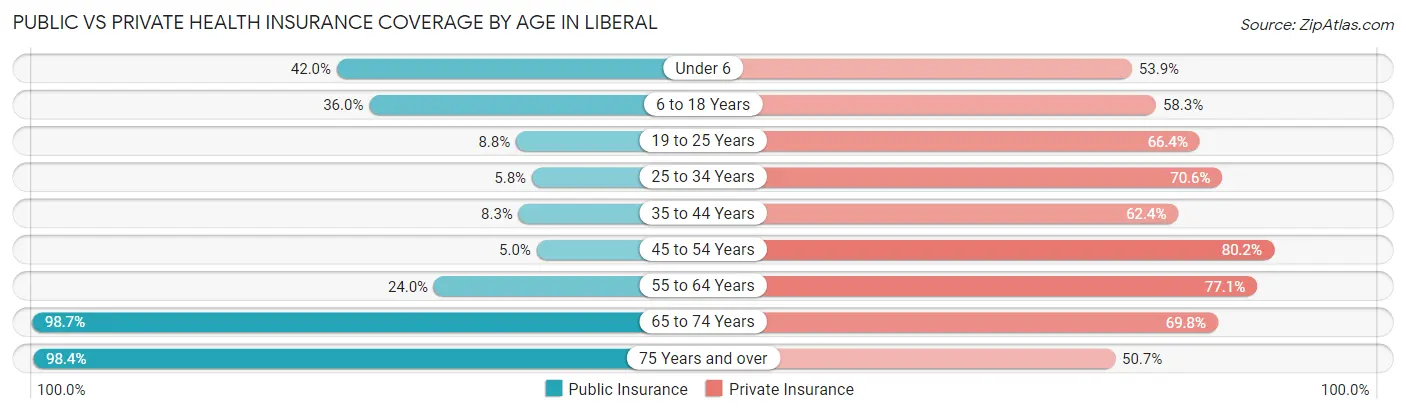
| Age Bracket | Public Insurance | Private Insurance |
| Under 6 | 819 (42.0%) | 1,049 (53.8%) |
| 6 to 18 Years | 1,524 (36.0%) | 2,467 (58.3%) |
| 19 to 25 Years | 187 (8.8%) | 1,415 (66.4%) |
| 25 to 34 Years | 146 (5.8%) | 1,769 (70.6%) |
| 35 to 44 Years | 196 (8.3%) | 1,476 (62.4%) |
| 45 to 54 Years | 103 (5.0%) | 1,667 (80.2%) |
| 55 to 64 Years | 465 (24.0%) | 1,492 (77.1%) |
| 65 to 74 Years | 957 (98.7%) | 677 (69.8%) |
| 75 Years and over | 751 (98.4%) | 387 (50.7%) |
| Total | 5,148 (27.2%) | 12,399 (65.5%) |
Disability Status by Sex by Age in Liberal
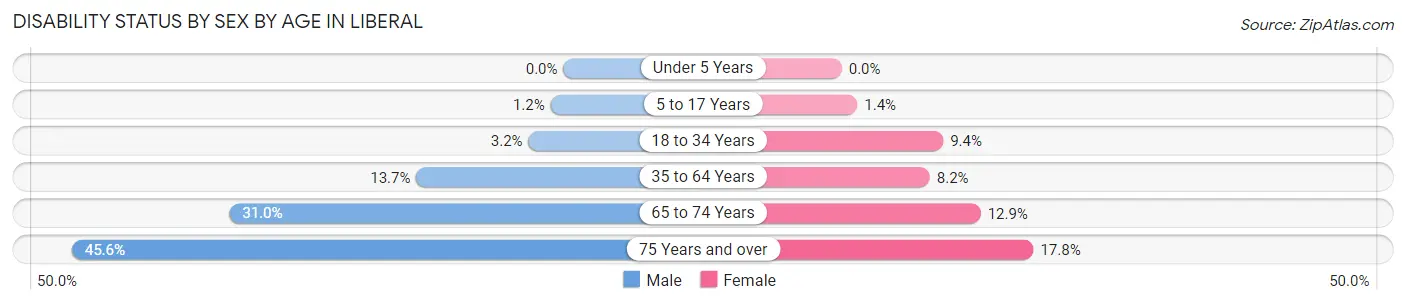
| Age Bracket | Male | Female |
| Under 5 Years | 0 (0.0%) | 0 (0.0%) |
| 5 to 17 Years | 27 (1.2%) | 29 (1.4%) |
| 18 to 34 Years | 81 (3.2%) | 220 (9.4%) |
| 35 to 64 Years | 470 (13.7%) | 240 (8.2%) |
| 65 to 74 Years | 142 (31.0%) | 66 (12.9%) |
| 75 Years and over | 125 (45.6%) | 87 (17.8%) |
Disability Class by Sex by Age in Liberal
Disability Class: Hearing Difficulty
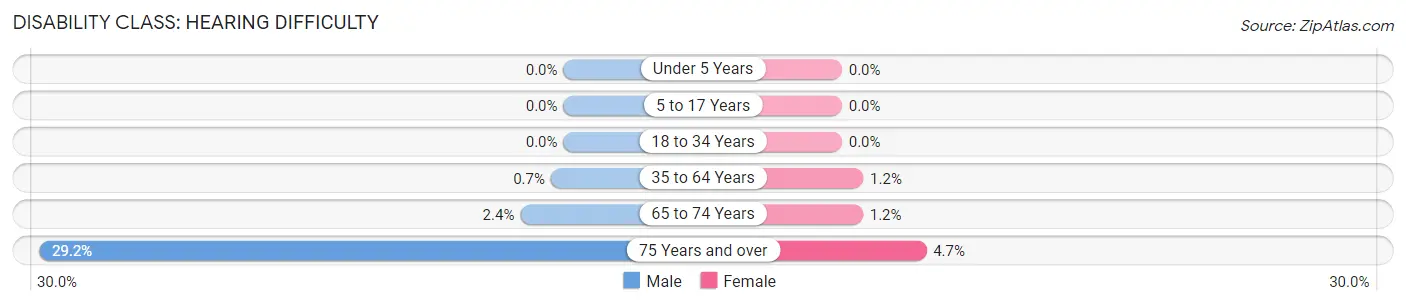
| Age Bracket | Male | Female |
| Under 5 Years | 0 (0.0%) | 0 (0.0%) |
| 5 to 17 Years | 0 (0.0%) | 0 (0.0%) |
| 18 to 34 Years | 0 (0.0%) | 0 (0.0%) |
| 35 to 64 Years | 24 (0.7%) | 35 (1.2%) |
| 65 to 74 Years | 11 (2.4%) | 6 (1.2%) |
| 75 Years and over | 80 (29.2%) | 23 (4.7%) |
Disability Class: Vision Difficulty
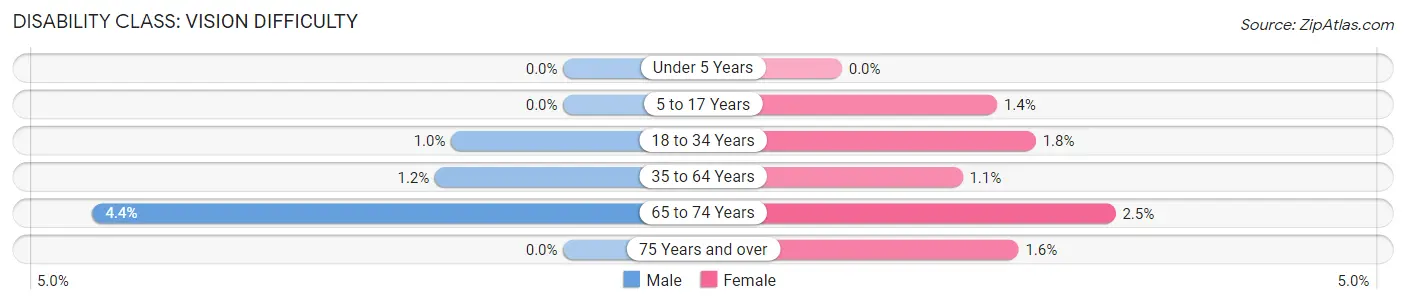
| Age Bracket | Male | Female |
| Under 5 Years | 0 (0.0%) | 0 (0.0%) |
| 5 to 17 Years | 0 (0.0%) | 29 (1.4%) |
| 18 to 34 Years | 26 (1.0%) | 42 (1.8%) |
| 35 to 64 Years | 41 (1.2%) | 33 (1.1%) |
| 65 to 74 Years | 20 (4.4%) | 13 (2.5%) |
| 75 Years and over | 0 (0.0%) | 8 (1.6%) |
Disability Class: Cognitive Difficulty
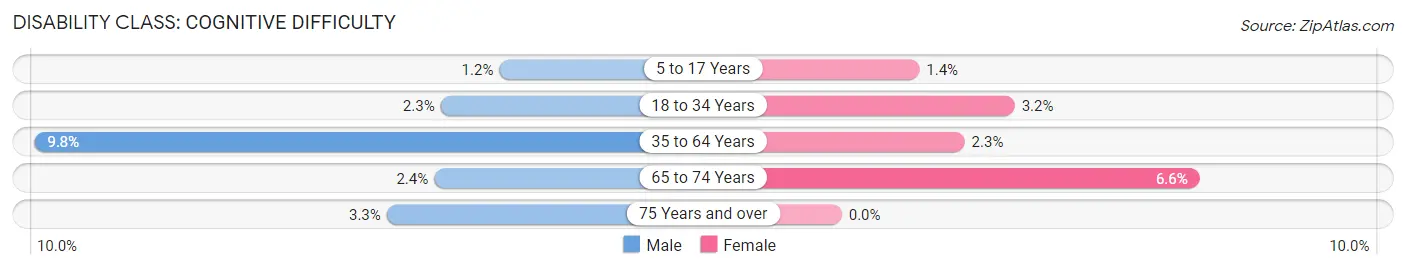
| Age Bracket | Male | Female |
| 5 to 17 Years | 27 (1.2%) | 29 (1.4%) |
| 18 to 34 Years | 57 (2.3%) | 75 (3.2%) |
| 35 to 64 Years | 338 (9.8%) | 67 (2.3%) |
| 65 to 74 Years | 11 (2.4%) | 34 (6.6%) |
| 75 Years and over | 9 (3.3%) | 0 (0.0%) |
Disability Class: Ambulatory Difficulty
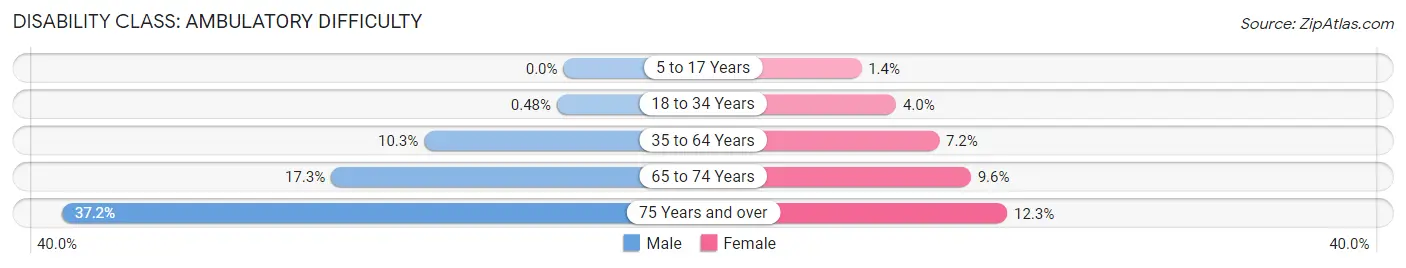
| Age Bracket | Male | Female |
| 5 to 17 Years | 0 (0.0%) | 29 (1.4%) |
| 18 to 34 Years | 12 (0.5%) | 94 (4.0%) |
| 35 to 64 Years | 356 (10.3%) | 212 (7.2%) |
| 65 to 74 Years | 79 (17.2%) | 49 (9.6%) |
| 75 Years and over | 102 (37.2%) | 60 (12.3%) |
Disability Class: Self-Care Difficulty
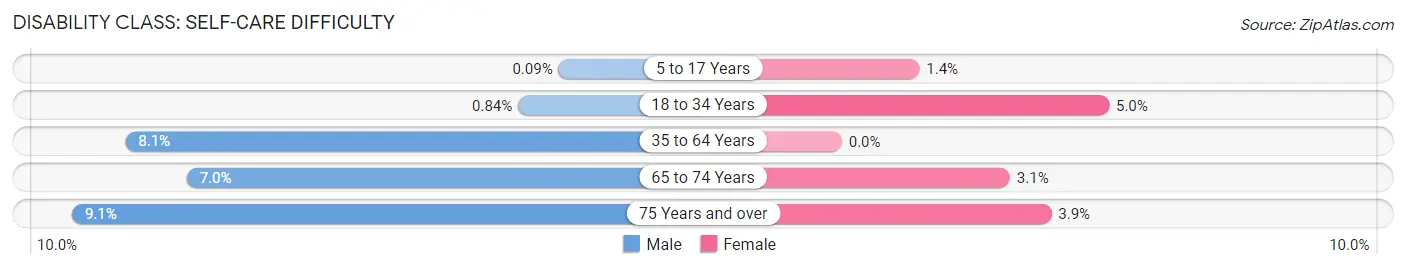
| Age Bracket | Male | Female |
| 5 to 17 Years | 2 (0.1%) | 29 (1.4%) |
| 18 to 34 Years | 21 (0.8%) | 116 (5.0%) |
| 35 to 64 Years | 280 (8.1%) | 0 (0.0%) |
| 65 to 74 Years | 32 (7.0%) | 16 (3.1%) |
| 75 Years and over | 25 (9.1%) | 19 (3.9%) |
Technology Access in Liberal
Computing Device Access in Liberal
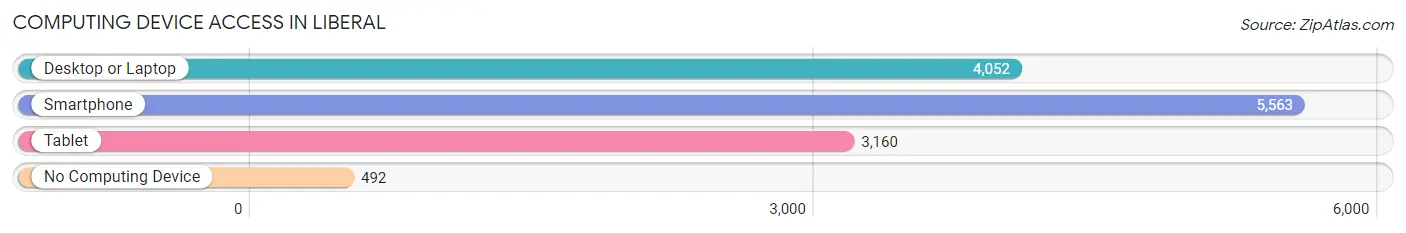
| Device Type | # Households | % Households |
| Desktop or Laptop | 4,052 | 65.1% |
| Smartphone | 5,563 | 89.4% |
| Tablet | 3,160 | 50.8% |
| No Computing Device | 492 | 7.9% |
| Total | 6,224 | 100.0% |
Internet Access in Liberal
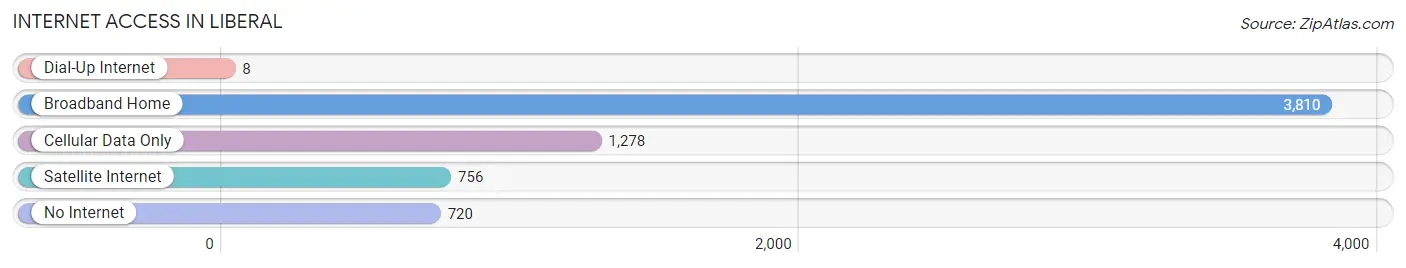
| Internet Type | # Households | % Households |
| Dial-Up Internet | 8 | 0.1% |
| Broadband Home | 3,810 | 61.2% |
| Cellular Data Only | 1,278 | 20.5% |
| Satellite Internet | 756 | 12.1% |
| No Internet | 720 | 11.6% |
| Total | 6,224 | 100.0% |
Liberal Summary
Liberal, Kansas is a city located in the southwestern corner of the state, in Seward County. It is the county seat and the most populous city in the county, with a population of 20,525 as of the 2010 census. The city is located on the Arkansas River and is part of the High Plains region of the Great Plains.
History
The area that is now Liberal was first settled in 1872, when the Santa Fe Railroad built a station there. The town was originally named "Gosnell" after the railroad's superintendent, but was later renamed "Liberal" in 1885, after the railroad's president, William B. Liberal. The town was incorporated in 1887 and was designated as the county seat of Seward County in 1888.
In the early 1900s, Liberal experienced a period of rapid growth, due in part to the discovery of oil in the area. The city was also a major stop on the Santa Fe Trail, and was home to a number of businesses, including a flour mill, a creamery, and a brick factory.
Geography
Liberal is located in the southwestern corner of Kansas, in Seward County. It is situated on the Arkansas River, at an elevation of 2,845 feet (867 m). The city has a total area of 8.3 square miles (21.5 km2), of which 8.2 square miles (21.3 km2) is land and 0.1 square miles (0.2 km2) is water.
Climate
Liberal has a semi-arid climate, with hot summers and cold winters. The average annual temperature is 56.2 °F (13.4 °C), and the average annual precipitation is 20.2 inches (51.3 cm).
Economy
Liberal's economy is largely based on agriculture and oil production. The city is home to a number of agricultural businesses, including a grain elevator, a feed mill, and a fertilizer plant. The city is also home to a number of oil and gas production companies, as well as a number of manufacturing companies.
Demographics
As of the 2010 census, there were 20,525 people, 7,845 households, and 5,072 families residing in the city. The population density was 2,485.3 people per square mile (959.7/km2). The racial makeup of the city was 68.2% White, 0.9% African American, 1.2% Native American, 0.7% Asian, 0.1% Pacific Islander, 25.7% from other races, and 3.2% from two or more races. Hispanic or Latino of any race were 44.3% of the population.
The median income for a household in the city was $31,945, and the median income for a family was $37,945. The per capita income for the city was $16,845. About 18.2% of families and 22.3% of the population were below the poverty line, including 33.2% of those under age 18 and 11.2% of those age 65 or over.
Common Questions
What is Per Capita Income in Liberal?
Per Capita income in Liberal is $25,078.
What is the Median Family Income in Liberal?
Median Family Income in Liberal is $68,688.
What is the Median Household income in Liberal?
Median Household Income in Liberal is $55,602.
What is Income or Wage Gap in Liberal?
Income or Wage Gap in Liberal is 30.5%.
Women in Liberal earn 69.5 cents for every dollar earned by a man.
What is Family Income Deficit in Liberal?
Family Income Deficit in Liberal is $10,252.
Families that are below poverty line in Liberal earn $10,252 less on average than the poverty threshold level.
What is Inequality or Gini Index in Liberal?
Inequality or Gini Index in Liberal is 0.40.
What is the Total Population of Liberal?
Total Population of Liberal is 19,099.
What is the Total Male Population of Liberal?
Total Male Population of Liberal is 9,936.
What is the Total Female Population of Liberal?
Total Female Population of Liberal is 9,163.
What is the Ratio of Males per 100 Females in Liberal?
There are 108.44 Males per 100 Females in Liberal.
What is the Ratio of Females per 100 Males in Liberal?
There are 92.22 Females per 100 Males in Liberal.
What is the Median Population Age in Liberal?
Median Population Age in Liberal is 30.4 Years.
What is the Average Family Size in Liberal
Average Family Size in Liberal is 3.8 People.
What is the Average Household Size in Liberal
Average Household Size in Liberal is 3.0 People.
How Large is the Labor Force in Liberal?
There are 9,583 People in the Labor Forcein in Liberal.
What is the Percentage of People in the Labor Force in Liberal?
70.5% of People are in the Labor Force in Liberal.
What is the Unemployment Rate in Liberal?
Unemployment Rate in Liberal is 2.7%.