Emporia, KS Map & Demographics
Emporia Map
Emporia Overview
$26,383
PER CAPITA INCOME
$69,562
AVG FAMILY INCOME
$49,661
AVG HOUSEHOLD INCOME
49.1%
WAGE / INCOME GAP [ % ]
50.9¢/ $1
WAGE / INCOME GAP [ $ ]
$11,848
FAMILY INCOME DEFICIT
0.43
INEQUALITY / GINI INDEX
24,118
TOTAL POPULATION
11,519
MALE POPULATION
12,599
FEMALE POPULATION
91.43
MALES / 100 FEMALES
109.38
FEMALES / 100 MALES
29.7
MEDIAN AGE
3.0
AVG FAMILY SIZE
2.3
AVG HOUSEHOLD SIZE
13,354
LABOR FORCE [ PEOPLE ]
68.6%
PERCENT IN LABOR FORCE
3.2%
UNEMPLOYMENT RATE
Emporia Zip Codes
Emporia Area Codes
Income in Emporia
Income Overview in Emporia
Per Capita Income in Emporia is $26,383, while median incomes of families and households are $69,562 and $49,661 respectively.
| Characteristic | Number | Measure |
| Per Capita Income | 24,118 | $26,383 |
| Median Family Income | 5,303 | $69,562 |
| Mean Family Income | 5,303 | $81,347 |
| Median Household Income | 10,037 | $49,661 |
| Mean Household Income | 10,037 | $63,848 |
| Income Deficit | 5,303 | $11,848 |
| Wage / Income Gap (%) | 24,118 | 49.08% |
| Wage / Income Gap ($) | 24,118 | 50.92¢ per $1 |
| Gini / Inequality Index | 24,118 | 0.43 |
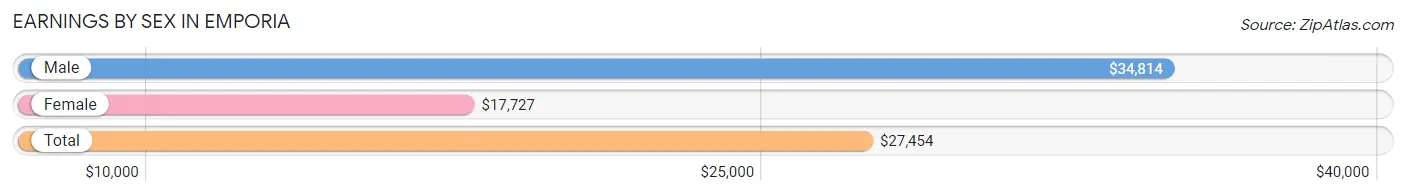
Earnings by Sex in Emporia
Average Earnings in Emporia are $27,454, $34,814 for men and $17,727 for women, a difference of 49.1%.
| Sex | Number | Average Earnings |
| Male | 7,380 (51.3%) | $34,814 |
| Female | 7,003 (48.7%) | $17,727 |
| Total | 14,383 (100.0%) | $27,454 |
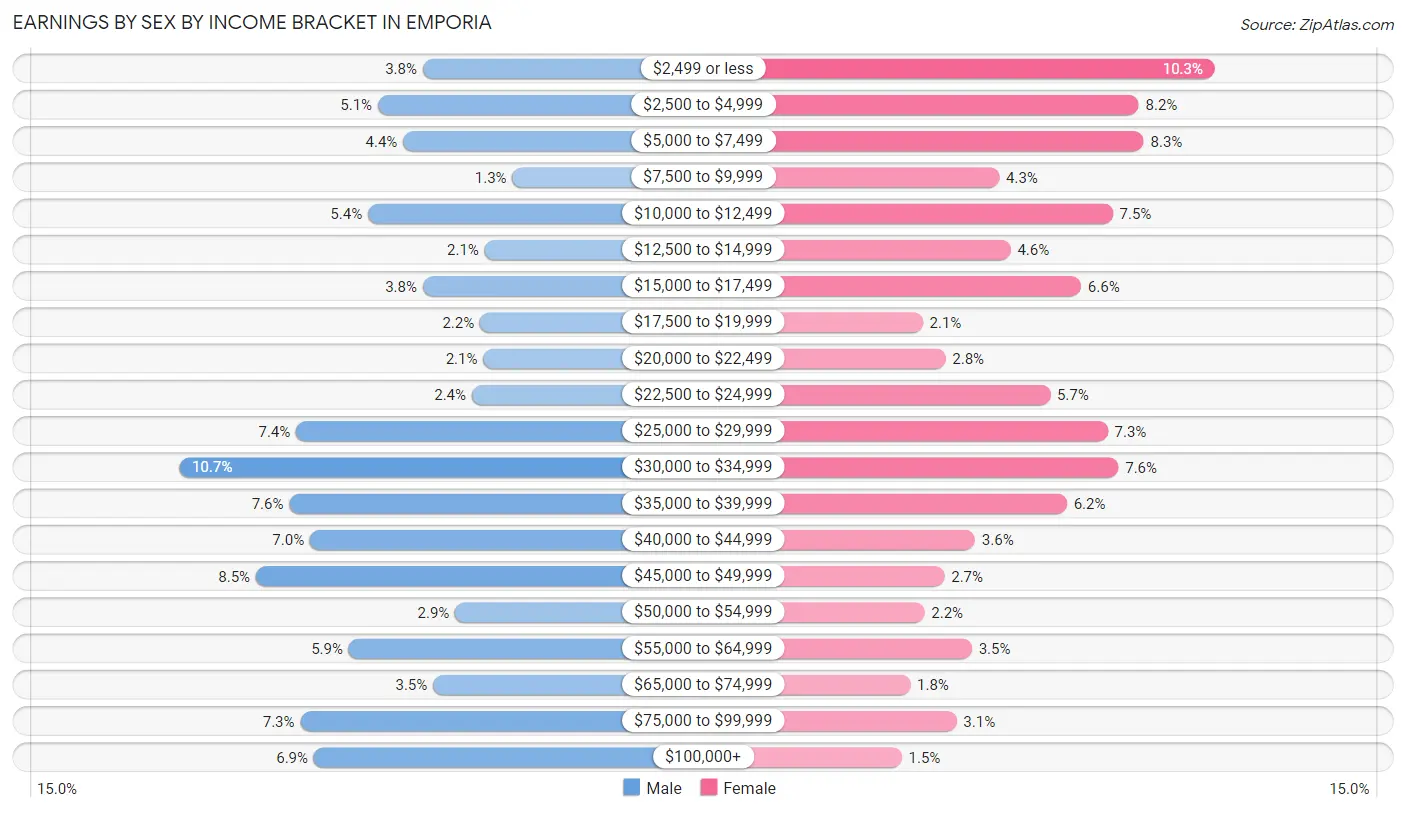
Earnings by Sex by Income Bracket in Emporia
The most common earnings brackets in Emporia are $30,000 to $34,999 for men (787 | 10.7%) and $2,499 or less for women (724 | 10.3%).
| Income | Male | Female |
| $2,499 or less | 281 (3.8%) | 724 (10.3%) |
| $2,500 to $4,999 | 374 (5.1%) | 574 (8.2%) |
| $5,000 to $7,499 | 322 (4.4%) | 584 (8.3%) |
| $7,500 to $9,999 | 95 (1.3%) | 300 (4.3%) |
| $10,000 to $12,499 | 395 (5.3%) | 523 (7.5%) |
| $12,500 to $14,999 | 153 (2.1%) | 322 (4.6%) |
| $15,000 to $17,499 | 281 (3.8%) | 461 (6.6%) |
| $17,500 to $19,999 | 162 (2.2%) | 149 (2.1%) |
| $20,000 to $22,499 | 156 (2.1%) | 194 (2.8%) |
| $22,500 to $24,999 | 179 (2.4%) | 400 (5.7%) |
| $25,000 to $29,999 | 544 (7.4%) | 513 (7.3%) |
| $30,000 to $34,999 | 787 (10.7%) | 534 (7.6%) |
| $35,000 to $39,999 | 558 (7.6%) | 433 (6.2%) |
| $40,000 to $44,999 | 515 (7.0%) | 252 (3.6%) |
| $45,000 to $49,999 | 627 (8.5%) | 192 (2.7%) |
| $50,000 to $54,999 | 214 (2.9%) | 153 (2.2%) |
| $55,000 to $64,999 | 435 (5.9%) | 246 (3.5%) |
| $65,000 to $74,999 | 260 (3.5%) | 125 (1.8%) |
| $75,000 to $99,999 | 535 (7.2%) | 216 (3.1%) |
| $100,000+ | 507 (6.9%) | 108 (1.5%) |
| Total | 7,380 (100.0%) | 7,003 (100.0%) |
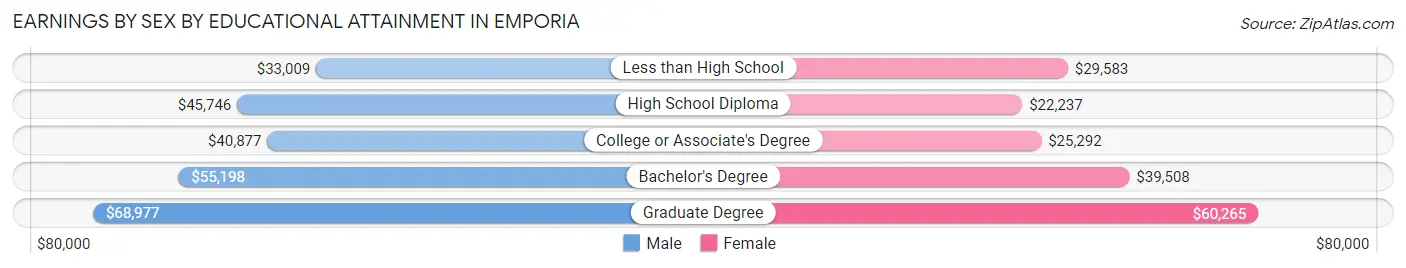
Earnings by Sex by Educational Attainment in Emporia
Average earnings in Emporia are $43,767 for men and $28,551 for women, a difference of 34.8%. Men with an educational attainment of graduate degree enjoy the highest average annual earnings of $68,977, while those with less than high school education earn the least with $33,009. Women with an educational attainment of graduate degree earn the most with the average annual earnings of $60,265, while those with high school diploma education have the smallest earnings of $22,237.
| Educational Attainment | Male Income | Female Income |
| Less than High School | $33,009 | $29,583 |
| High School Diploma | $45,746 | $22,237 |
| College or Associate's Degree | $40,877 | $25,292 |
| Bachelor's Degree | $55,198 | $39,508 |
| Graduate Degree | $68,977 | $60,265 |
| Total | $43,767 | $28,551 |
Family Income in Emporia
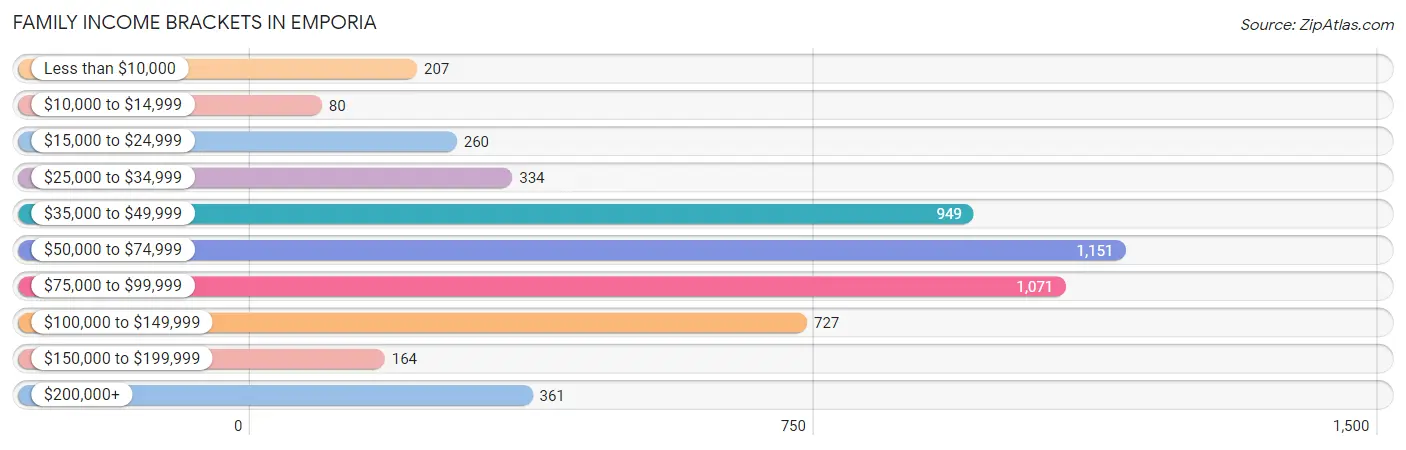
Family Income Brackets in Emporia
According to the Emporia family income data, there are 1,151 families falling into the $50,000 to $74,999 income range, which is the most common income bracket and makes up 21.7% of all families. Conversely, the $10,000 to $14,999 income bracket is the least frequent group with only 80 families (1.5%) belonging to this category.
| Income Bracket | # Families | % Families |
| Less than $10,000 | 207 | 3.9% |
| $10,000 to $14,999 | 80 | 1.5% |
| $15,000 to $24,999 | 260 | 4.9% |
| $25,000 to $34,999 | 334 | 6.3% |
| $35,000 to $49,999 | 949 | 17.9% |
| $50,000 to $74,999 | 1,151 | 21.7% |
| $75,000 to $99,999 | 1,071 | 20.2% |
| $100,000 to $149,999 | 727 | 13.7% |
| $150,000 to $199,999 | 164 | 3.1% |
| $200,000+ | 361 | 6.8% |
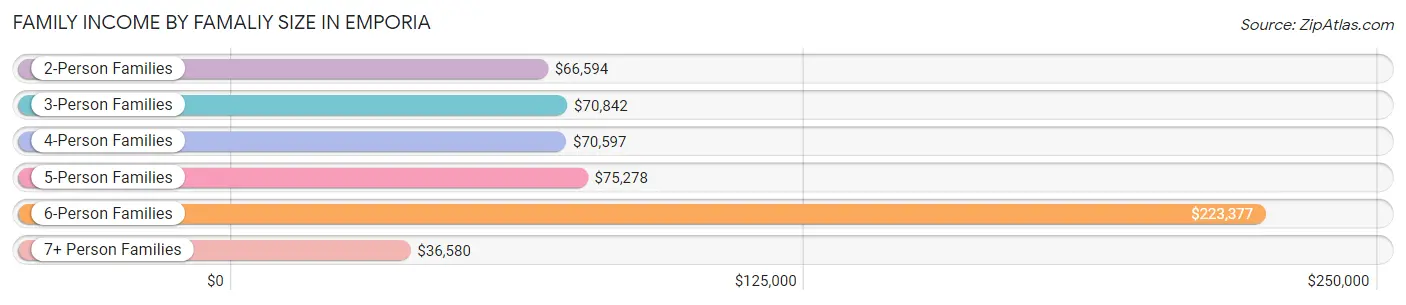
Family Income by Famaliy Size in Emporia
6-person families (164 | 3.1%) account for the highest median family income in Emporia with $223,377 per family, while 6-person families (164 | 3.1%) have the highest median income of $37,230 per family member.
| Income Bracket | # Families | Median Income |
| 2-Person Families | 2,480 (46.8%) | $66,594 |
| 3-Person Families | 1,147 (21.6%) | $70,842 |
| 4-Person Families | 947 (17.9%) | $70,597 |
| 5-Person Families | 498 (9.4%) | $75,278 |
| 6-Person Families | 164 (3.1%) | $223,377 |
| 7+ Person Families | 67 (1.3%) | $36,580 |
| Total | 5,303 (100.0%) | $69,562 |
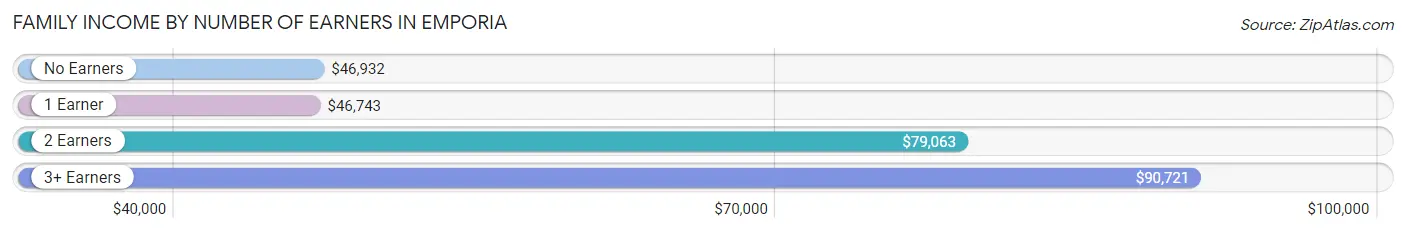
Family Income by Number of Earners in Emporia
The median family income in Emporia is $69,562, with families comprising 3+ earners (677) having the highest median family income of $90,721, while families with 1 earner (1,516) have the lowest median family income of $46,743, accounting for 12.8% and 28.6% of families, respectively.
| Number of Earners | # Families | Median Income |
| No Earners | 625 (11.8%) | $46,932 |
| 1 Earner | 1,516 (28.6%) | $46,743 |
| 2 Earners | 2,485 (46.9%) | $79,063 |
| 3+ Earners | 677 (12.8%) | $90,721 |
| Total | 5,303 (100.0%) | $69,562 |
Household Income in Emporia
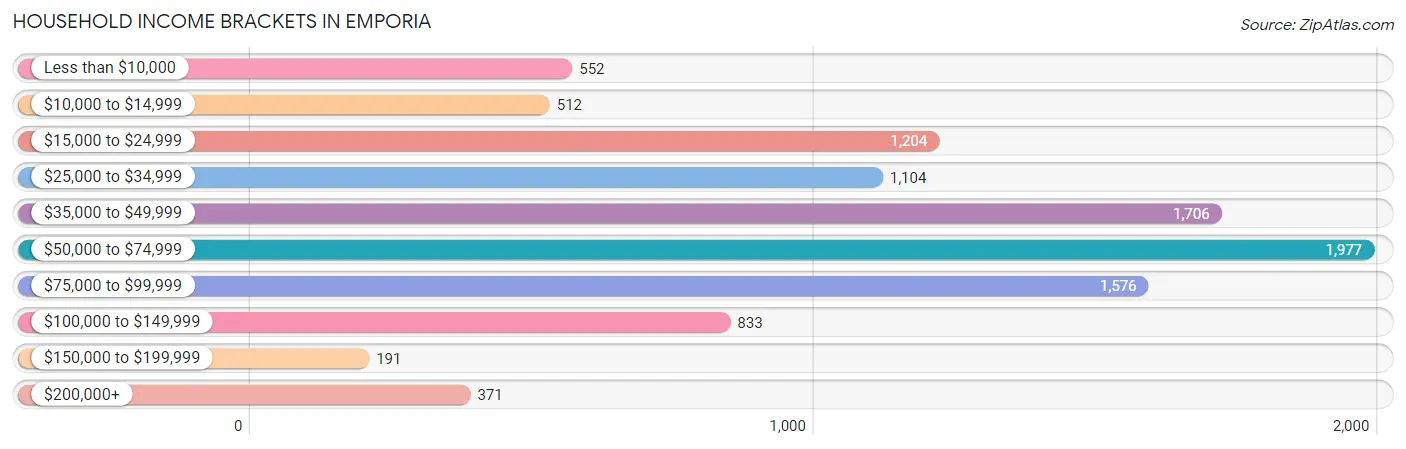
Household Income Brackets in Emporia
With 1,977 households falling in the category, the $50,000 to $74,999 income range is the most frequent in Emporia, accounting for 19.7% of all households. In contrast, only 191 households (1.9%) fall into the $150,000 to $199,999 income bracket, making it the least populous group.
| Income Bracket | # Households | % Households |
| Less than $10,000 | 552 | 5.5% |
| $10,000 to $14,999 | 512 | 5.1% |
| $15,000 to $24,999 | 1,204 | 12.0% |
| $25,000 to $34,999 | 1,104 | 11.0% |
| $35,000 to $49,999 | 1,706 | 17.0% |
| $50,000 to $74,999 | 1,977 | 19.7% |
| $75,000 to $99,999 | 1,576 | 15.7% |
| $100,000 to $149,999 | 833 | 8.3% |
| $150,000 to $199,999 | 191 | 1.9% |
| $200,000+ | 371 | 3.7% |
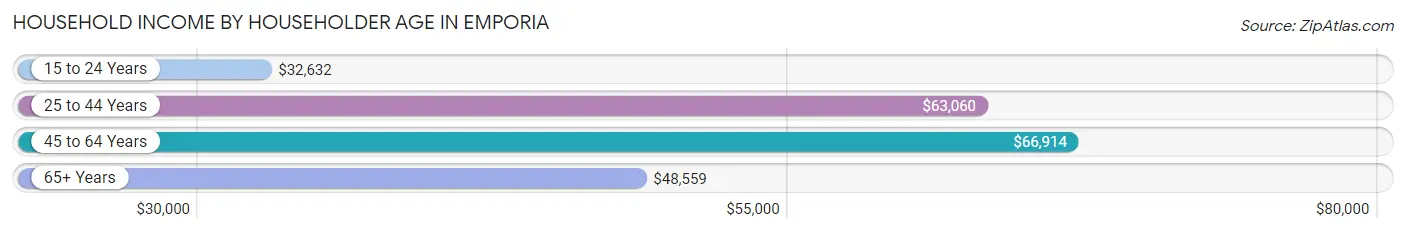
Household Income by Householder Age in Emporia
The median household income in Emporia is $49,661, with the highest median household income of $66,914 found in the 45 to 64 years age bracket for the primary householder. A total of 2,731 households (27.2%) fall into this category. Meanwhile, the 15 to 24 years age bracket for the primary householder has the lowest median household income of $32,632, with 2,040 households (20.3%) in this group.
| Income Bracket | # Households | Median Income |
| 15 to 24 Years | 2,040 (20.3%) | $32,632 |
| 25 to 44 Years | 3,295 (32.8%) | $63,060 |
| 45 to 64 Years | 2,731 (27.2%) | $66,914 |
| 65+ Years | 1,971 (19.6%) | $48,559 |
| Total | 10,037 (100.0%) | $49,661 |
Poverty in Emporia
Income Below Poverty by Sex and Age in Emporia
With 17.5% poverty level for males and 21.2% for females among the residents of Emporia, 18 to 24 year old males and 18 to 24 year old females are the most vulnerable to poverty, with 707 males (34.5%) and 1,359 females (55.7%) in their respective age groups living below the poverty level.
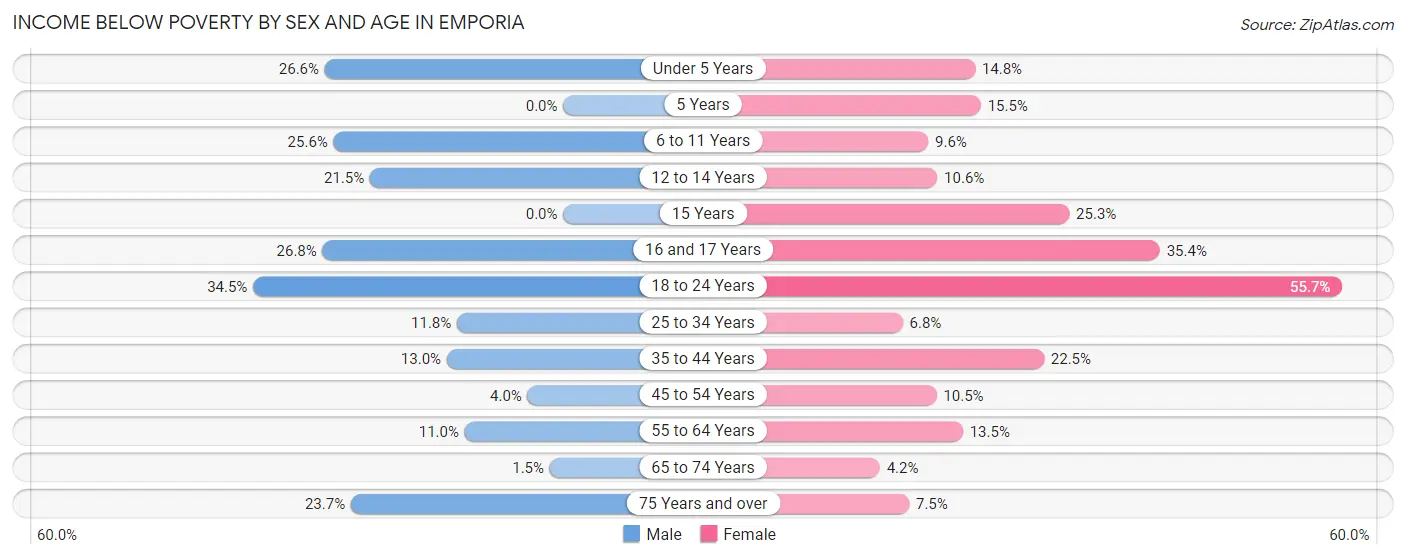
| Age Bracket | Male | Female |
| Under 5 Years | 183 (26.6%) | 112 (14.8%) |
| 5 Years | 0 (0.0%) | 28 (15.5%) |
| 6 to 11 Years | 208 (25.6%) | 86 (9.6%) |
| 12 to 14 Years | 90 (21.5%) | 48 (10.6%) |
| 15 Years | 0 (0.0%) | 60 (25.3%) |
| 16 and 17 Years | 89 (26.8%) | 74 (35.4%) |
| 18 to 24 Years | 707 (34.5%) | 1,359 (55.7%) |
| 25 to 34 Years | 210 (11.8%) | 98 (6.8%) |
| 35 to 44 Years | 177 (13.0%) | 272 (22.5%) |
| 45 to 54 Years | 40 (4.0%) | 126 (10.5%) |
| 55 to 64 Years | 127 (11.0%) | 160 (13.5%) |
| 65 to 74 Years | 14 (1.5%) | 38 (4.2%) |
| 75 Years and over | 105 (23.6%) | 58 (7.5%) |
| Total | 1,950 (17.5%) | 2,519 (21.2%) |
Income Above Poverty by Sex and Age in Emporia
According to the poverty statistics in Emporia, males aged 5 years and females aged 65 to 74 years are the age groups that are most secure financially, with 100.0% of males and 95.8% of females in these age groups living above the poverty line.
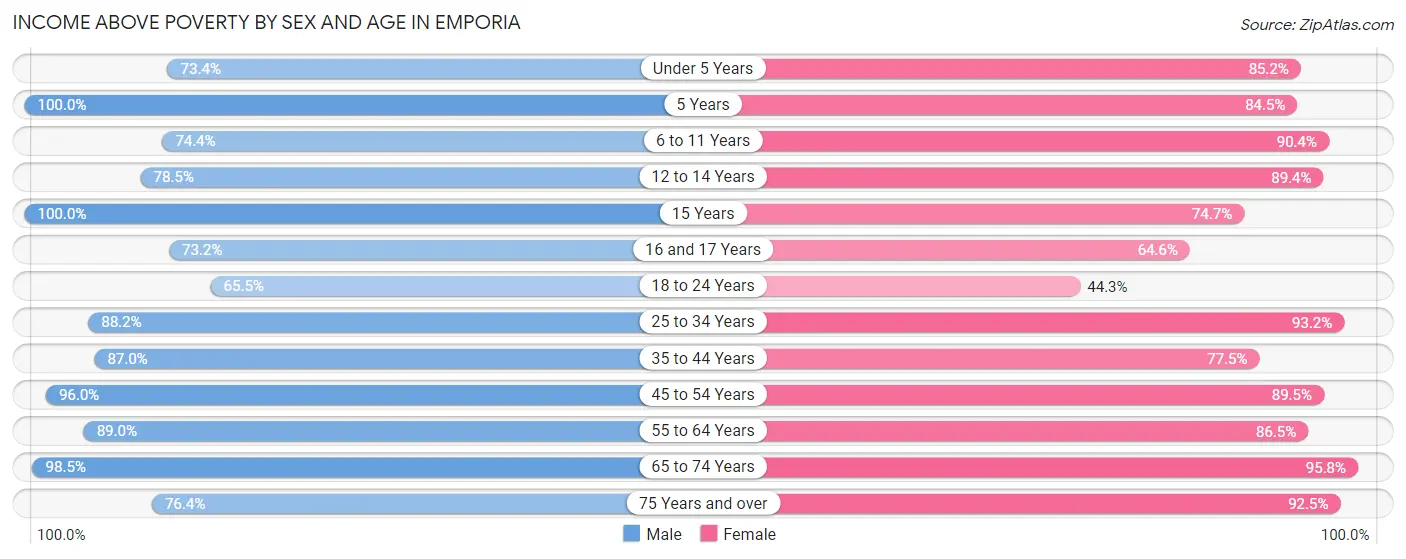
| Age Bracket | Male | Female |
| Under 5 Years | 506 (73.4%) | 643 (85.2%) |
| 5 Years | 134 (100.0%) | 153 (84.5%) |
| 6 to 11 Years | 605 (74.4%) | 809 (90.4%) |
| 12 to 14 Years | 328 (78.5%) | 404 (89.4%) |
| 15 Years | 36 (100.0%) | 177 (74.7%) |
| 16 and 17 Years | 243 (73.2%) | 135 (64.6%) |
| 18 to 24 Years | 1,340 (65.5%) | 1,080 (44.3%) |
| 25 to 34 Years | 1,565 (88.2%) | 1,350 (93.2%) |
| 35 to 44 Years | 1,188 (87.0%) | 937 (77.5%) |
| 45 to 54 Years | 968 (96.0%) | 1,070 (89.5%) |
| 55 to 64 Years | 1,030 (89.0%) | 1,028 (86.5%) |
| 65 to 74 Years | 922 (98.5%) | 863 (95.8%) |
| 75 Years and over | 339 (76.3%) | 716 (92.5%) |
| Total | 9,204 (82.5%) | 9,365 (78.8%) |
Income Below Poverty Among Married-Couple Families in Emporia
The poverty statistics for married-couple families in Emporia show that 5.2% or 205 of the total 3,960 families live below the poverty line. Families with 5 or more children have the highest poverty rate of 91.4%, comprising of 53 families. On the other hand, families with 1 or 2 children have the lowest poverty rate of 1.3%, which includes 17 families.
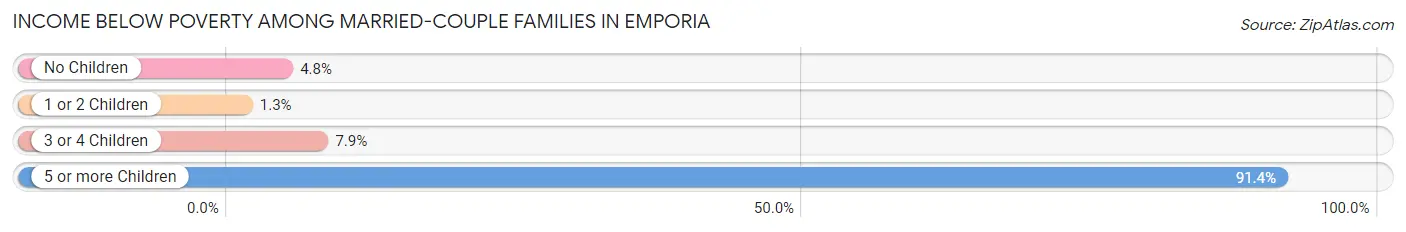
| Children | Above Poverty | Below Poverty |
| No Children | 2,123 (95.2%) | 107 (4.8%) |
| 1 or 2 Children | 1,299 (98.7%) | 17 (1.3%) |
| 3 or 4 Children | 328 (92.1%) | 28 (7.9%) |
| 5 or more Children | 5 (8.6%) | 53 (91.4%) |
| Total | 3,755 (94.8%) | 205 (5.2%) |
Income Below Poverty Among Single-Parent Households in Emporia
According to the poverty data in Emporia, 22.7% or 128 single-father households and 30.0% or 234 single-mother households are living below the poverty line. Among single-father households, those with 1 or 2 children have the highest poverty rate, with 79 households (32.2%) experiencing poverty. Likewise, among single-mother households, those with 3 or 4 children have the highest poverty rate, with 46 households (48.4%) falling below the poverty line.
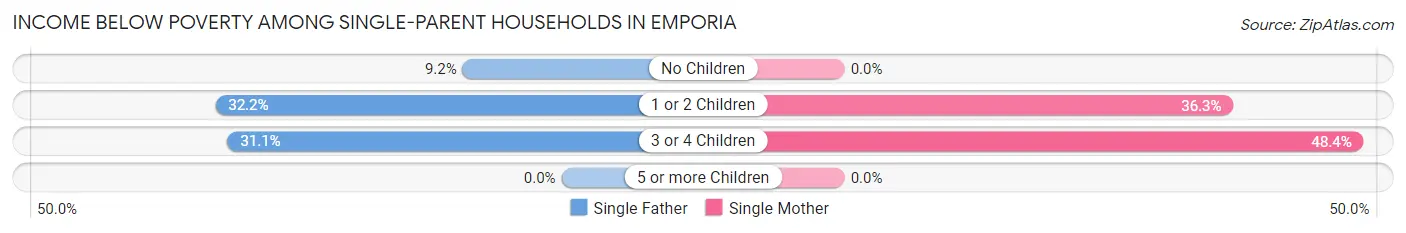
| Children | Single Father | Single Mother |
| No Children | 21 (9.2%) | 0 (0.0%) |
| 1 or 2 Children | 79 (32.2%) | 188 (36.3%) |
| 3 or 4 Children | 28 (31.1%) | 46 (48.4%) |
| 5 or more Children | 0 (0.0%) | 0 (0.0%) |
| Total | 128 (22.7%) | 234 (30.0%) |
Income Below Poverty Among Married-Couple vs Single-Parent Households in Emporia
The poverty data for Emporia shows that 205 of the married-couple family households (5.2%) and 362 of the single-parent households (27.0%) are living below the poverty level. Within the married-couple family households, those with 5 or more children have the highest poverty rate, with 53 households (91.4%) falling below the poverty line. Among the single-parent households, those with 3 or 4 children have the highest poverty rate, with 74 household (40.0%) living below poverty.
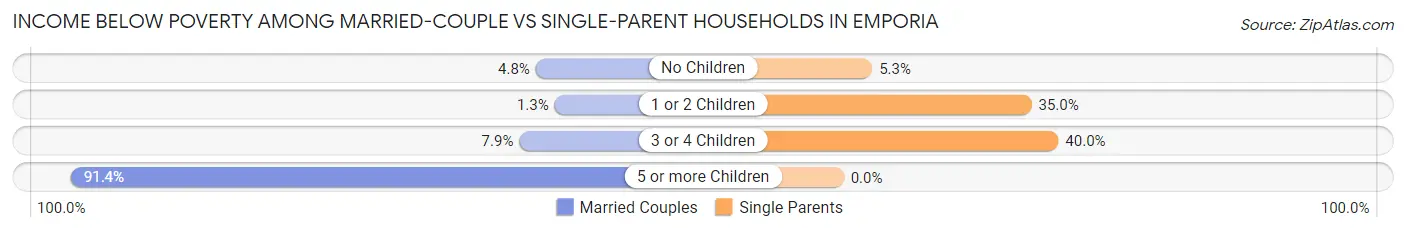
| Children | Married-Couple Families | Single-Parent Households |
| No Children | 107 (4.8%) | 21 (5.3%) |
| 1 or 2 Children | 17 (1.3%) | 267 (35.0%) |
| 3 or 4 Children | 28 (7.9%) | 74 (40.0%) |
| 5 or more Children | 53 (91.4%) | 0 (0.0%) |
| Total | 205 (5.2%) | 362 (27.0%) |
Race in Emporia
The most populous races in Emporia are White / Caucasian (18,078 | 75.0%), Hispanic or Latino (6,889 | 28.6%), and Two or more Races (3,843 | 15.9%).
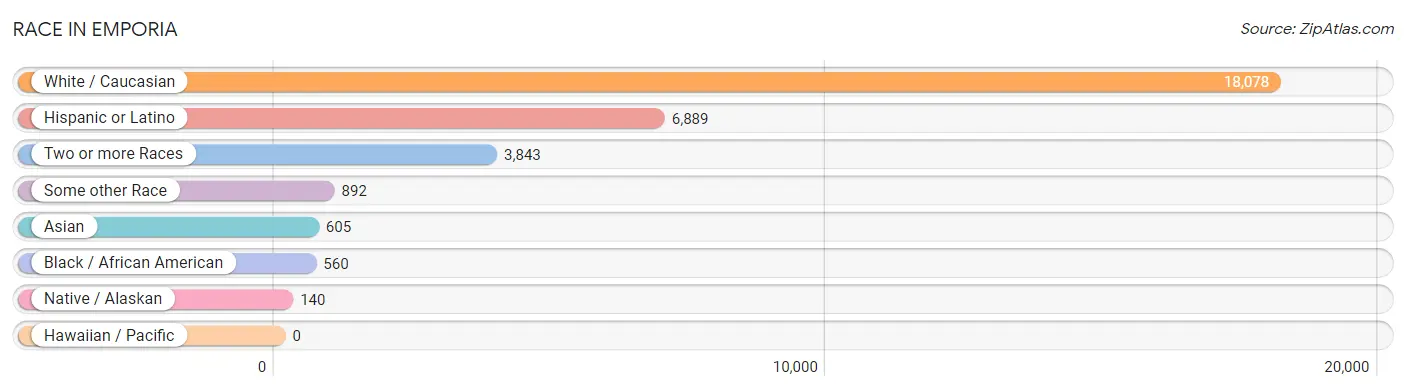
| Race | # Population | % Population |
| Asian | 605 | 2.5% |
| Black / African American | 560 | 2.3% |
| Hawaiian / Pacific | 0 | 0.0% |
| Hispanic or Latino | 6,889 | 28.6% |
| Native / Alaskan | 140 | 0.6% |
| White / Caucasian | 18,078 | 75.0% |
| Two or more Races | 3,843 | 15.9% |
| Some other Race | 892 | 3.7% |
| Total | 24,118 | 100.0% |
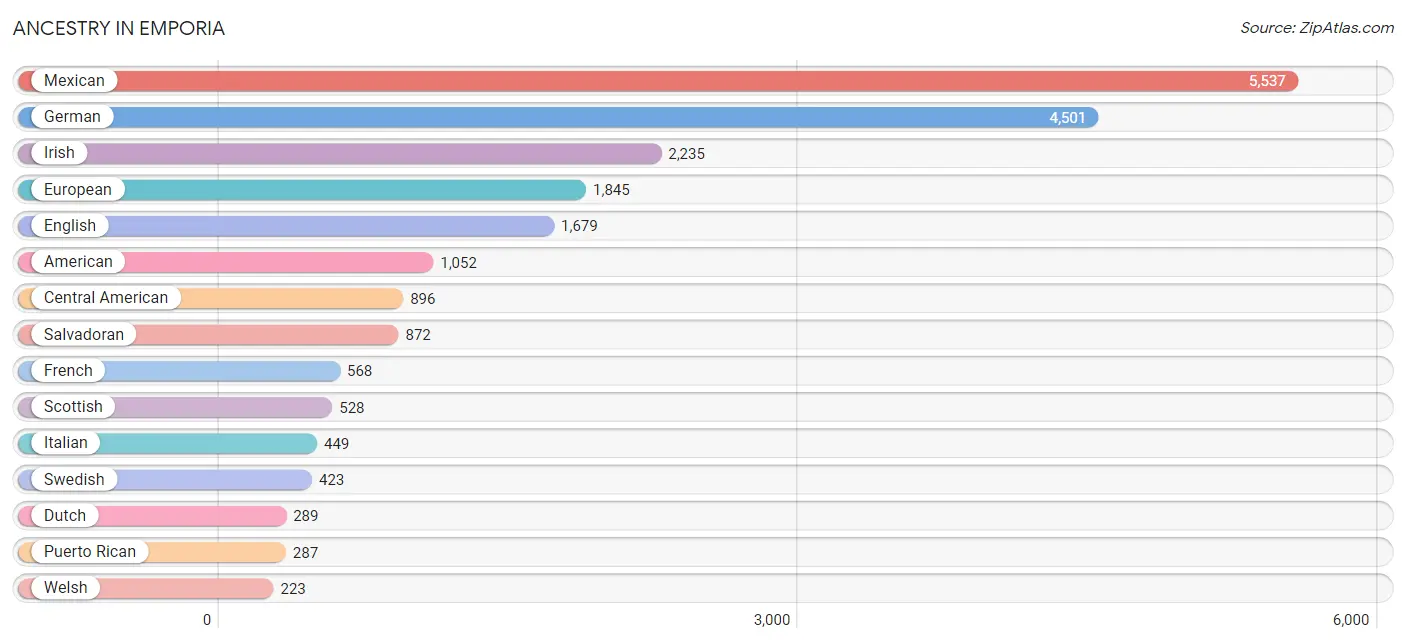
Ancestry in Emporia
The most populous ancestries reported in Emporia are Mexican (5,537 | 23.0%), German (4,501 | 18.7%), Irish (2,235 | 9.3%), European (1,845 | 7.6%), and English (1,679 | 7.0%), together accounting for 65.5% of all Emporia residents.
| Ancestry | # Population | % Population |
| African | 4 | 0.0% |
| American | 1,052 | 4.4% |
| Austrian | 29 | 0.1% |
| Bhutanese | 143 | 0.6% |
| Blackfeet | 25 | 0.1% |
| Bolivian | 7 | 0.0% |
| British | 82 | 0.3% |
| Burmese | 4 | 0.0% |
| Central American | 896 | 3.7% |
| Cherokee | 176 | 0.7% |
| Choctaw | 4 | 0.0% |
| Cuban | 57 | 0.2% |
| Czech | 80 | 0.3% |
| Czechoslovakian | 12 | 0.1% |
| Danish | 95 | 0.4% |
| Delaware | 44 | 0.2% |
| Dutch | 289 | 1.2% |
| Eastern European | 52 | 0.2% |
| English | 1,679 | 7.0% |
| European | 1,845 | 7.6% |
| French | 568 | 2.4% |
| French American Indian | 2 | 0.0% |
| French Canadian | 62 | 0.3% |
| German | 4,501 | 18.7% |
| Guatemalan | 24 | 0.1% |
| Indian (Asian) | 136 | 0.6% |
| Irish | 2,235 | 9.3% |
| Italian | 449 | 1.9% |
| Korean | 167 | 0.7% |
| Luxembourger | 8 | 0.0% |
| Malaysian | 46 | 0.2% |
| Mexican | 5,537 | 23.0% |
| Mexican American Indian | 119 | 0.5% |
| Nigerian | 10 | 0.0% |
| Northern European | 10 | 0.0% |
| Norwegian | 84 | 0.4% |
| Osage | 89 | 0.4% |
| Pakistani | 28 | 0.1% |
| Pennsylvania German | 36 | 0.2% |
| Peruvian | 22 | 0.1% |
| Polish | 173 | 0.7% |
| Potawatomi | 15 | 0.1% |
| Pueblo | 17 | 0.1% |
| Puerto Rican | 287 | 1.2% |
| Russian | 28 | 0.1% |
| Salvadoran | 872 | 3.6% |
| Scandinavian | 28 | 0.1% |
| Scotch-Irish | 86 | 0.4% |
| Scottish | 528 | 2.2% |
| Sioux | 8 | 0.0% |
| South American | 62 | 0.3% |
| Spaniard | 50 | 0.2% |
| Sri Lankan | 187 | 0.8% |
| Subsaharan African | 14 | 0.1% |
| Swedish | 423 | 1.8% |
| Swiss | 79 | 0.3% |
| Thai | 207 | 0.9% |
| Venezuelan | 33 | 0.1% |
| Welsh | 223 | 0.9% | View All 59 Rows |
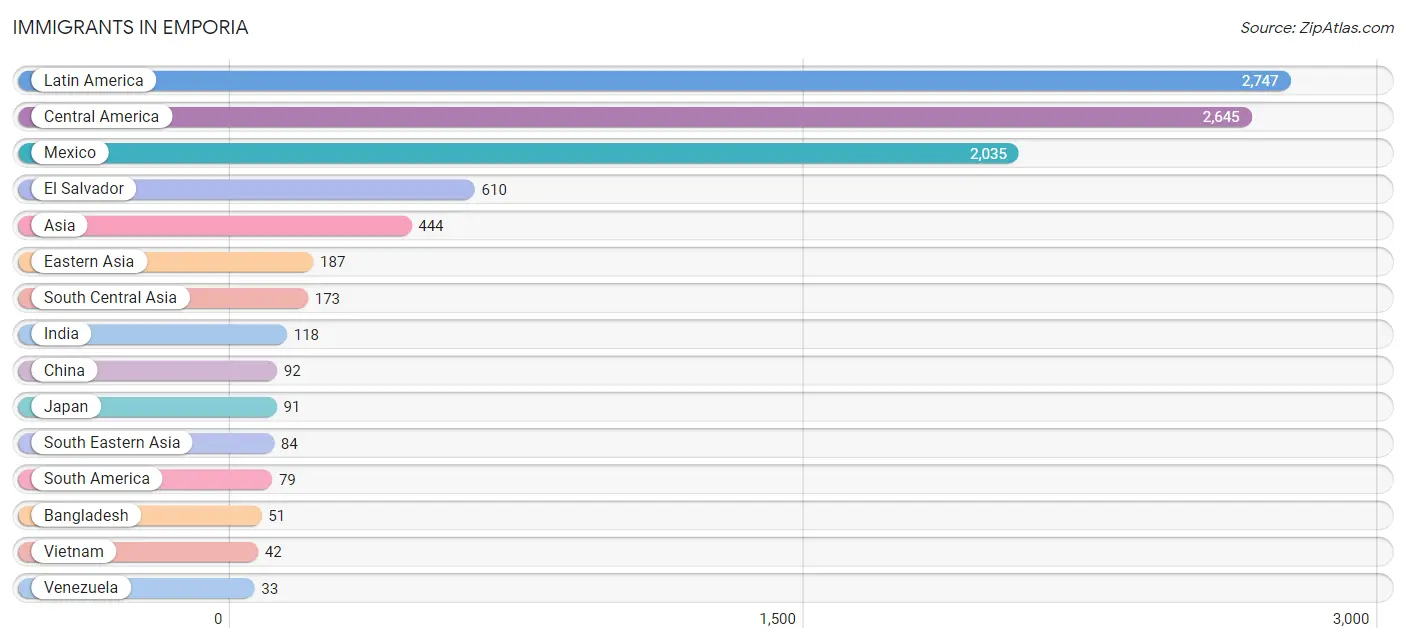
Immigrants in Emporia
The most numerous immigrant groups reported in Emporia came from Latin America (2,747 | 11.4%), Central America (2,645 | 11.0%), Mexico (2,035 | 8.4%), El Salvador (610 | 2.5%), and Asia (444 | 1.8%), together accounting for 35.2% of all Emporia residents.
| Immigration Origin | # Population | % Population |
| Africa | 10 | 0.0% |
| Asia | 444 | 1.8% |
| Bahamas | 5 | 0.0% |
| Bangladesh | 51 | 0.2% |
| Bolivia | 7 | 0.0% |
| Caribbean | 23 | 0.1% |
| Central America | 2,645 | 11.0% |
| China | 92 | 0.4% |
| Cuba | 11 | 0.1% |
| Eastern Asia | 187 | 0.8% |
| Eastern Europe | 10 | 0.0% |
| Ecuador | 17 | 0.1% |
| El Salvador | 610 | 2.5% |
| Europe | 28 | 0.1% |
| Germany | 18 | 0.1% |
| India | 118 | 0.5% |
| Japan | 91 | 0.4% |
| Korea | 4 | 0.0% |
| Laos | 20 | 0.1% |
| Latin America | 2,747 | 11.4% |
| Mexico | 2,035 | 8.4% |
| Nigeria | 10 | 0.0% |
| Peru | 22 | 0.1% |
| Philippines | 22 | 0.1% |
| Russia | 10 | 0.0% |
| South America | 79 | 0.3% |
| South Central Asia | 173 | 0.7% |
| South Eastern Asia | 84 | 0.4% |
| Sri Lanka | 4 | 0.0% |
| Venezuela | 33 | 0.1% |
| Vietnam | 42 | 0.2% |
| Western Africa | 10 | 0.0% |
| Western Europe | 18 | 0.1% | View All 33 Rows |
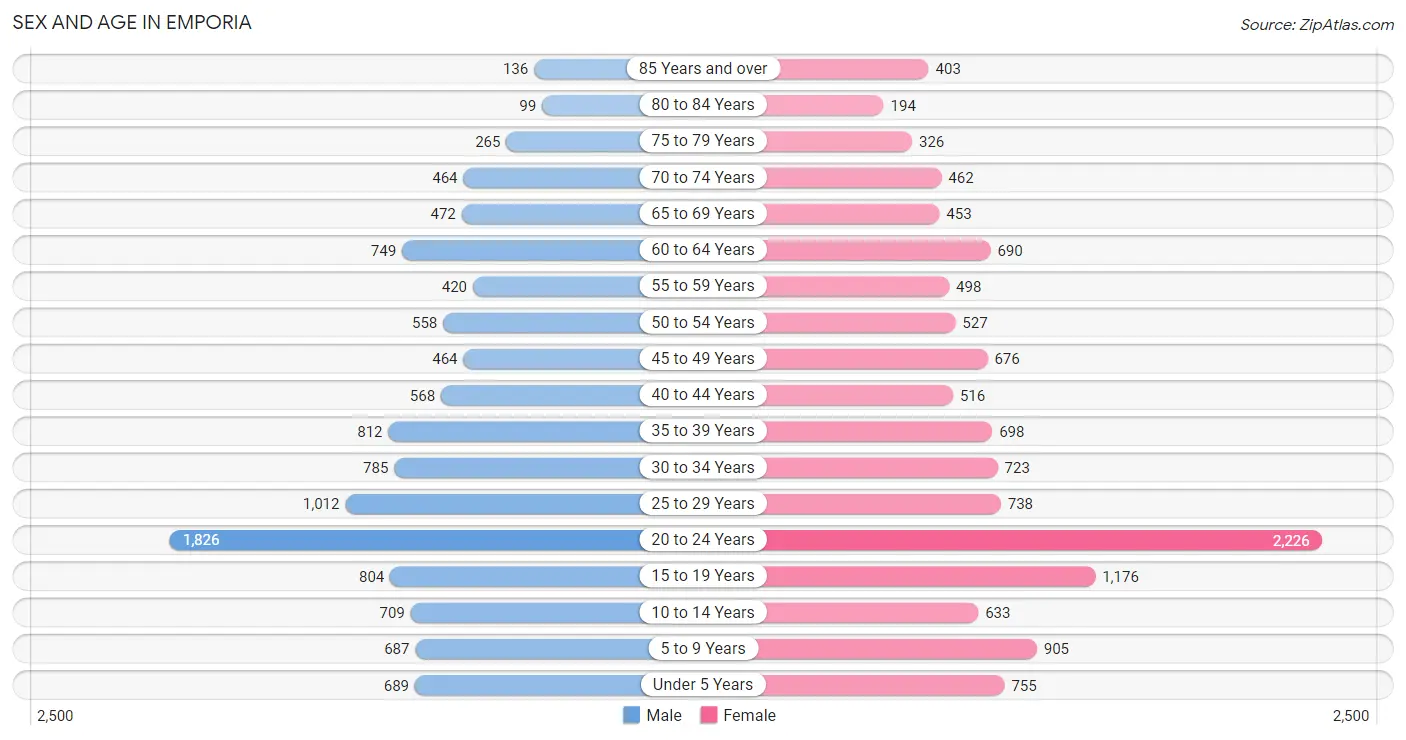
Sex and Age in Emporia
Sex and Age in Emporia
The most populous age groups in Emporia are 20 to 24 Years (1,826 | 15.9%) for men and 20 to 24 Years (2,226 | 17.7%) for women.
| Age Bracket | Male | Female |
| Under 5 Years | 689 (6.0%) | 755 (6.0%) |
| 5 to 9 Years | 687 (6.0%) | 905 (7.2%) |
| 10 to 14 Years | 709 (6.2%) | 633 (5.0%) |
| 15 to 19 Years | 804 (7.0%) | 1,176 (9.3%) |
| 20 to 24 Years | 1,826 (15.9%) | 2,226 (17.7%) |
| 25 to 29 Years | 1,012 (8.8%) | 738 (5.9%) |
| 30 to 34 Years | 785 (6.8%) | 723 (5.7%) |
| 35 to 39 Years | 812 (7.0%) | 698 (5.5%) |
| 40 to 44 Years | 568 (4.9%) | 516 (4.1%) |
| 45 to 49 Years | 464 (4.0%) | 676 (5.4%) |
| 50 to 54 Years | 558 (4.8%) | 527 (4.2%) |
| 55 to 59 Years | 420 (3.6%) | 498 (4.0%) |
| 60 to 64 Years | 749 (6.5%) | 690 (5.5%) |
| 65 to 69 Years | 472 (4.1%) | 453 (3.6%) |
| 70 to 74 Years | 464 (4.0%) | 462 (3.7%) |
| 75 to 79 Years | 265 (2.3%) | 326 (2.6%) |
| 80 to 84 Years | 99 (0.9%) | 194 (1.5%) |
| 85 Years and over | 136 (1.2%) | 403 (3.2%) |
| Total | 11,519 (100.0%) | 12,599 (100.0%) |
Families and Households in Emporia
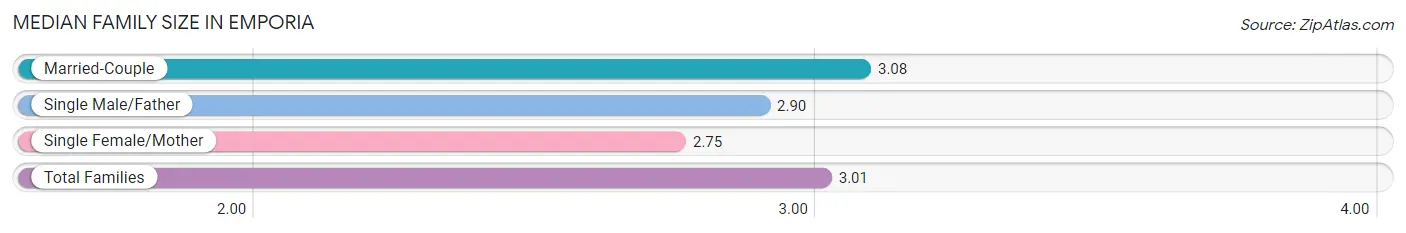
Median Family Size in Emporia
The median family size in Emporia is 3.01 persons per family, with married-couple families (3,960 | 74.7%) accounting for the largest median family size of 3.08 persons per family. On the other hand, single female/mother families (780 | 14.7%) represent the smallest median family size with 2.75 persons per family.
| Family Type | # Families | Family Size |
| Married-Couple | 3,960 (74.7%) | 3.08 |
| Single Male/Father | 563 (10.6%) | 2.90 |
| Single Female/Mother | 780 (14.7%) | 2.75 |
| Total Families | 5,303 (100.0%) | 3.01 |
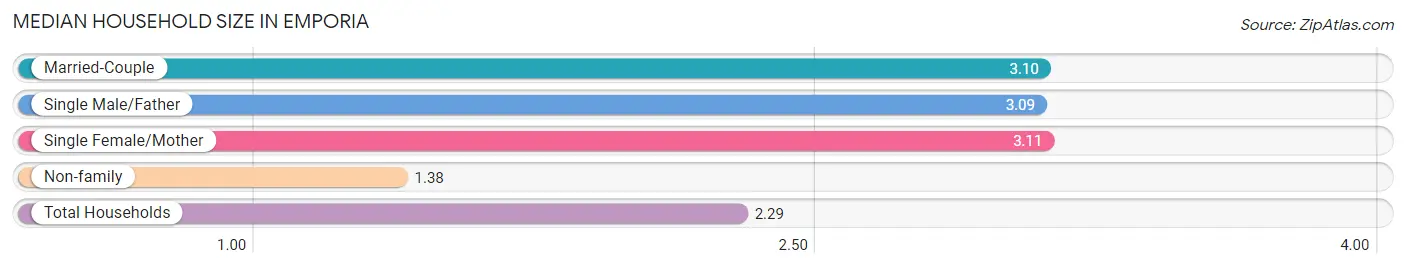
Median Household Size in Emporia
The median household size in Emporia is 2.29 persons per household, with single female/mother households (780 | 7.8%) accounting for the largest median household size of 3.11 persons per household. non-family households (4,734 | 47.2%) represent the smallest median household size with 1.38 persons per household.
| Household Type | # Households | Household Size |
| Married-Couple | 3,960 (39.5%) | 3.10 |
| Single Male/Father | 563 (5.6%) | 3.09 |
| Single Female/Mother | 780 (7.8%) | 3.11 |
| Non-family | 4,734 (47.2%) | 1.38 |
| Total Households | 10,037 (100.0%) | 2.29 |
Household Size by Marriage Status in Emporia
Out of a total of 10,037 households in Emporia, 5,303 (52.8%) are family households, while 4,734 (47.2%) are nonfamily households. The most numerous type of family households are 2-person households, comprising 2,207, and the most common type of nonfamily households are 1-person households, comprising 3,482.
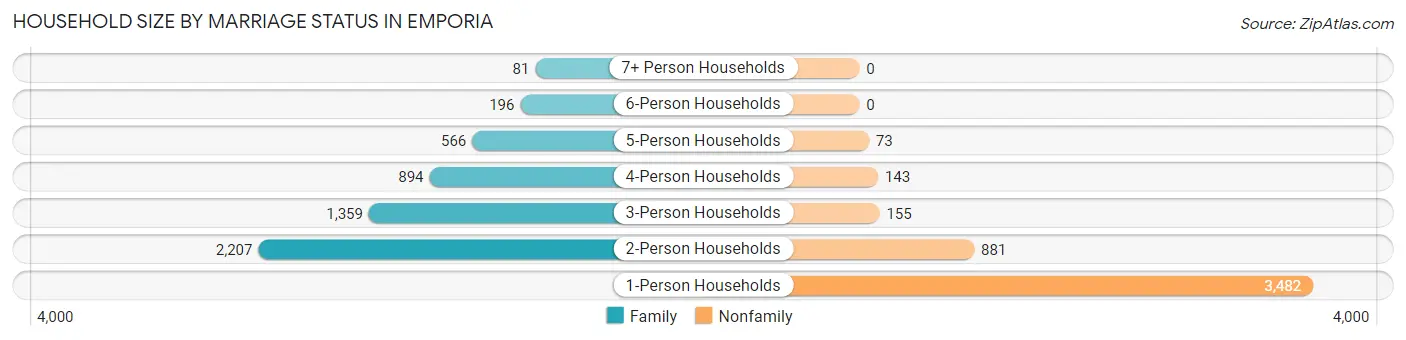
| Household Size | Family Households | Nonfamily Households |
| 1-Person Households | - | 3,482 (34.7%) |
| 2-Person Households | 2,207 (22.0%) | 881 (8.8%) |
| 3-Person Households | 1,359 (13.5%) | 155 (1.5%) |
| 4-Person Households | 894 (8.9%) | 143 (1.4%) |
| 5-Person Households | 566 (5.6%) | 73 (0.7%) |
| 6-Person Households | 196 (1.9%) | 0 (0.0%) |
| 7+ Person Households | 81 (0.8%) | 0 (0.0%) |
| Total | 5,303 (52.8%) | 4,734 (47.2%) |
Female Fertility in Emporia
Fertility by Age in Emporia
Average fertility rate in Emporia is 38.0 births per 1,000 women. Women in the age bracket of 20 to 34 years have the highest fertility rate with 69.0 births per 1,000 women. Women in the age bracket of 20 to 34 years acount for 95.8% of all women with births.
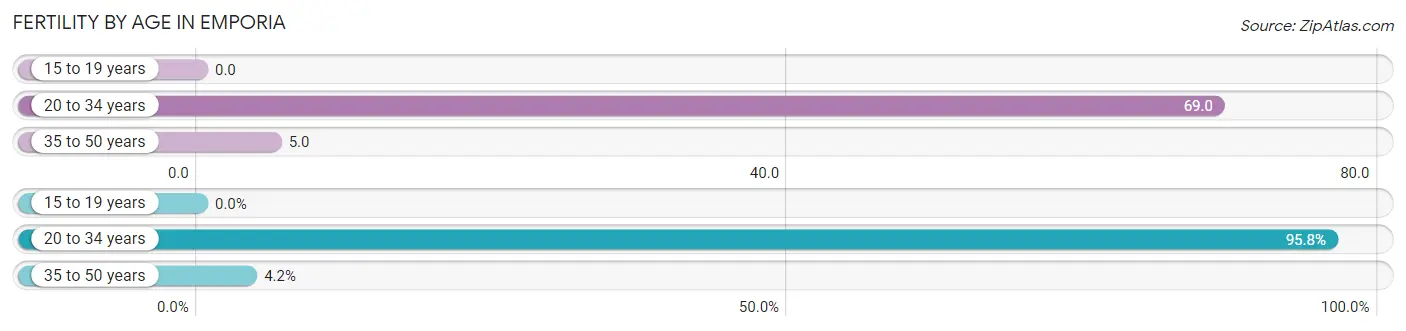
| Age Bracket | Women with Births | Births / 1,000 Women |
| 15 to 19 years | 0 (0.0%) | 0.0 |
| 20 to 34 years | 253 (95.8%) | 69.0 |
| 35 to 50 years | 11 (4.2%) | 5.0 |
| Total | 264 (100.0%) | 38.0 |
Fertility by Age by Marriage Status in Emporia
76.9% of women with births (264) in Emporia are married. The highest percentage of unmarried women with births falls into 20 to 34 years age bracket with 24.1% of them unmarried at the time of birth, while the lowest percentage of unmarried women with births belong to 35 to 50 years age bracket with 0.0% of them unmarried.
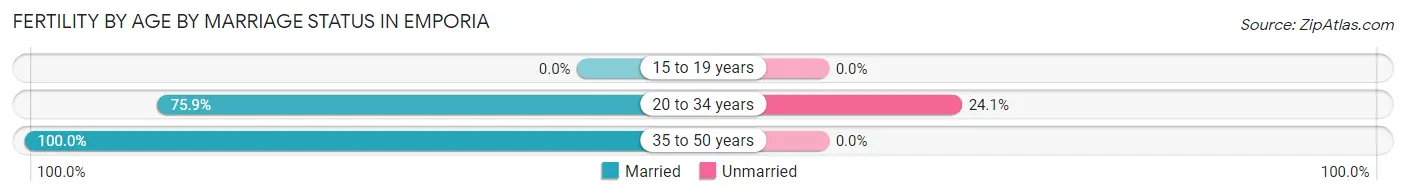
| Age Bracket | Married | Unmarried |
| 15 to 19 years | 0 (0.0%) | 0 (0.0%) |
| 20 to 34 years | 192 (75.9%) | 61 (24.1%) |
| 35 to 50 years | 11 (100.0%) | 0 (0.0%) |
| Total | 203 (76.9%) | 61 (23.1%) |
Fertility by Education in Emporia
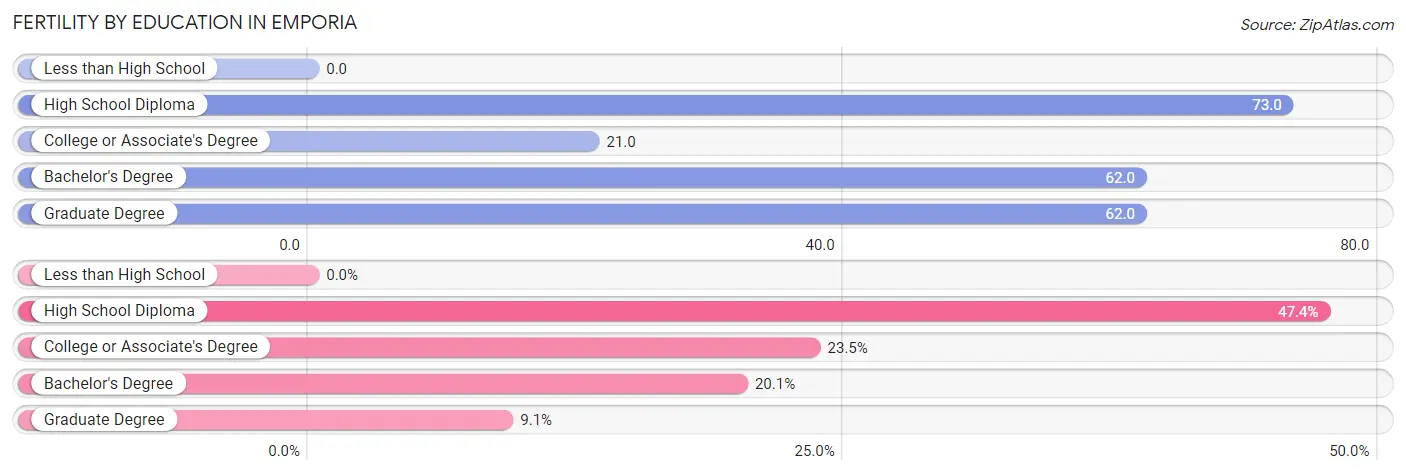
| Educational Attainment | Women with Births | Births / 1,000 Women |
| Less than High School | 0 (0.0%) | 0.0 |
| High School Diploma | 125 (47.3%) | 73.0 |
| College or Associate's Degree | 62 (23.5%) | 21.0 |
| Bachelor's Degree | 53 (20.1%) | 62.0 |
| Graduate Degree | 24 (9.1%) | 62.0 |
| Total | 264 (100.0%) | 38.0 |
Fertility by Education by Marriage Status in Emporia
23.1% of women with births in Emporia are unmarried. Women with the educational attainment of bachelor's degree are most likely to be married with 100.0% of them married at childbirth, while women with the educational attainment of high school diploma are least likely to be married with 33.6% of them unmarried at childbirth.
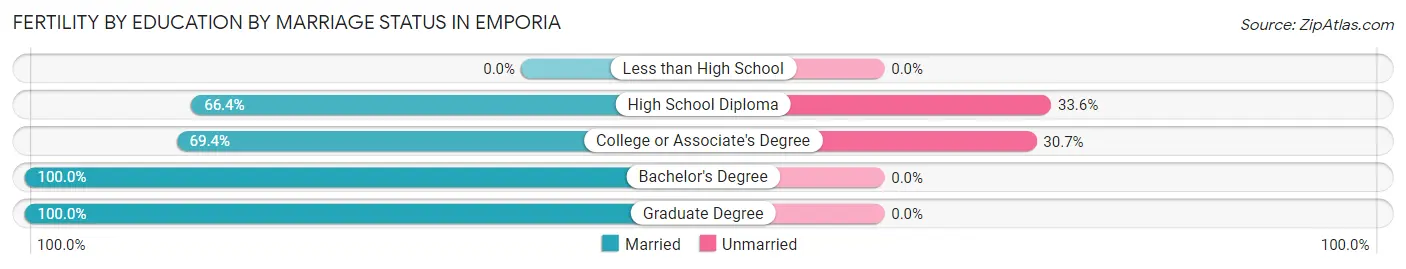
| Educational Attainment | Married | Unmarried |
| Less than High School | 0 (0.0%) | 0 (0.0%) |
| High School Diploma | 83 (66.4%) | 42 (33.6%) |
| College or Associate's Degree | 43 (69.4%) | 19 (30.6%) |
| Bachelor's Degree | 53 (100.0%) | 0 (0.0%) |
| Graduate Degree | 24 (100.0%) | 0 (0.0%) |
| Total | 203 (76.9%) | 61 (23.1%) |
Employment Characteristics in Emporia
Employment by Class of Employer in Emporia
Among the 12,160 employed individuals in Emporia, private company employees (8,349 | 68.7%), state government employees (1,037 | 8.5%), and not-for-profit organizations (1,014 | 8.3%) make up the most common classes of employment.
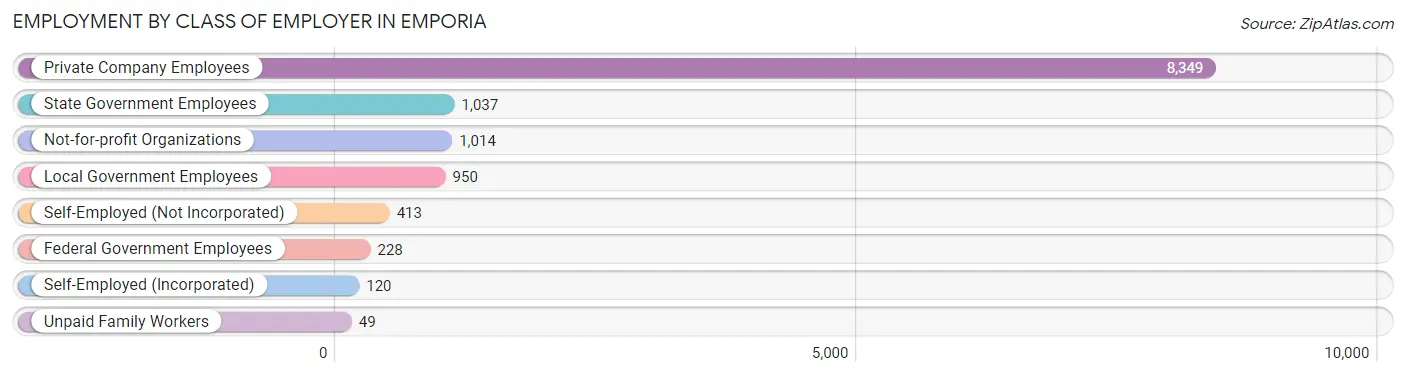
| Employer Class | # Employees | % Employees |
| Private Company Employees | 8,349 | 68.7% |
| Self-Employed (Incorporated) | 120 | 1.0% |
| Self-Employed (Not Incorporated) | 413 | 3.4% |
| Not-for-profit Organizations | 1,014 | 8.3% |
| Local Government Employees | 950 | 7.8% |
| State Government Employees | 1,037 | 8.5% |
| Federal Government Employees | 228 | 1.9% |
| Unpaid Family Workers | 49 | 0.4% |
| Total | 12,160 | 100.0% |
Employment Status by Age in Emporia
According to the labor force statistics for Emporia, out of the total population over 16 years of age (19,467), 68.6% or 13,354 individuals are in the labor force, with 3.2% or 427 of them unemployed. The age group with the highest labor force participation rate is 35 to 44 years, with 88.1% or 2,285 individuals in the labor force. Within the labor force, the 75 years and over age range has the highest percentage of unemployed individuals, with 31.3% or 15 of them being unemployed.
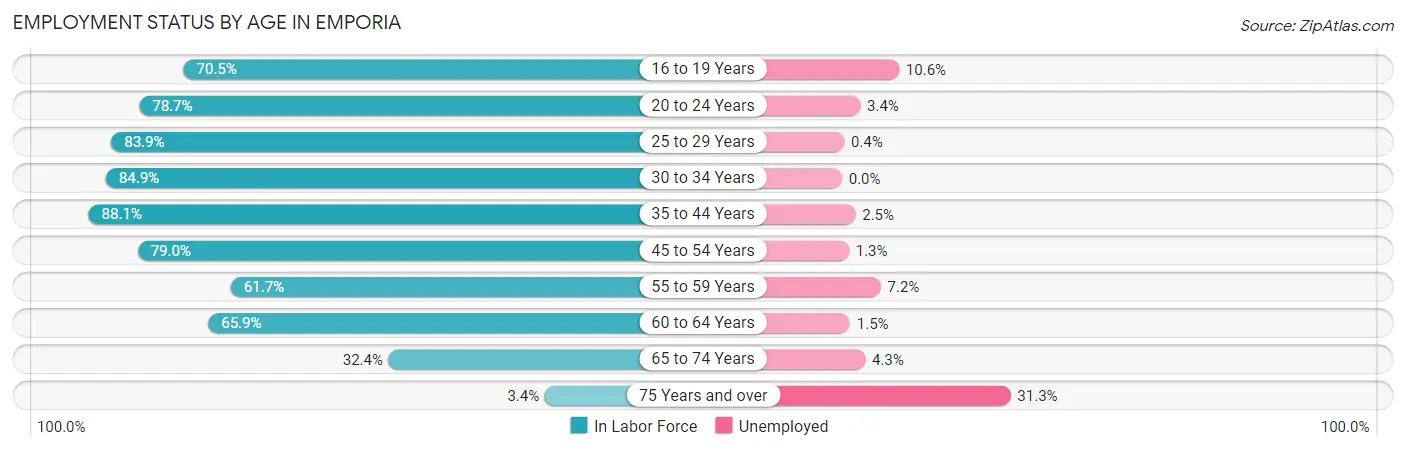
| Age Bracket | In Labor Force | Unemployed |
| 16 to 19 Years | 1,203 (70.5%) | 128 (10.6%) |
| 20 to 24 Years | 3,189 (78.7%) | 108 (3.4%) |
| 25 to 29 Years | 1,468 (83.9%) | 6 (0.4%) |
| 30 to 34 Years | 1,280 (84.9%) | 0 (0.0%) |
| 35 to 44 Years | 2,285 (88.1%) | 57 (2.5%) |
| 45 to 54 Years | 1,758 (79.0%) | 23 (1.3%) |
| 55 to 59 Years | 566 (61.7%) | 41 (7.2%) |
| 60 to 64 Years | 948 (65.9%) | 14 (1.5%) |
| 65 to 74 Years | 600 (32.4%) | 26 (4.3%) |
| 75 Years and over | 48 (3.4%) | 15 (31.3%) |
| Total | 13,354 (68.6%) | 427 (3.2%) |
Employment Status by Educational Attainment in Emporia
According to labor force statistics for Emporia, 79.6% of individuals (8,305) out of the total population between 25 and 64 years of age (10,434) are in the labor force, with 1.7% or 141 of them being unemployed. The group with the highest labor force participation rate are those with the educational attainment of college / associate degree, with 85.7% or 2,470 individuals in the labor force. Within the labor force, individuals with less than high school education have the highest percentage of unemployment, with 5.3% or 61 of them being unemployed.
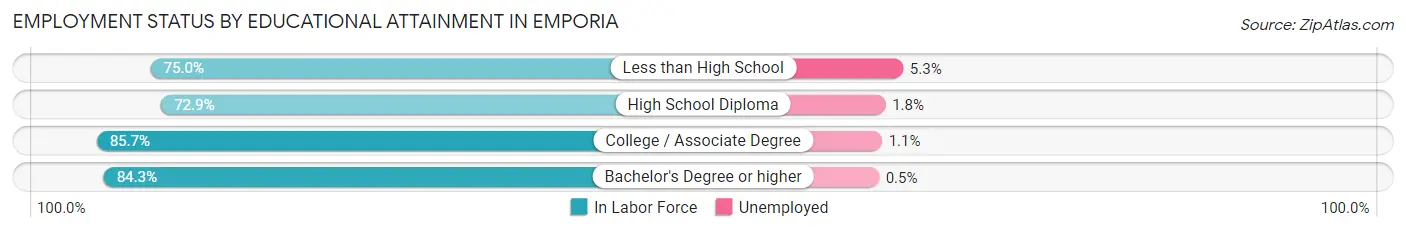
| Educational Attainment | In Labor Force | Unemployed |
| Less than High School | 1,145 (75.0%) | 81 (5.3%) |
| High School Diploma | 2,471 (72.9%) | 61 (1.8%) |
| College / Associate Degree | 2,470 (85.7%) | 32 (1.1%) |
| Bachelor's Degree or higher | 2,221 (84.3%) | 13 (0.5%) |
| Total | 8,305 (79.6%) | 177 (1.7%) |
Employment Occupations by Sex in Emporia
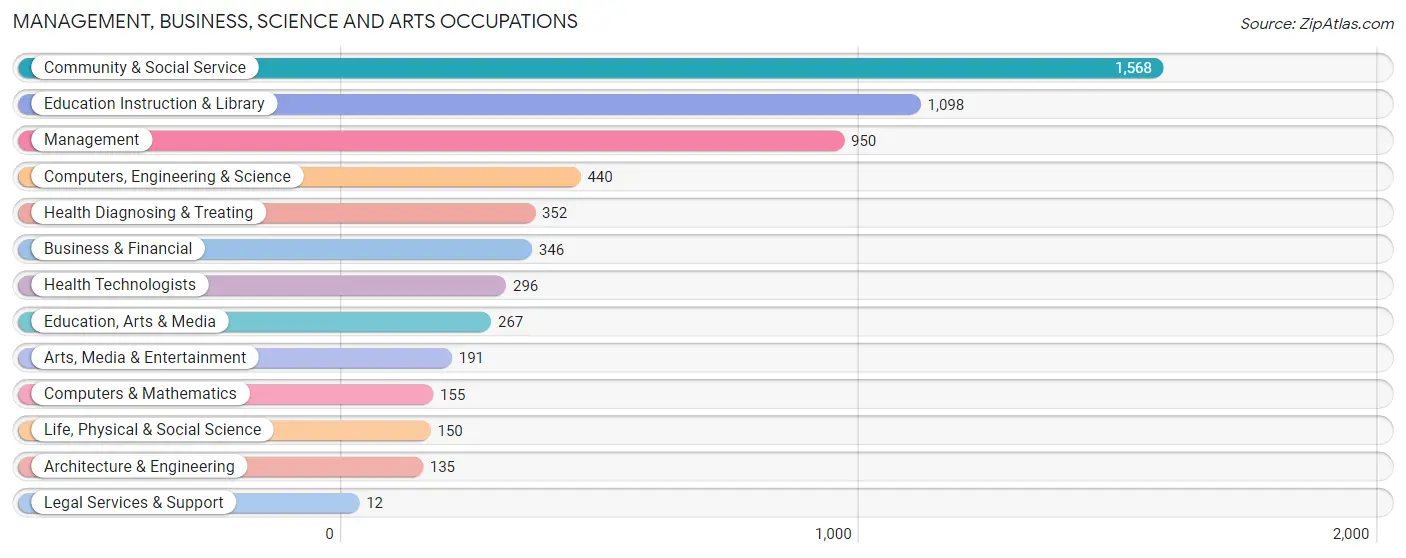
Management, Business, Science and Arts Occupations
The most common Management, Business, Science and Arts occupations in Emporia are Community & Social Service (1,568 | 12.2%), Education Instruction & Library (1,098 | 8.6%), Management (950 | 7.4%), Computers, Engineering & Science (440 | 3.4%), and Health Diagnosing & Treating (352 | 2.8%).
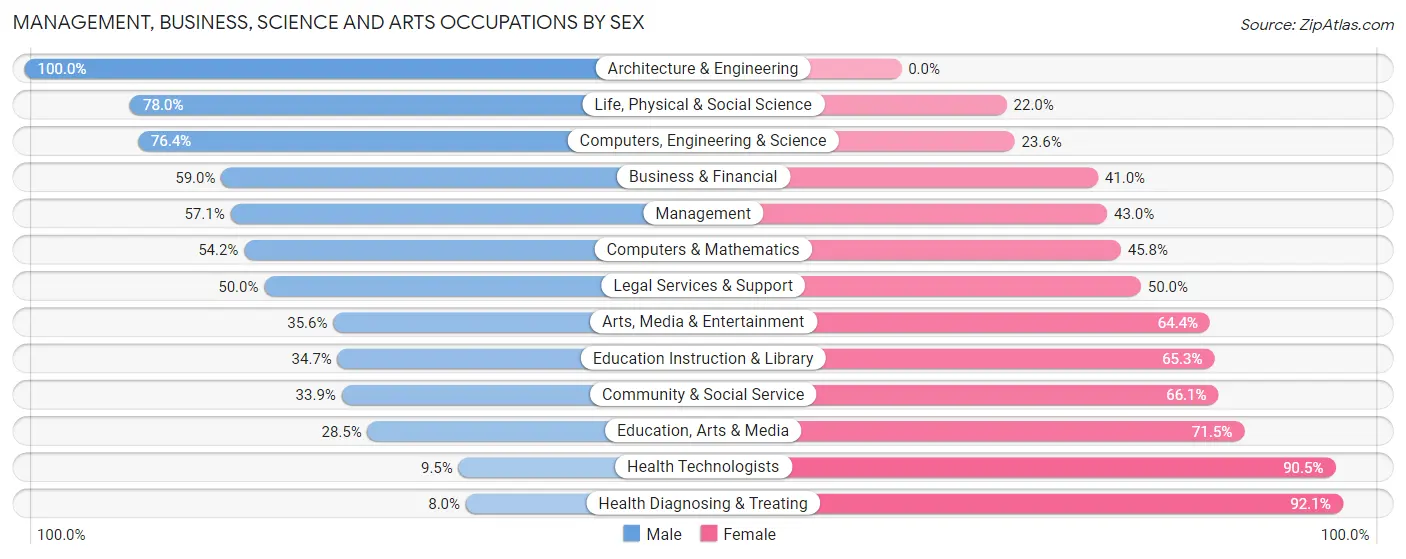
Management, Business, Science and Arts Occupations by Sex
Within the Management, Business, Science and Arts occupations in Emporia, the most male-oriented occupations are Architecture & Engineering (100.0%), Life, Physical & Social Science (78.0%), and Computers, Engineering & Science (76.4%), while the most female-oriented occupations are Health Diagnosing & Treating (92.0%), Health Technologists (90.5%), and Education, Arts & Media (71.5%).
| Occupation | Male | Female |
| Management | 542 (57.1%) | 408 (42.9%) |
| Business & Financial | 204 (59.0%) | 142 (41.0%) |
| Computers, Engineering & Science | 336 (76.4%) | 104 (23.6%) |
| Computers & Mathematics | 84 (54.2%) | 71 (45.8%) |
| Architecture & Engineering | 135 (100.0%) | 0 (0.0%) |
| Life, Physical & Social Science | 117 (78.0%) | 33 (22.0%) |
| Community & Social Service | 531 (33.9%) | 1,037 (66.1%) |
| Education, Arts & Media | 76 (28.5%) | 191 (71.5%) |
| Legal Services & Support | 6 (50.0%) | 6 (50.0%) |
| Education Instruction & Library | 381 (34.7%) | 717 (65.3%) |
| Arts, Media & Entertainment | 68 (35.6%) | 123 (64.4%) |
| Health Diagnosing & Treating | 28 (8.0%) | 324 (92.0%) |
| Health Technologists | 28 (9.5%) | 268 (90.5%) |
| Total (Category) | 1,641 (44.9%) | 2,015 (55.1%) |
| Total (Overall) | 6,624 (51.7%) | 6,199 (48.3%) |
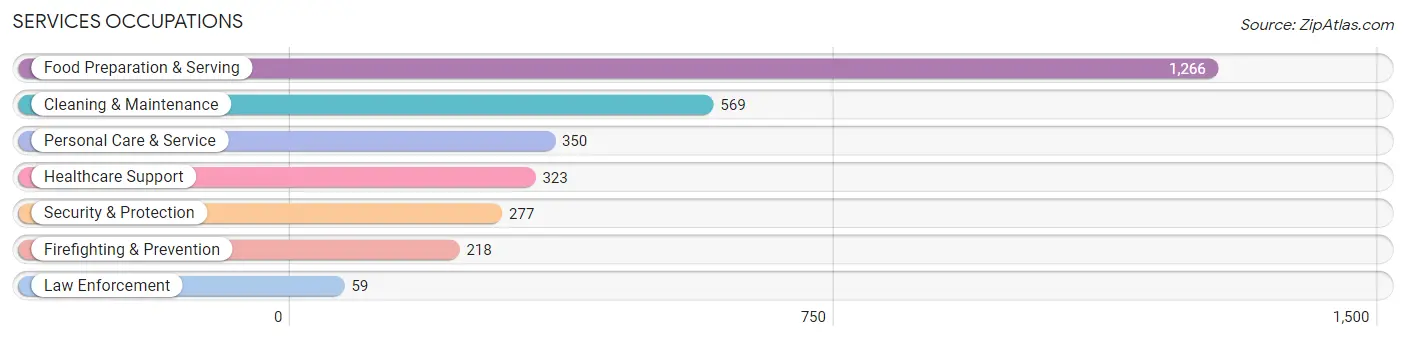
Services Occupations
The most common Services occupations in Emporia are Food Preparation & Serving (1,266 | 9.9%), Cleaning & Maintenance (569 | 4.4%), Personal Care & Service (350 | 2.7%), Healthcare Support (323 | 2.5%), and Security & Protection (277 | 2.2%).
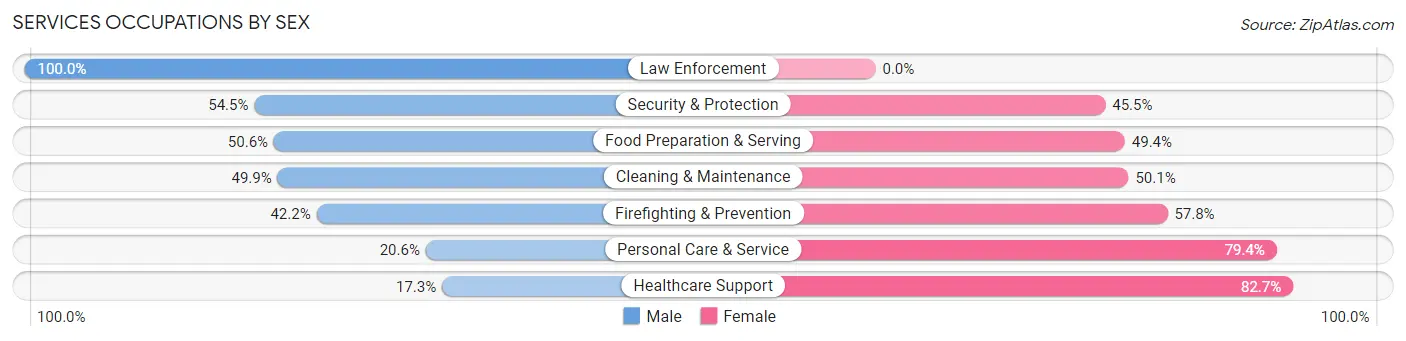
Services Occupations by Sex
Within the Services occupations in Emporia, the most male-oriented occupations are Law Enforcement (100.0%), Security & Protection (54.5%), and Food Preparation & Serving (50.6%), while the most female-oriented occupations are Healthcare Support (82.7%), Personal Care & Service (79.4%), and Firefighting & Prevention (57.8%).
| Occupation | Male | Female |
| Healthcare Support | 56 (17.3%) | 267 (82.7%) |
| Security & Protection | 151 (54.5%) | 126 (45.5%) |
| Firefighting & Prevention | 92 (42.2%) | 126 (57.8%) |
| Law Enforcement | 59 (100.0%) | 0 (0.0%) |
| Food Preparation & Serving | 641 (50.6%) | 625 (49.4%) |
| Cleaning & Maintenance | 284 (49.9%) | 285 (50.1%) |
| Personal Care & Service | 72 (20.6%) | 278 (79.4%) |
| Total (Category) | 1,204 (43.2%) | 1,581 (56.8%) |
| Total (Overall) | 6,624 (51.7%) | 6,199 (48.3%) |
Sales and Office Occupations
The most common Sales and Office occupations in Emporia are Office & Administration (1,275 | 9.9%), and Sales & Related (959 | 7.5%).

Sales and Office Occupations by Sex
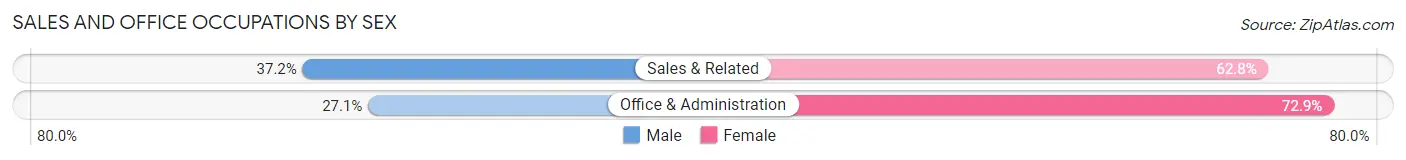
| Occupation | Male | Female |
| Sales & Related | 357 (37.2%) | 602 (62.8%) |
| Office & Administration | 346 (27.1%) | 929 (72.9%) |
| Total (Category) | 703 (31.5%) | 1,531 (68.5%) |
| Total (Overall) | 6,624 (51.7%) | 6,199 (48.3%) |
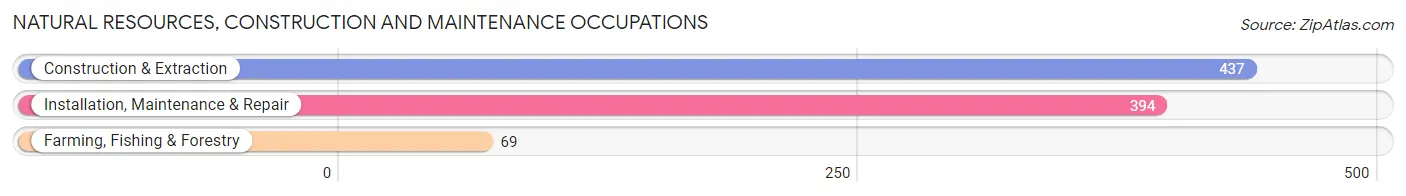
Natural Resources, Construction and Maintenance Occupations
The most common Natural Resources, Construction and Maintenance occupations in Emporia are Construction & Extraction (437 | 3.4%), Installation, Maintenance & Repair (394 | 3.1%), and Farming, Fishing & Forestry (69 | 0.5%).
Natural Resources, Construction and Maintenance Occupations by Sex
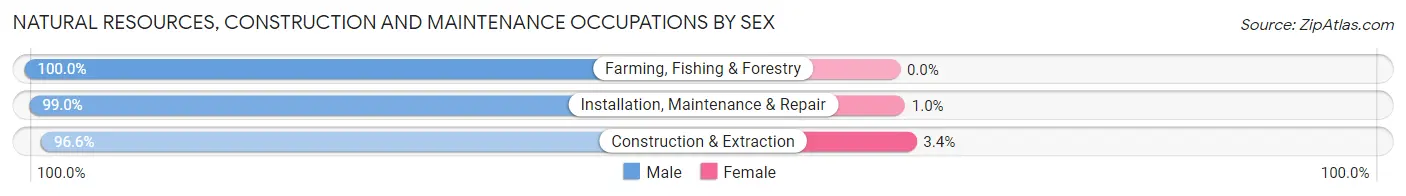
| Occupation | Male | Female |
| Farming, Fishing & Forestry | 69 (100.0%) | 0 (0.0%) |
| Construction & Extraction | 422 (96.6%) | 15 (3.4%) |
| Installation, Maintenance & Repair | 390 (99.0%) | 4 (1.0%) |
| Total (Category) | 881 (97.9%) | 19 (2.1%) |
| Total (Overall) | 6,624 (51.7%) | 6,199 (48.3%) |
Production, Transportation and Moving Occupations
The most common Production, Transportation and Moving occupations in Emporia are Production (1,431 | 11.2%), Material Moving (1,293 | 10.1%), and Transportation (524 | 4.1%).
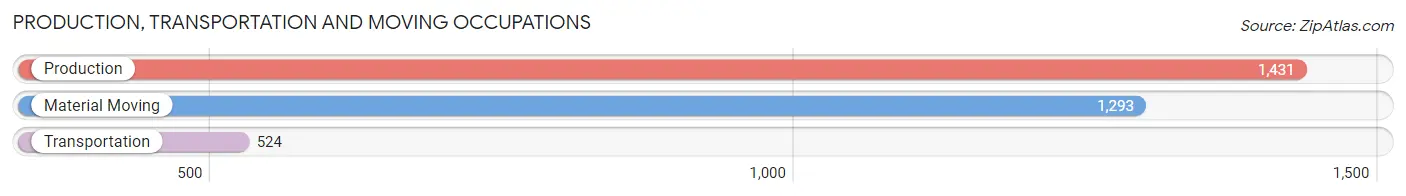
Production, Transportation and Moving Occupations by Sex
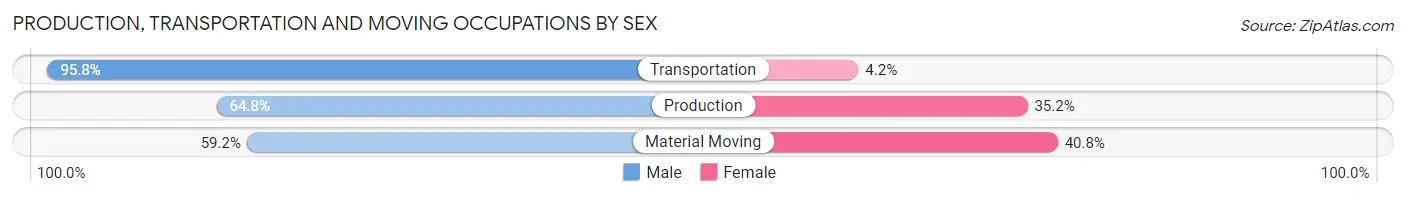
| Occupation | Male | Female |
| Production | 927 (64.8%) | 504 (35.2%) |
| Transportation | 502 (95.8%) | 22 (4.2%) |
| Material Moving | 766 (59.2%) | 527 (40.8%) |
| Total (Category) | 2,195 (67.6%) | 1,053 (32.4%) |
| Total (Overall) | 6,624 (51.7%) | 6,199 (48.3%) |
Employment Industries by Sex in Emporia
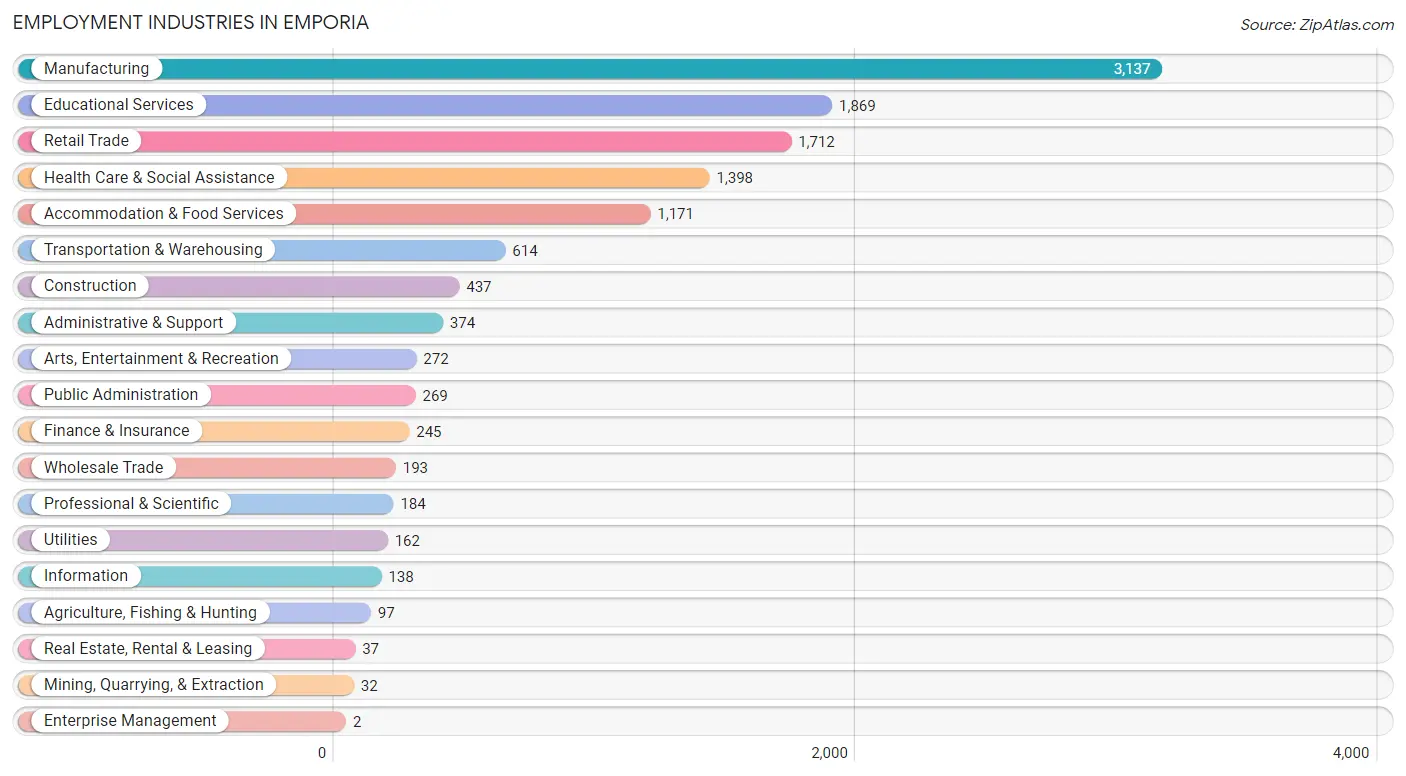
Employment Industries in Emporia
The major employment industries in Emporia include Manufacturing (3,137 | 24.5%), Educational Services (1,869 | 14.6%), Retail Trade (1,712 | 13.4%), Health Care & Social Assistance (1,398 | 10.9%), and Accommodation & Food Services (1,171 | 9.1%).
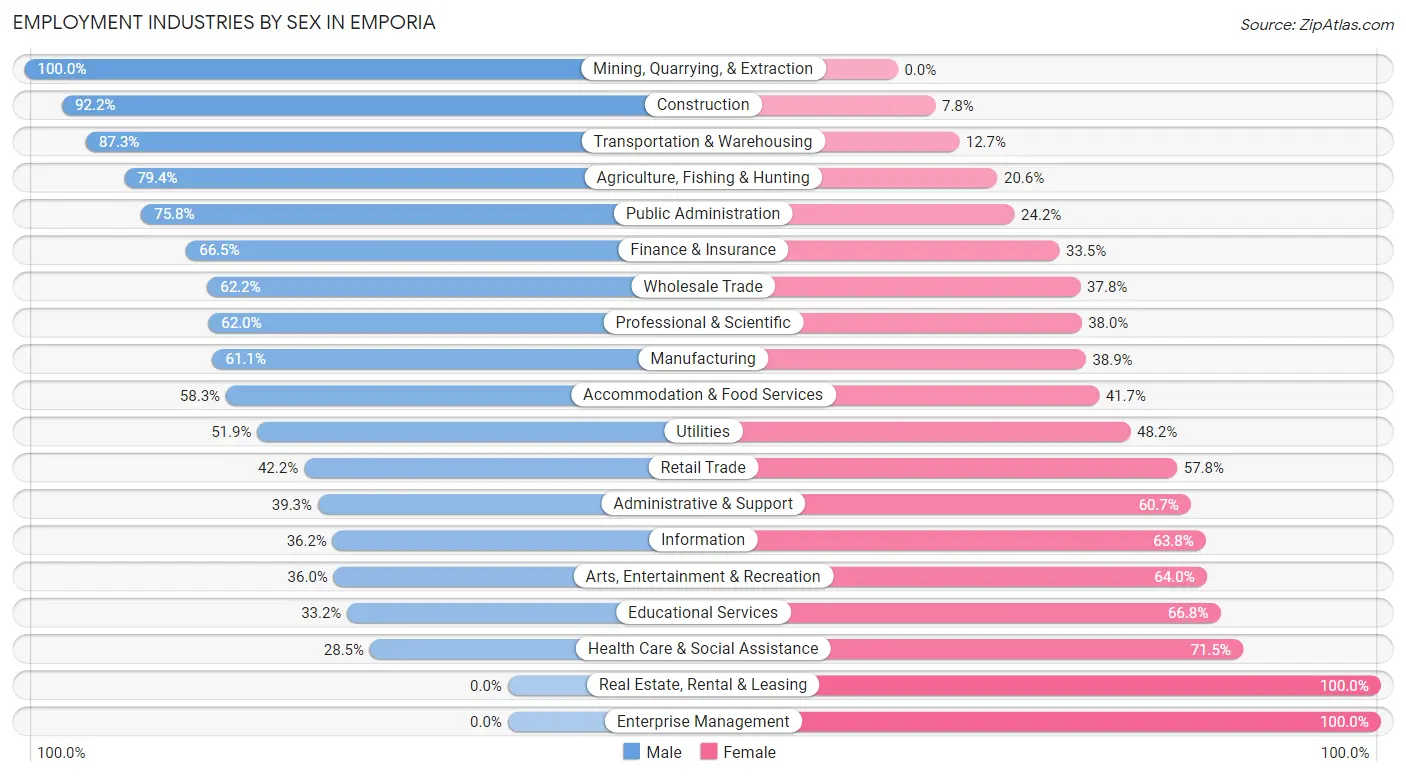
Employment Industries by Sex in Emporia
The Emporia industries that see more men than women are Mining, Quarrying, & Extraction (100.0%), Construction (92.2%), and Transportation & Warehousing (87.3%), whereas the industries that tend to have a higher number of women are Real Estate, Rental & Leasing (100.0%), Enterprise Management (100.0%), and Health Care & Social Assistance (71.5%).
| Industry | Male | Female |
| Agriculture, Fishing & Hunting | 77 (79.4%) | 20 (20.6%) |
| Mining, Quarrying, & Extraction | 32 (100.0%) | 0 (0.0%) |
| Construction | 403 (92.2%) | 34 (7.8%) |
| Manufacturing | 1,916 (61.1%) | 1,221 (38.9%) |
| Wholesale Trade | 120 (62.2%) | 73 (37.8%) |
| Retail Trade | 722 (42.2%) | 990 (57.8%) |
| Transportation & Warehousing | 536 (87.3%) | 78 (12.7%) |
| Utilities | 84 (51.8%) | 78 (48.1%) |
| Information | 50 (36.2%) | 88 (63.8%) |
| Finance & Insurance | 163 (66.5%) | 82 (33.5%) |
| Real Estate, Rental & Leasing | 0 (0.0%) | 37 (100.0%) |
| Professional & Scientific | 114 (62.0%) | 70 (38.0%) |
| Enterprise Management | 0 (0.0%) | 2 (100.0%) |
| Administrative & Support | 147 (39.3%) | 227 (60.7%) |
| Educational Services | 621 (33.2%) | 1,248 (66.8%) |
| Health Care & Social Assistance | 399 (28.5%) | 999 (71.5%) |
| Arts, Entertainment & Recreation | 98 (36.0%) | 174 (64.0%) |
| Accommodation & Food Services | 683 (58.3%) | 488 (41.7%) |
| Public Administration | 204 (75.8%) | 65 (24.2%) |
| Total | 6,624 (51.7%) | 6,199 (48.3%) |
Education in Emporia
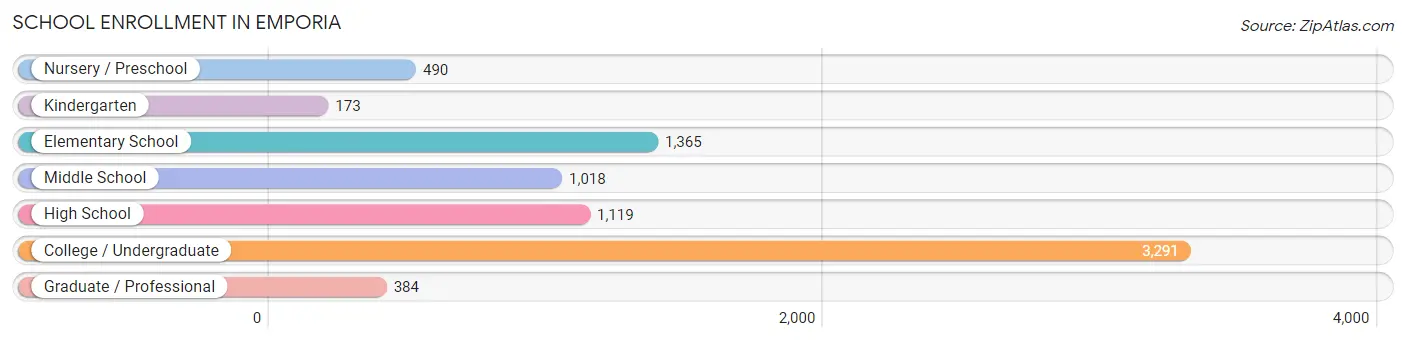
School Enrollment in Emporia
The most common levels of schooling among the 7,840 students in Emporia are college / undergraduate (3,291 | 42.0%), elementary school (1,365 | 17.4%), and high school (1,119 | 14.3%).
| School Level | # Students | % Students |
| Nursery / Preschool | 490 | 6.2% |
| Kindergarten | 173 | 2.2% |
| Elementary School | 1,365 | 17.4% |
| Middle School | 1,018 | 13.0% |
| High School | 1,119 | 14.3% |
| College / Undergraduate | 3,291 | 42.0% |
| Graduate / Professional | 384 | 4.9% |
| Total | 7,840 | 100.0% |
School Enrollment by Age by Funding Source in Emporia
Out of a total of 7,840 students who are enrolled in schools in Emporia, 314 (4.0%) attend a private institution, while the remaining 7,526 (96.0%) are enrolled in public schools. The age group of 3 to 4 year olds has the highest likelihood of being enrolled in private schools, with 114 (33.0% in the age bracket) enrolled. Conversely, the age group of 20 to 24 year olds has the lowest likelihood of being enrolled in a private school, with 2,305 (98.8% in the age bracket) attending a public institution.
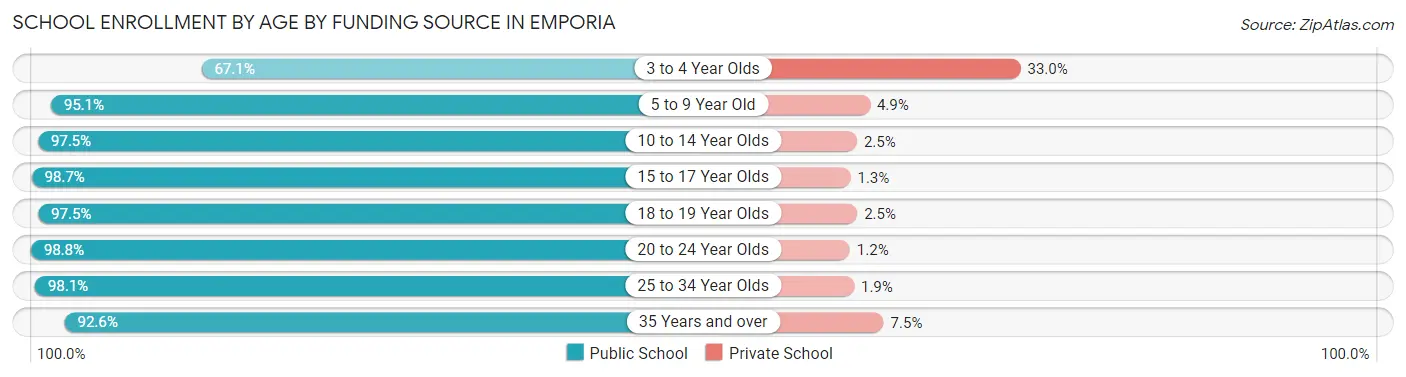
| Age Bracket | Public School | Private School |
| 3 to 4 Year Olds | 232 (67.0%) | 114 (33.0%) |
| 5 to 9 Year Old | 1,419 (95.1%) | 73 (4.9%) |
| 10 to 14 Year Olds | 1,300 (97.5%) | 33 (2.5%) |
| 15 to 17 Year Olds | 774 (98.7%) | 10 (1.3%) |
| 18 to 19 Year Olds | 846 (97.5%) | 22 (2.5%) |
| 20 to 24 Year Olds | 2,305 (98.8%) | 27 (1.2%) |
| 25 to 34 Year Olds | 356 (98.1%) | 7 (1.9%) |
| 35 Years and over | 298 (92.5%) | 24 (7.4%) |
| Total | 7,526 (96.0%) | 314 (4.0%) |
Educational Attainment by Field of Study in Emporia
Education (765 | 20.4%), business (709 | 18.9%), science & technology (492 | 13.1%), bio, nature & agricultural (385 | 10.2%), and arts & humanities (296 | 7.9%) are the most common fields of study among 3,756 individuals in Emporia who have obtained a bachelor's degree or higher.
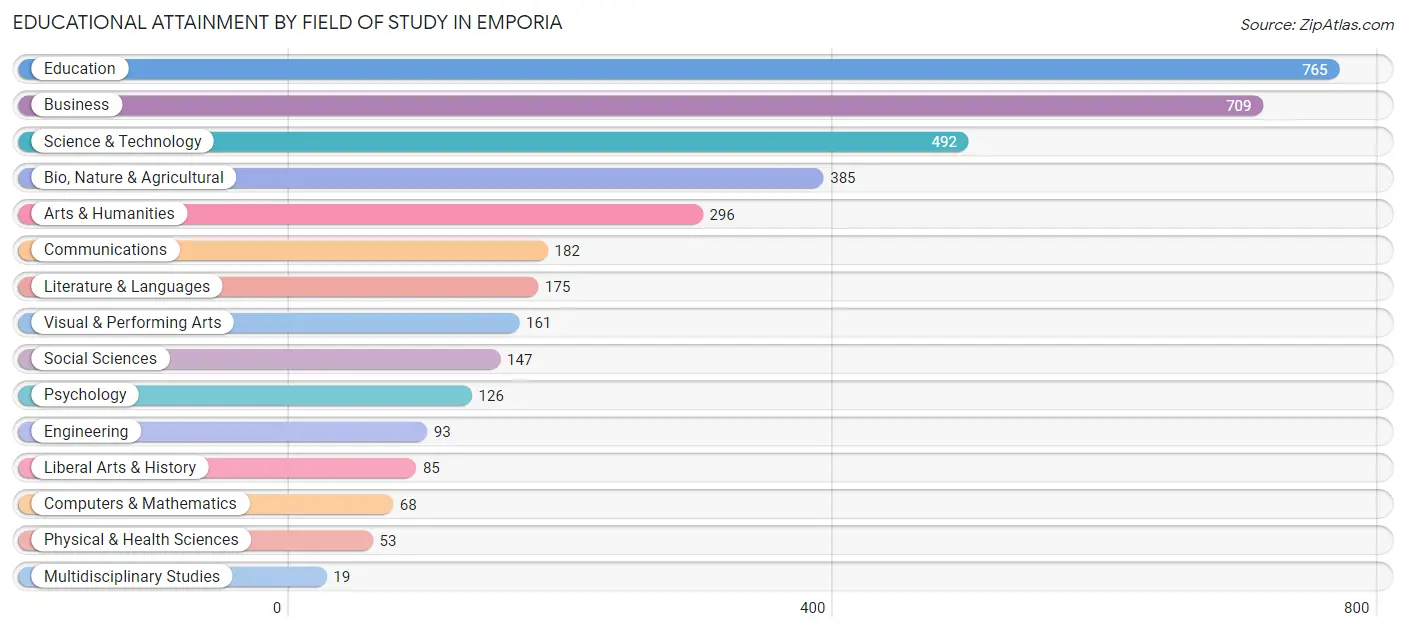
| Field of Study | # Graduates | % Graduates |
| Computers & Mathematics | 68 | 1.8% |
| Bio, Nature & Agricultural | 385 | 10.2% |
| Physical & Health Sciences | 53 | 1.4% |
| Psychology | 126 | 3.4% |
| Social Sciences | 147 | 3.9% |
| Engineering | 93 | 2.5% |
| Multidisciplinary Studies | 19 | 0.5% |
| Science & Technology | 492 | 13.1% |
| Business | 709 | 18.9% |
| Education | 765 | 20.4% |
| Literature & Languages | 175 | 4.7% |
| Liberal Arts & History | 85 | 2.3% |
| Visual & Performing Arts | 161 | 4.3% |
| Communications | 182 | 4.9% |
| Arts & Humanities | 296 | 7.9% |
| Total | 3,756 | 100.0% |
Transportation & Commute in Emporia
Vehicle Availability by Sex in Emporia
The most prevalent vehicle ownership categories in Emporia are males with 2 vehicles (2,875, accounting for 45.5%) and females with 2 vehicles (2,474, making up 51.8%).
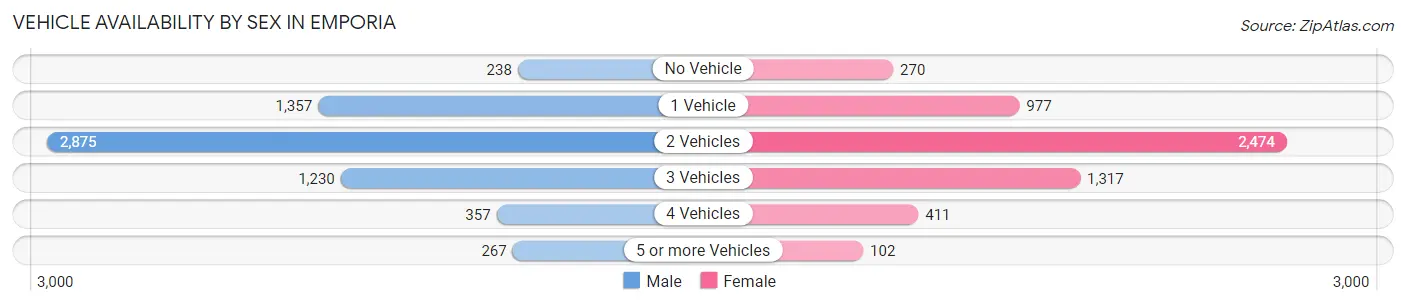
| Vehicles Available | Male | Female |
| No Vehicle | 238 (3.8%) | 270 (4.9%) |
| 1 Vehicle | 1,357 (21.5%) | 977 (17.6%) |
| 2 Vehicles | 2,875 (45.5%) | 2,474 (44.6%) |
| 3 Vehicles | 1,230 (19.5%) | 1,317 (23.7%) |
| 4 Vehicles | 357 (5.7%) | 411 (7.4%) |
| 5 or more Vehicles | 267 (4.2%) | 102 (1.8%) |
| Total | 6,324 (100.0%) | 5,551 (100.0%) |
Commute Time in Emporia
The most frequently occuring commute durations in Emporia are 5 to 9 minutes (4,957 commuters, 42.4%), 10 to 14 minutes (3,383 commuters, 28.9%), and less than 5 minutes (1,280 commuters, 11.0%).
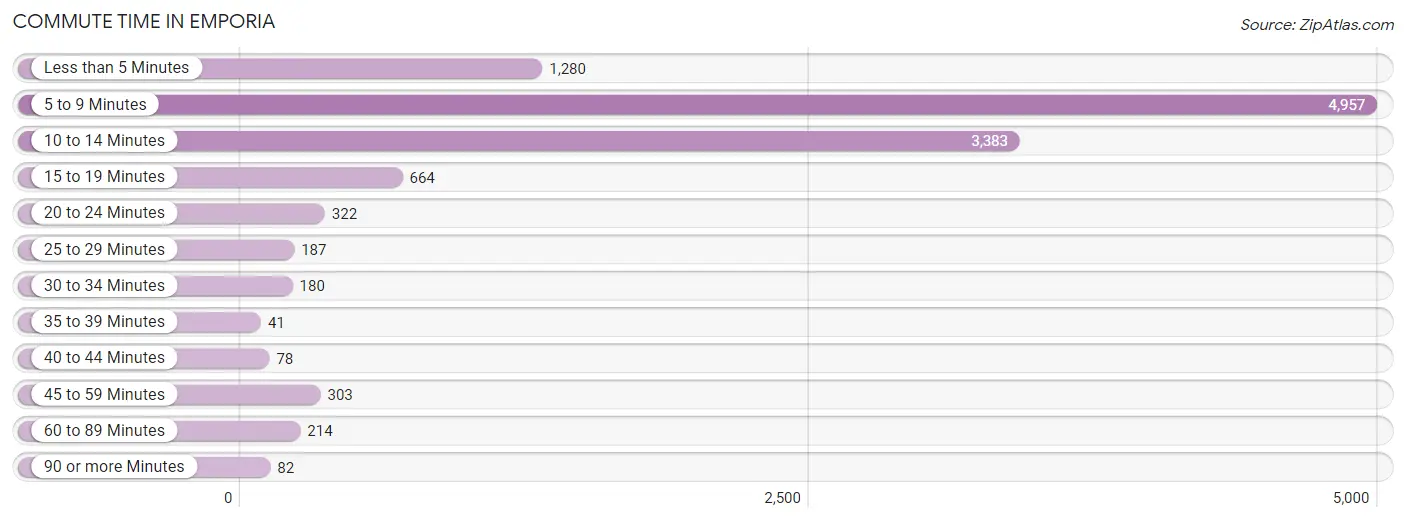
| Commute Time | # Commuters | % Commuters |
| Less than 5 Minutes | 1,280 | 11.0% |
| 5 to 9 Minutes | 4,957 | 42.4% |
| 10 to 14 Minutes | 3,383 | 28.9% |
| 15 to 19 Minutes | 664 | 5.7% |
| 20 to 24 Minutes | 322 | 2.8% |
| 25 to 29 Minutes | 187 | 1.6% |
| 30 to 34 Minutes | 180 | 1.5% |
| 35 to 39 Minutes | 41 | 0.4% |
| 40 to 44 Minutes | 78 | 0.7% |
| 45 to 59 Minutes | 303 | 2.6% |
| 60 to 89 Minutes | 214 | 1.8% |
| 90 or more Minutes | 82 | 0.7% |
Commute Time by Sex in Emporia
The most common commute times in Emporia are 5 to 9 minutes (2,378 commuters, 38.2%) for males and 5 to 9 minutes (2,579 commuters, 47.2%) for females.
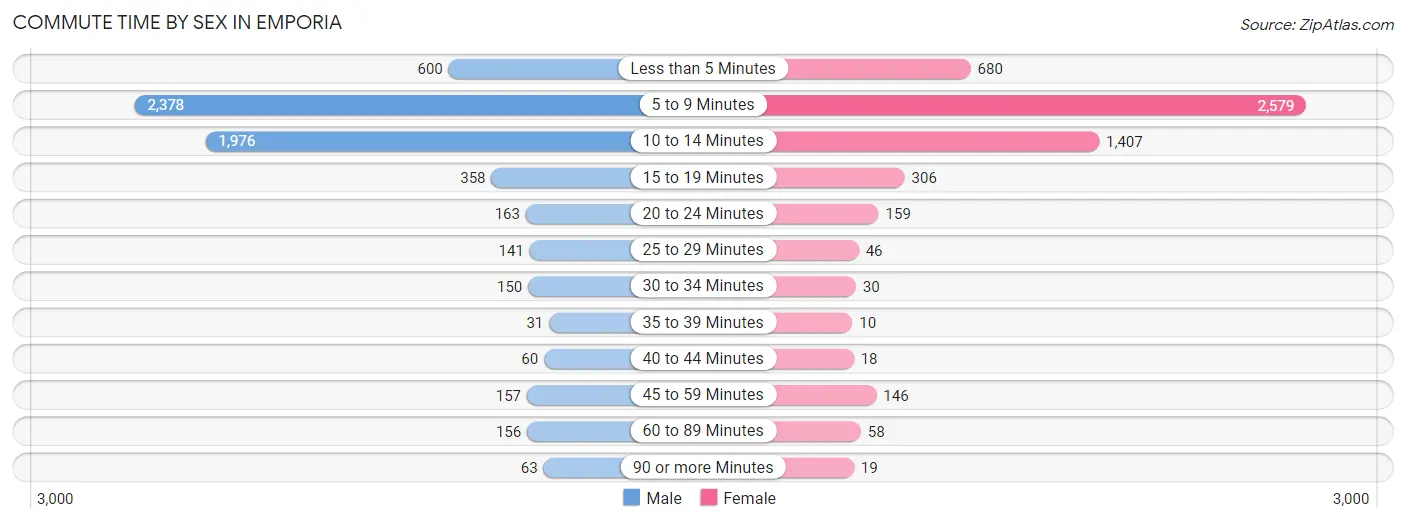
| Commute Time | Male | Female |
| Less than 5 Minutes | 600 (9.6%) | 680 (12.5%) |
| 5 to 9 Minutes | 2,378 (38.2%) | 2,579 (47.2%) |
| 10 to 14 Minutes | 1,976 (31.7%) | 1,407 (25.8%) |
| 15 to 19 Minutes | 358 (5.7%) | 306 (5.6%) |
| 20 to 24 Minutes | 163 (2.6%) | 159 (2.9%) |
| 25 to 29 Minutes | 141 (2.3%) | 46 (0.8%) |
| 30 to 34 Minutes | 150 (2.4%) | 30 (0.5%) |
| 35 to 39 Minutes | 31 (0.5%) | 10 (0.2%) |
| 40 to 44 Minutes | 60 (1.0%) | 18 (0.3%) |
| 45 to 59 Minutes | 157 (2.5%) | 146 (2.7%) |
| 60 to 89 Minutes | 156 (2.5%) | 58 (1.1%) |
| 90 or more Minutes | 63 (1.0%) | 19 (0.4%) |
Time of Departure to Work by Sex in Emporia
The most frequent times of departure to work in Emporia are 7:30 AM to 7:59 AM (998, 16.0%) for males and 7:30 AM to 7:59 AM (816, 14.9%) for females.
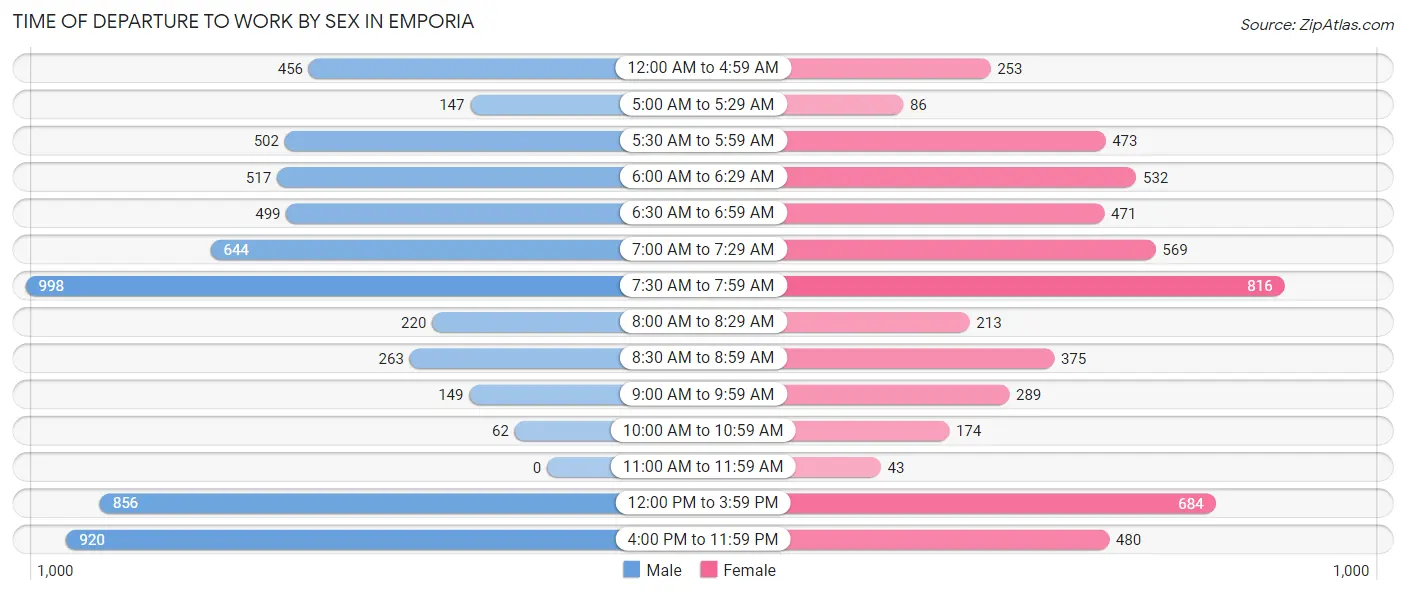
| Time of Departure | Male | Female |
| 12:00 AM to 4:59 AM | 456 (7.3%) | 253 (4.6%) |
| 5:00 AM to 5:29 AM | 147 (2.4%) | 86 (1.6%) |
| 5:30 AM to 5:59 AM | 502 (8.1%) | 473 (8.7%) |
| 6:00 AM to 6:29 AM | 517 (8.3%) | 532 (9.8%) |
| 6:30 AM to 6:59 AM | 499 (8.0%) | 471 (8.6%) |
| 7:00 AM to 7:29 AM | 644 (10.3%) | 569 (10.4%) |
| 7:30 AM to 7:59 AM | 998 (16.0%) | 816 (14.9%) |
| 8:00 AM to 8:29 AM | 220 (3.5%) | 213 (3.9%) |
| 8:30 AM to 8:59 AM | 263 (4.2%) | 375 (6.9%) |
| 9:00 AM to 9:59 AM | 149 (2.4%) | 289 (5.3%) |
| 10:00 AM to 10:59 AM | 62 (1.0%) | 174 (3.2%) |
| 11:00 AM to 11:59 AM | 0 (0.0%) | 43 (0.8%) |
| 12:00 PM to 3:59 PM | 856 (13.7%) | 684 (12.5%) |
| 4:00 PM to 11:59 PM | 920 (14.8%) | 480 (8.8%) |
| Total | 6,233 (100.0%) | 5,458 (100.0%) |
Housing Occupancy in Emporia
Occupancy by Ownership in Emporia
Of the total 10,037 dwellings in Emporia, owner-occupied units account for 5,016 (50.0%), while renter-occupied units make up 5,021 (50.0%).
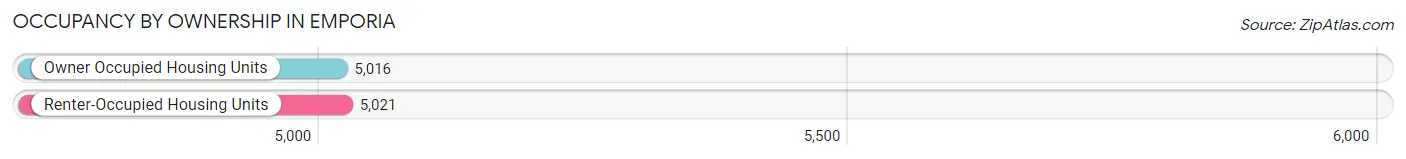
| Occupancy | # Housing Units | % Housing Units |
| Owner Occupied Housing Units | 5,016 | 50.0% |
| Renter-Occupied Housing Units | 5,021 | 50.0% |
| Total Occupied Housing Units | 10,037 | 100.0% |
Occupancy by Household Size in Emporia
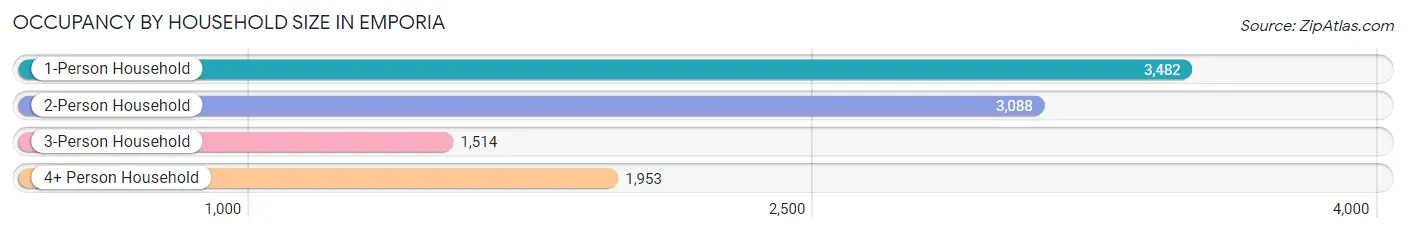
| Household Size | # Housing Units | % Housing Units |
| 1-Person Household | 3,482 | 34.7% |
| 2-Person Household | 3,088 | 30.8% |
| 3-Person Household | 1,514 | 15.1% |
| 4+ Person Household | 1,953 | 19.5% |
| Total Housing Units | 10,037 | 100.0% |
Occupancy by Ownership by Household Size in Emporia
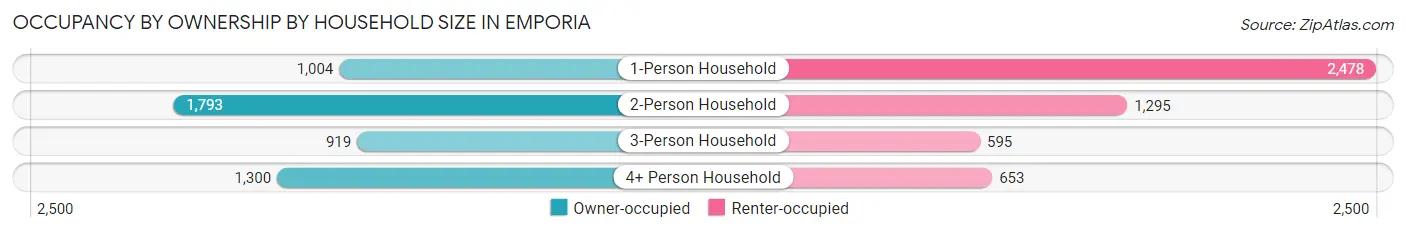
| Household Size | Owner-occupied | Renter-occupied |
| 1-Person Household | 1,004 (28.8%) | 2,478 (71.2%) |
| 2-Person Household | 1,793 (58.1%) | 1,295 (41.9%) |
| 3-Person Household | 919 (60.7%) | 595 (39.3%) |
| 4+ Person Household | 1,300 (66.6%) | 653 (33.4%) |
| Total Housing Units | 5,016 (50.0%) | 5,021 (50.0%) |
Occupancy by Educational Attainment in Emporia
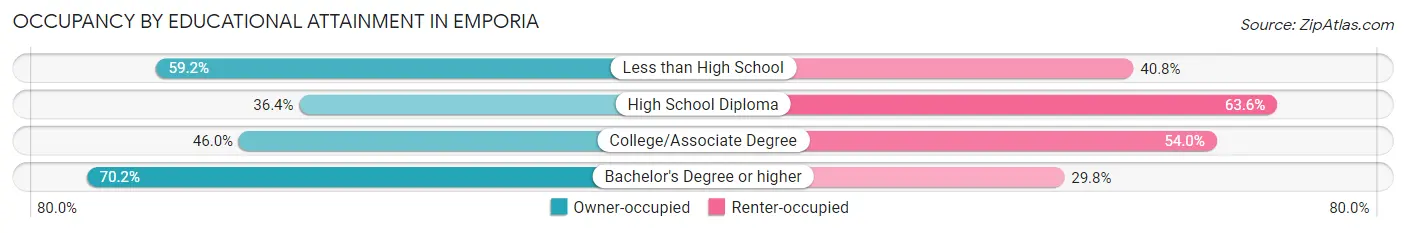
| Household Size | Owner-occupied | Renter-occupied |
| Less than High School | 633 (59.2%) | 436 (40.8%) |
| High School Diploma | 1,188 (36.4%) | 2,074 (63.6%) |
| College/Associate Degree | 1,540 (46.0%) | 1,807 (54.0%) |
| Bachelor's Degree or higher | 1,655 (70.2%) | 704 (29.8%) |
Occupancy by Age of Householder in Emporia
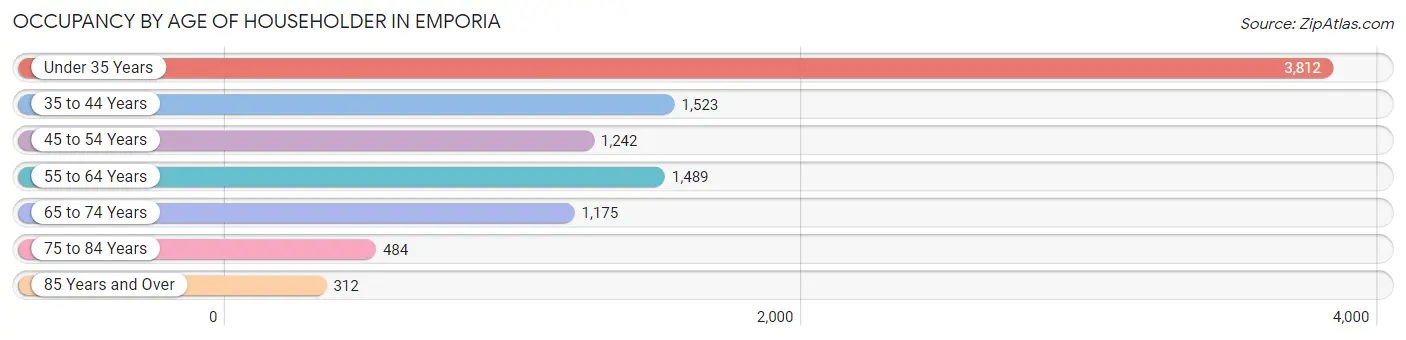
| Age Bracket | # Households | % Households |
| Under 35 Years | 3,812 | 38.0% |
| 35 to 44 Years | 1,523 | 15.2% |
| 45 to 54 Years | 1,242 | 12.4% |
| 55 to 64 Years | 1,489 | 14.8% |
| 65 to 74 Years | 1,175 | 11.7% |
| 75 to 84 Years | 484 | 4.8% |
| 85 Years and Over | 312 | 3.1% |
| Total | 10,037 | 100.0% |
Housing Finances in Emporia
Median Income by Occupancy in Emporia
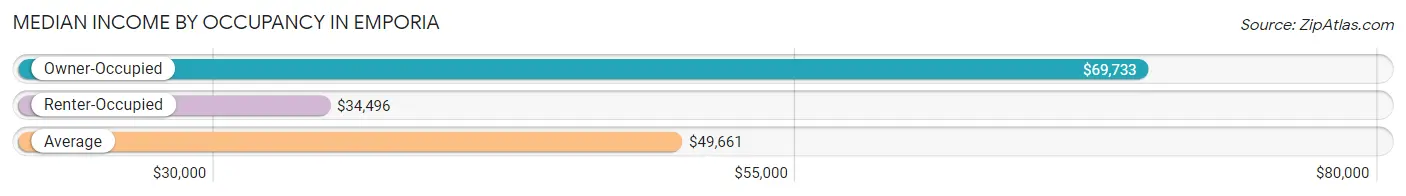
| Occupancy Type | # Households | Median Income |
| Owner-Occupied | 5,016 (50.0%) | $69,733 |
| Renter-Occupied | 5,021 (50.0%) | $34,496 |
| Average | 10,037 (100.0%) | $49,661 |
Occupancy by Householder Income Bracket in Emporia
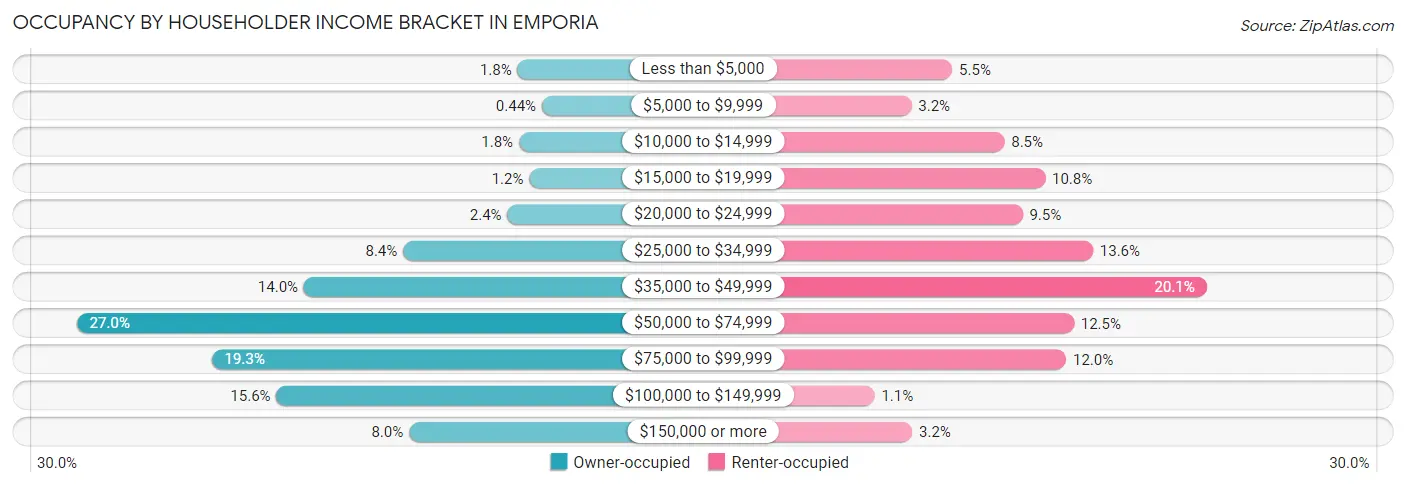
| Income Bracket | Owner-occupied | Renter-occupied |
| Less than $5,000 | 92 (1.8%) | 277 (5.5%) |
| $5,000 to $9,999 | 22 (0.4%) | 160 (3.2%) |
| $10,000 to $14,999 | 88 (1.8%) | 427 (8.5%) |
| $15,000 to $19,999 | 58 (1.2%) | 544 (10.8%) |
| $20,000 to $24,999 | 121 (2.4%) | 479 (9.5%) |
| $25,000 to $34,999 | 420 (8.4%) | 681 (13.6%) |
| $35,000 to $49,999 | 704 (14.0%) | 1,007 (20.1%) |
| $50,000 to $74,999 | 1,356 (27.0%) | 626 (12.5%) |
| $75,000 to $99,999 | 969 (19.3%) | 604 (12.0%) |
| $100,000 to $149,999 | 783 (15.6%) | 54 (1.1%) |
| $150,000 or more | 403 (8.0%) | 162 (3.2%) |
| Total | 5,016 (100.0%) | 5,021 (100.0%) |
Monthly Housing Cost Tiers in Emporia
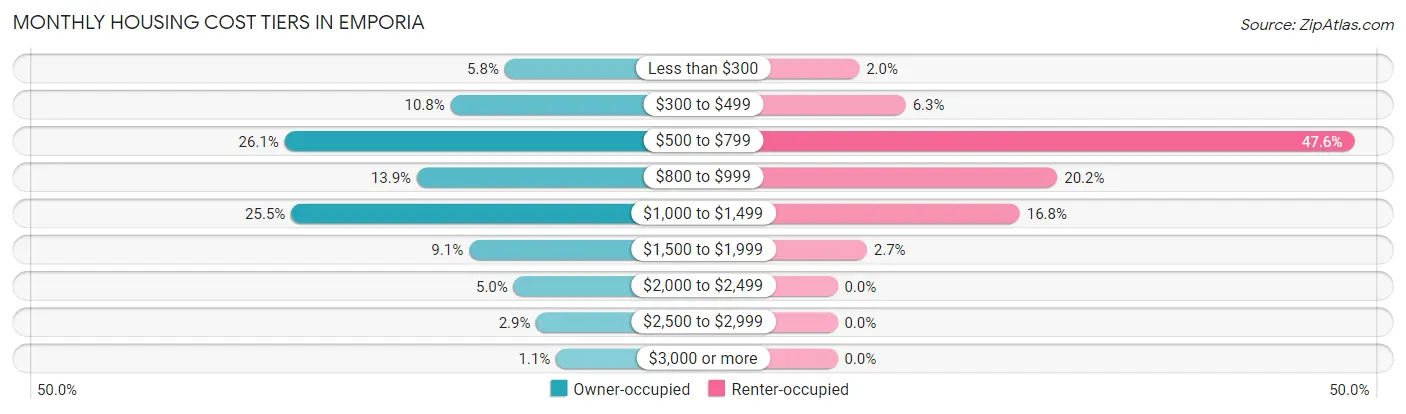
| Monthly Cost | Owner-occupied | Renter-occupied |
| Less than $300 | 291 (5.8%) | 101 (2.0%) |
| $300 to $499 | 541 (10.8%) | 316 (6.3%) |
| $500 to $799 | 1,307 (26.1%) | 2,388 (47.6%) |
| $800 to $999 | 696 (13.9%) | 1,016 (20.2%) |
| $1,000 to $1,499 | 1,277 (25.5%) | 843 (16.8%) |
| $1,500 to $1,999 | 456 (9.1%) | 136 (2.7%) |
| $2,000 to $2,499 | 250 (5.0%) | 0 (0.0%) |
| $2,500 to $2,999 | 145 (2.9%) | 0 (0.0%) |
| $3,000 or more | 53 (1.1%) | 0 (0.0%) |
| Total | 5,016 (100.0%) | 5,021 (100.0%) |
Physical Housing Characteristics in Emporia
Housing Structures in Emporia
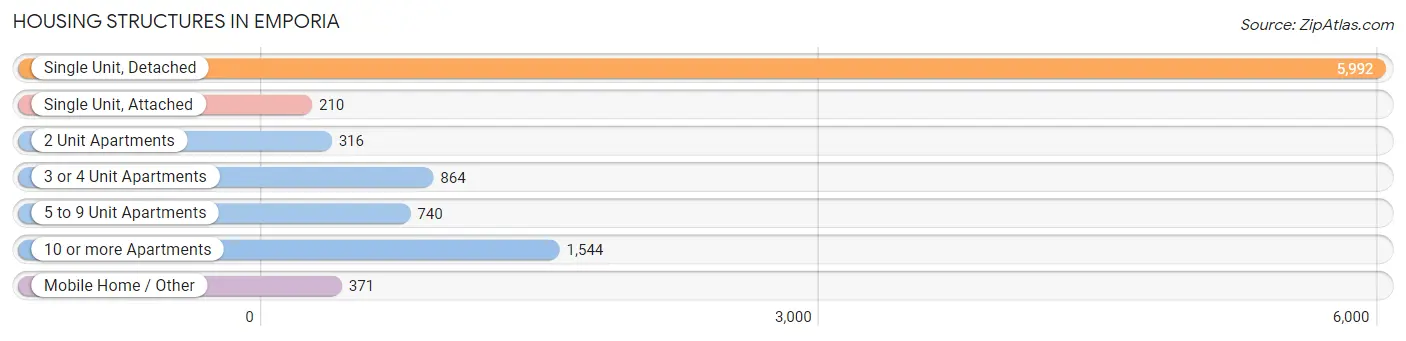
| Structure Type | # Housing Units | % Housing Units |
| Single Unit, Detached | 5,992 | 59.7% |
| Single Unit, Attached | 210 | 2.1% |
| 2 Unit Apartments | 316 | 3.2% |
| 3 or 4 Unit Apartments | 864 | 8.6% |
| 5 to 9 Unit Apartments | 740 | 7.4% |
| 10 or more Apartments | 1,544 | 15.4% |
| Mobile Home / Other | 371 | 3.7% |
| Total | 10,037 | 100.0% |
Housing Structures by Occupancy in Emporia
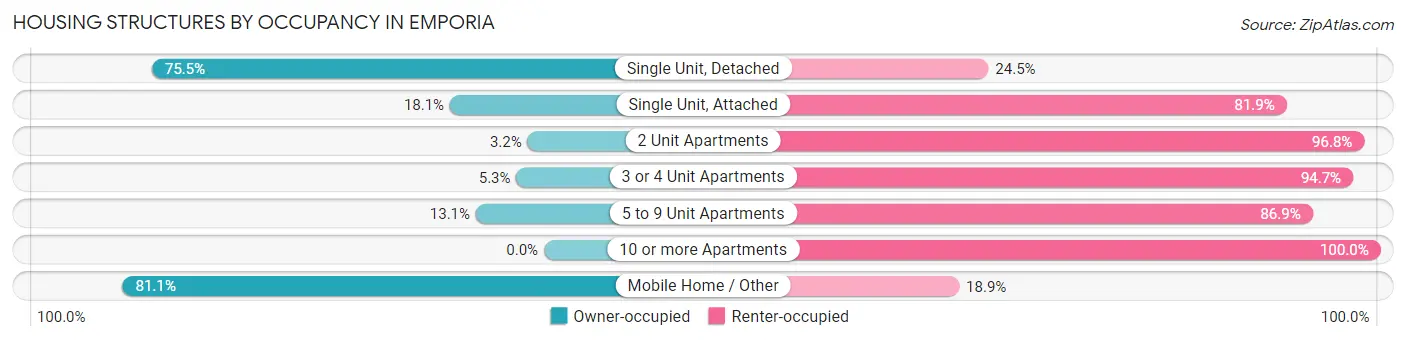
| Structure Type | Owner-occupied | Renter-occupied |
| Single Unit, Detached | 4,524 (75.5%) | 1,468 (24.5%) |
| Single Unit, Attached | 38 (18.1%) | 172 (81.9%) |
| 2 Unit Apartments | 10 (3.2%) | 306 (96.8%) |
| 3 or 4 Unit Apartments | 46 (5.3%) | 818 (94.7%) |
| 5 to 9 Unit Apartments | 97 (13.1%) | 643 (86.9%) |
| 10 or more Apartments | 0 (0.0%) | 1,544 (100.0%) |
| Mobile Home / Other | 301 (81.1%) | 70 (18.9%) |
| Total | 5,016 (50.0%) | 5,021 (50.0%) |
Housing Structures by Number of Rooms in Emporia
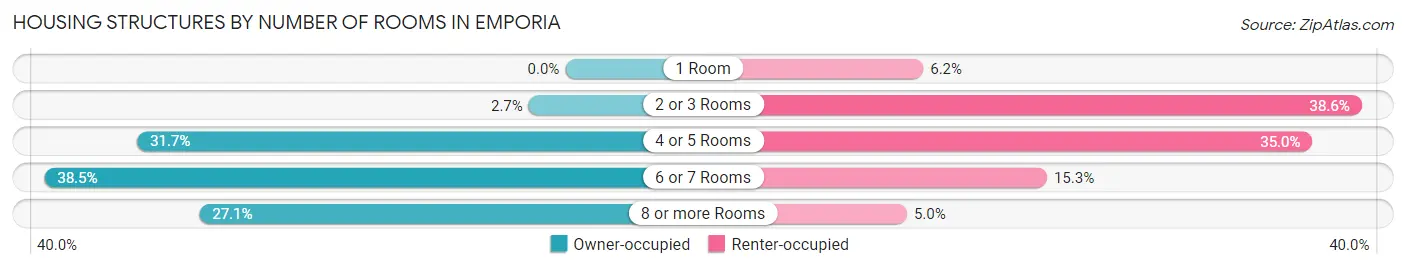
| Number of Rooms | Owner-occupied | Renter-occupied |
| 1 Room | 0 (0.0%) | 310 (6.2%) |
| 2 or 3 Rooms | 136 (2.7%) | 1,938 (38.6%) |
| 4 or 5 Rooms | 1,589 (31.7%) | 1,755 (34.9%) |
| 6 or 7 Rooms | 1,933 (38.5%) | 769 (15.3%) |
| 8 or more Rooms | 1,358 (27.1%) | 249 (5.0%) |
| Total | 5,016 (100.0%) | 5,021 (100.0%) |
Housing Structure by Heating Type in Emporia
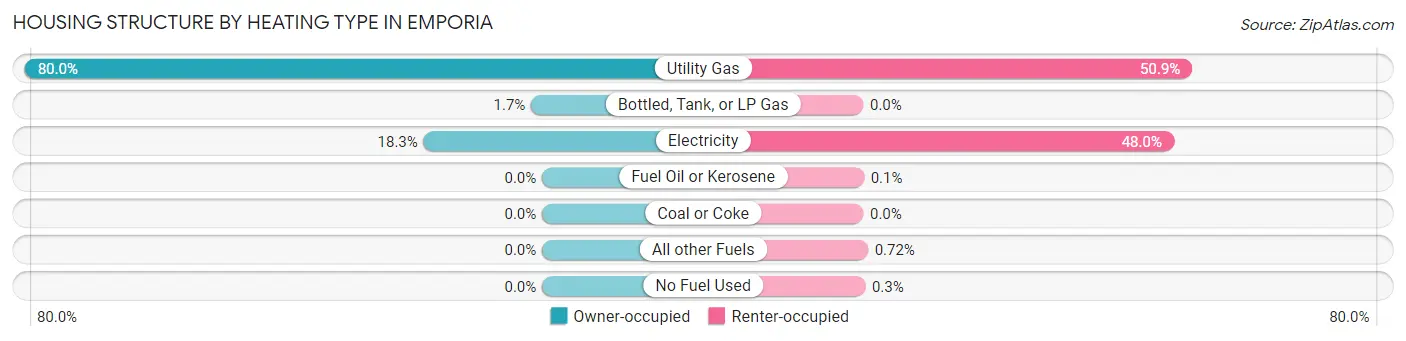
| Heating Type | Owner-occupied | Renter-occupied |
| Utility Gas | 4,012 (80.0%) | 2,554 (50.9%) |
| Bottled, Tank, or LP Gas | 85 (1.7%) | 0 (0.0%) |
| Electricity | 919 (18.3%) | 2,411 (48.0%) |
| Fuel Oil or Kerosene | 0 (0.0%) | 5 (0.1%) |
| Coal or Coke | 0 (0.0%) | 0 (0.0%) |
| All other Fuels | 0 (0.0%) | 36 (0.7%) |
| No Fuel Used | 0 (0.0%) | 15 (0.3%) |
| Total | 5,016 (100.0%) | 5,021 (100.0%) |
Household Vehicle Usage in Emporia
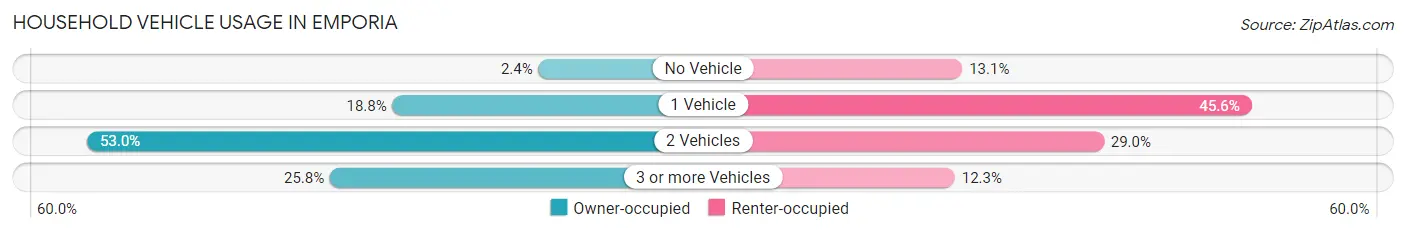
| Vehicles per Household | Owner-occupied | Renter-occupied |
| No Vehicle | 122 (2.4%) | 660 (13.1%) |
| 1 Vehicle | 942 (18.8%) | 2,287 (45.6%) |
| 2 Vehicles | 2,659 (53.0%) | 1,456 (29.0%) |
| 3 or more Vehicles | 1,293 (25.8%) | 618 (12.3%) |
| Total | 5,016 (100.0%) | 5,021 (100.0%) |
Real Estate & Mortgages in Emporia
Real Estate and Mortgage Overview in Emporia
| Characteristic | Without Mortgage | With Mortgage |
| Housing Units | 2,098 | 2,918 |
| Median Property Value | $117,900 | $129,200 |
| Median Household Income | $58,602 | $300 |
| Monthly Housing Costs | $585 | $53 |
| Real Estate Taxes | $2,114 | $78 |
Property Value by Mortgage Status in Emporia
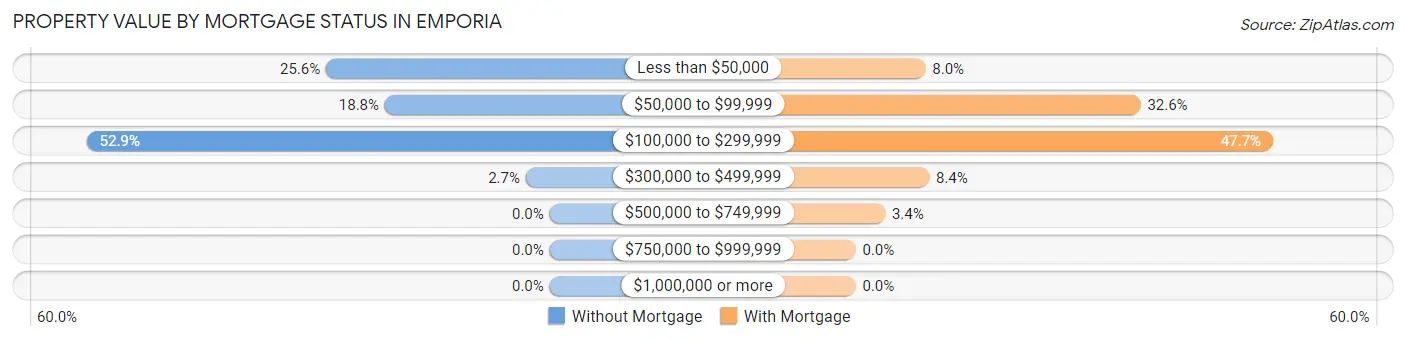
| Property Value | Without Mortgage | With Mortgage |
| Less than $50,000 | 536 (25.6%) | 233 (8.0%) |
| $50,000 to $99,999 | 395 (18.8%) | 950 (32.6%) |
| $100,000 to $299,999 | 1,110 (52.9%) | 1,392 (47.7%) |
| $300,000 to $499,999 | 57 (2.7%) | 245 (8.4%) |
| $500,000 to $749,999 | 0 (0.0%) | 98 (3.4%) |
| $750,000 to $999,999 | 0 (0.0%) | 0 (0.0%) |
| $1,000,000 or more | 0 (0.0%) | 0 (0.0%) |
| Total | 2,098 (100.0%) | 2,918 (100.0%) |
Household Income by Mortgage Status in Emporia
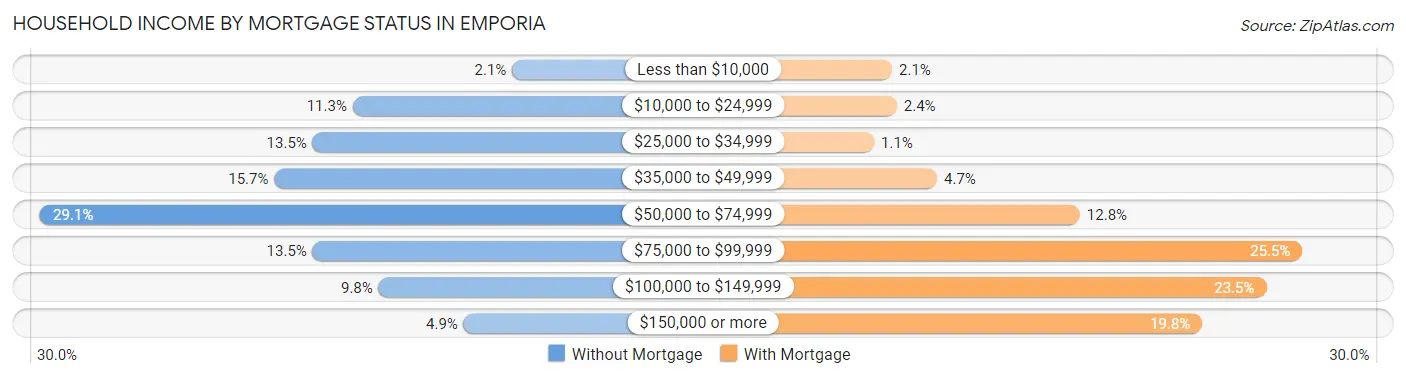
| Household Income | Without Mortgage | With Mortgage |
| Less than $10,000 | 45 (2.1%) | 61 (2.1%) |
| $10,000 to $24,999 | 236 (11.3%) | 69 (2.4%) |
| $25,000 to $34,999 | 284 (13.5%) | 31 (1.1%) |
| $35,000 to $49,999 | 330 (15.7%) | 136 (4.7%) |
| $50,000 to $74,999 | 611 (29.1%) | 374 (12.8%) |
| $75,000 to $99,999 | 284 (13.5%) | 745 (25.5%) |
| $100,000 to $149,999 | 205 (9.8%) | 685 (23.5%) |
| $150,000 or more | 103 (4.9%) | 578 (19.8%) |
| Total | 2,098 (100.0%) | 2,918 (100.0%) |
Property Value to Household Income Ratio in Emporia
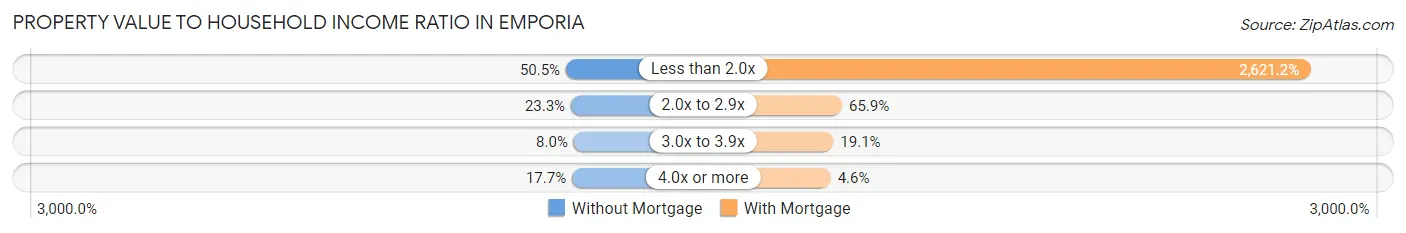
| Value-to-Income Ratio | Without Mortgage | With Mortgage |
| Less than 2.0x | 1,059 (50.5%) | 76,486 (2,621.2%) |
| 2.0x to 2.9x | 489 (23.3%) | 1,923 (65.9%) |
| 3.0x to 3.9x | 168 (8.0%) | 558 (19.1%) |
| 4.0x or more | 372 (17.7%) | 133 (4.6%) |
| Total | 2,098 (100.0%) | 2,918 (100.0%) |
Real Estate Taxes by Mortgage Status in Emporia
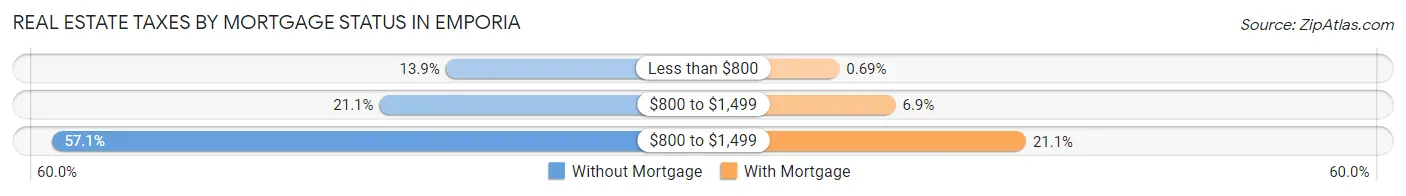
| Property Taxes | Without Mortgage | With Mortgage |
| Less than $800 | 291 (13.9%) | 20 (0.7%) |
| $800 to $1,499 | 443 (21.1%) | 200 (6.9%) |
| $800 to $1,499 | 1,197 (57.1%) | 617 (21.1%) |
| Total | 2,098 (100.0%) | 2,918 (100.0%) |
Health & Disability in Emporia
Health Insurance Coverage by Age in Emporia
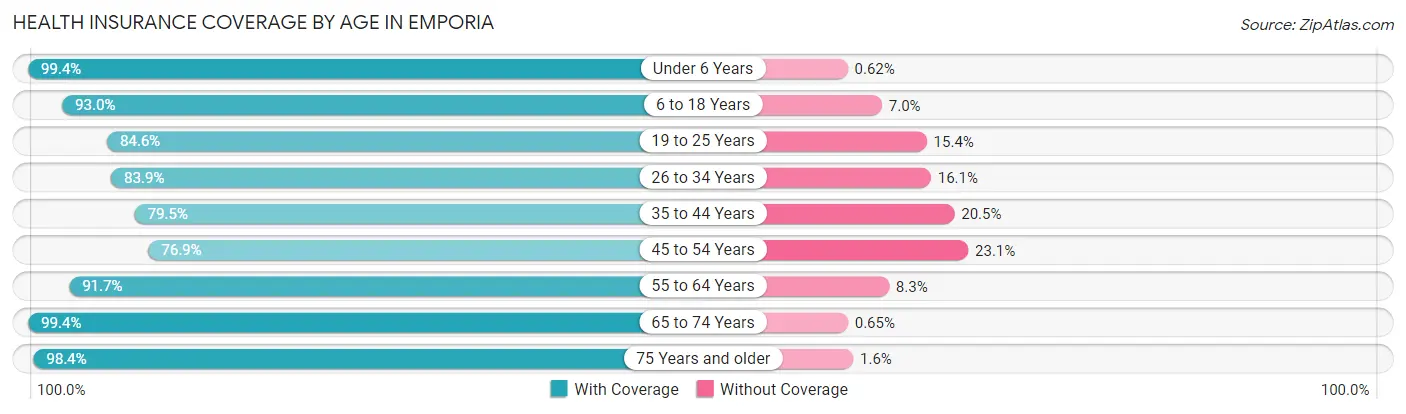
| Age Bracket | With Coverage | Without Coverage |
| Under 6 Years | 1,758 (99.4%) | 11 (0.6%) |
| 6 to 18 Years | 3,738 (93.0%) | 282 (7.0%) |
| 19 to 25 Years | 4,104 (84.6%) | 745 (15.4%) |
| 26 to 34 Years | 2,407 (83.9%) | 463 (16.1%) |
| 35 to 44 Years | 2,046 (79.5%) | 528 (20.5%) |
| 45 to 54 Years | 1,695 (76.9%) | 509 (23.1%) |
| 55 to 64 Years | 2,150 (91.7%) | 195 (8.3%) |
| 65 to 74 Years | 1,825 (99.4%) | 12 (0.6%) |
| 75 Years and older | 1,198 (98.4%) | 20 (1.6%) |
| Total | 20,921 (88.3%) | 2,765 (11.7%) |
Health Insurance Coverage by Citizenship Status in Emporia
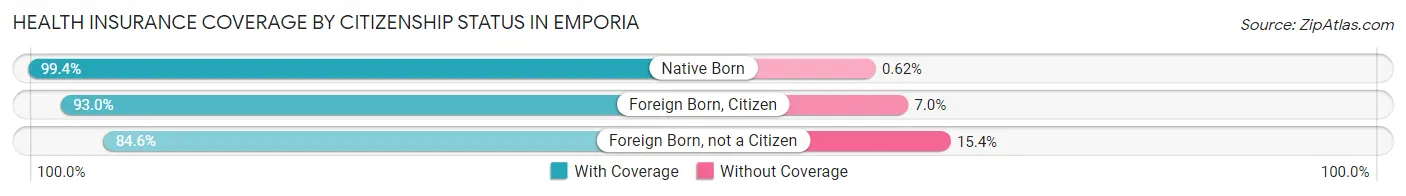
| Citizenship Status | With Coverage | Without Coverage |
| Native Born | 1,758 (99.4%) | 11 (0.6%) |
| Foreign Born, Citizen | 3,738 (93.0%) | 282 (7.0%) |
| Foreign Born, not a Citizen | 4,104 (84.6%) | 745 (15.4%) |
Health Insurance Coverage by Household Income in Emporia
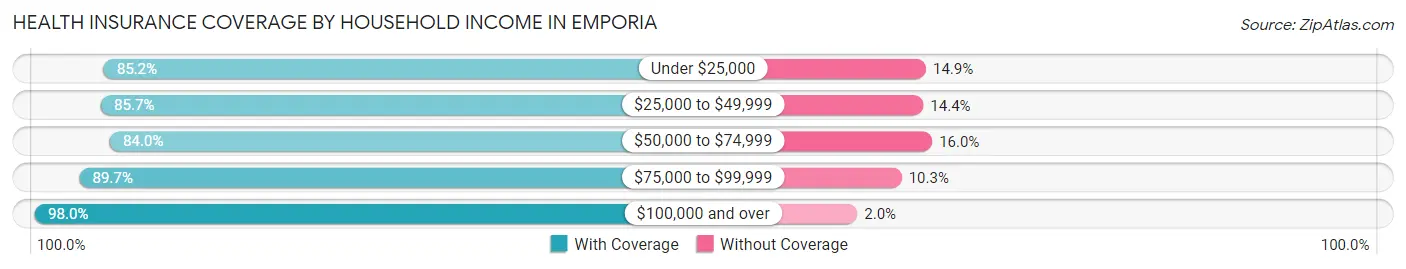
| Household Income | With Coverage | Without Coverage |
| Under $25,000 | 3,262 (85.2%) | 569 (14.8%) |
| $25,000 to $49,999 | 4,848 (85.7%) | 812 (14.3%) |
| $50,000 to $74,999 | 4,015 (84.0%) | 765 (16.0%) |
| $75,000 to $99,999 | 3,828 (89.7%) | 439 (10.3%) |
| $100,000 and over | 4,251 (98.0%) | 86 (2.0%) |
Public vs Private Health Insurance Coverage by Age in Emporia
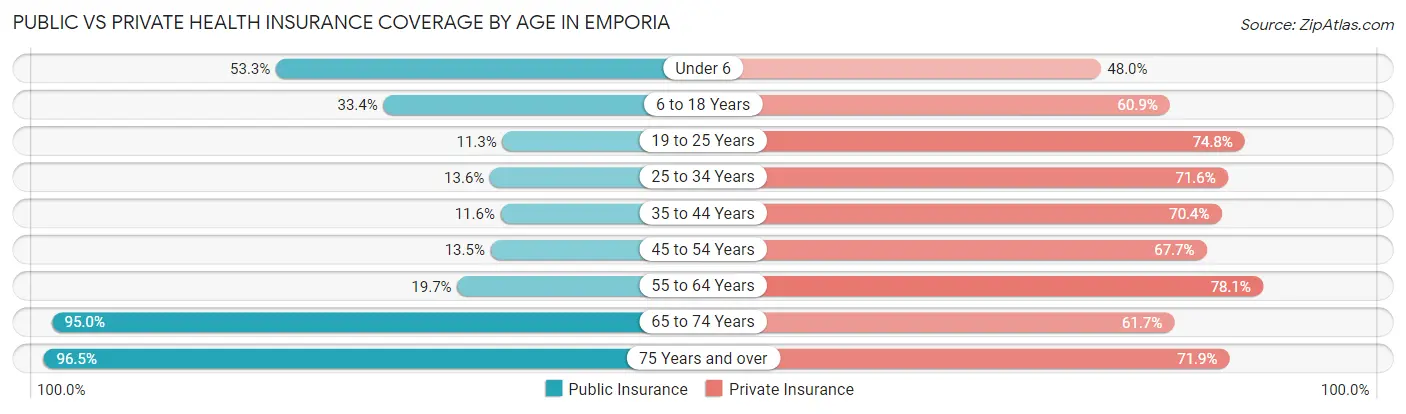
| Age Bracket | Public Insurance | Private Insurance |
| Under 6 | 943 (53.3%) | 849 (48.0%) |
| 6 to 18 Years | 1,342 (33.4%) | 2,446 (60.9%) |
| 19 to 25 Years | 547 (11.3%) | 3,626 (74.8%) |
| 25 to 34 Years | 390 (13.6%) | 2,055 (71.6%) |
| 35 to 44 Years | 299 (11.6%) | 1,813 (70.4%) |
| 45 to 54 Years | 297 (13.5%) | 1,491 (67.6%) |
| 55 to 64 Years | 461 (19.7%) | 1,832 (78.1%) |
| 65 to 74 Years | 1,745 (95.0%) | 1,133 (61.7%) |
| 75 Years and over | 1,175 (96.5%) | 876 (71.9%) |
| Total | 7,199 (30.4%) | 16,121 (68.1%) |
Disability Status by Sex by Age in Emporia
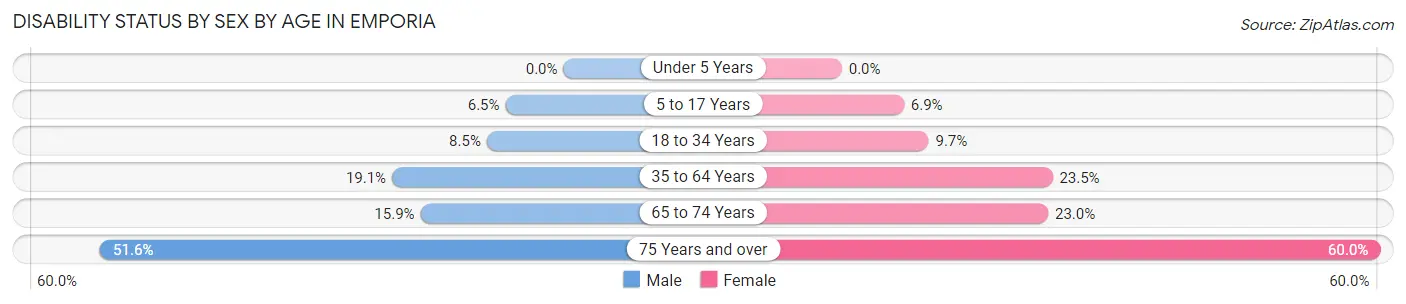
| Age Bracket | Male | Female |
| Under 5 Years | 0 (0.0%) | 0 (0.0%) |
| 5 to 17 Years | 114 (6.5%) | 137 (6.9%) |
| 18 to 34 Years | 334 (8.5%) | 425 (9.7%) |
| 35 to 64 Years | 674 (19.1%) | 843 (23.5%) |
| 65 to 74 Years | 149 (15.9%) | 207 (23.0%) |
| 75 Years and over | 229 (51.6%) | 464 (60.0%) |
Disability Class by Sex by Age in Emporia
Disability Class: Hearing Difficulty
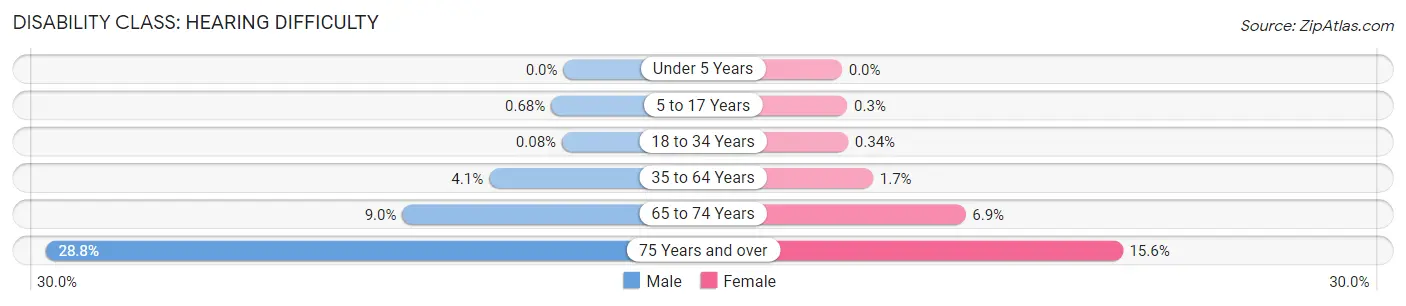
| Age Bracket | Male | Female |
| Under 5 Years | 0 (0.0%) | 0 (0.0%) |
| 5 to 17 Years | 12 (0.7%) | 6 (0.3%) |
| 18 to 34 Years | 3 (0.1%) | 15 (0.3%) |
| 35 to 64 Years | 146 (4.1%) | 62 (1.7%) |
| 65 to 74 Years | 84 (9.0%) | 62 (6.9%) |
| 75 Years and over | 128 (28.8%) | 121 (15.6%) |
Disability Class: Vision Difficulty
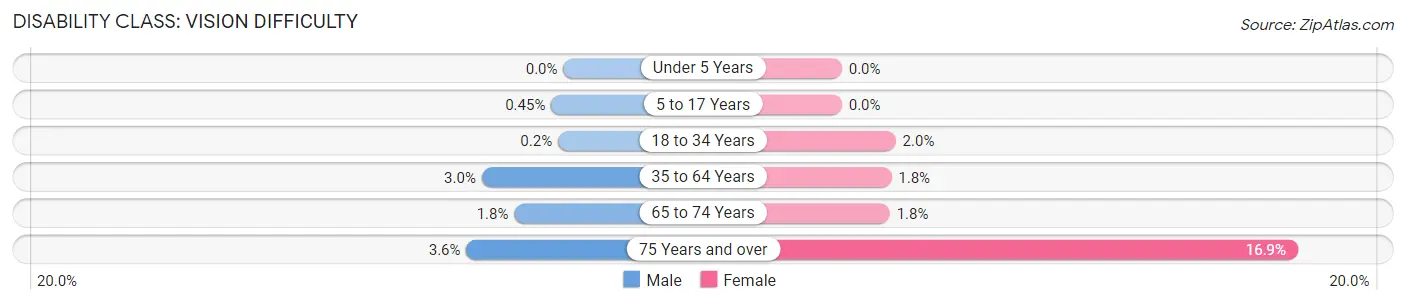
| Age Bracket | Male | Female |
| Under 5 Years | 0 (0.0%) | 0 (0.0%) |
| 5 to 17 Years | 8 (0.4%) | 0 (0.0%) |
| 18 to 34 Years | 8 (0.2%) | 88 (2.0%) |
| 35 to 64 Years | 107 (3.0%) | 66 (1.8%) |
| 65 to 74 Years | 17 (1.8%) | 16 (1.8%) |
| 75 Years and over | 16 (3.6%) | 131 (16.9%) |
Disability Class: Cognitive Difficulty
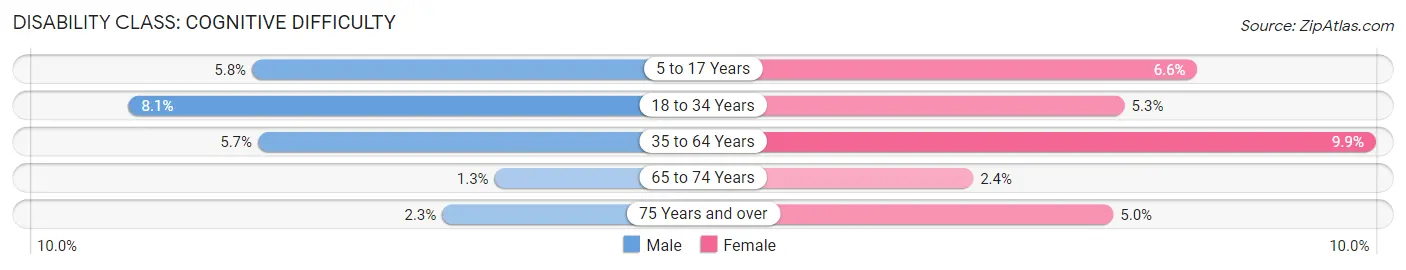
| Age Bracket | Male | Female |
| 5 to 17 Years | 102 (5.8%) | 131 (6.6%) |
| 18 to 34 Years | 316 (8.1%) | 231 (5.2%) |
| 35 to 64 Years | 200 (5.7%) | 356 (9.9%) |
| 65 to 74 Years | 12 (1.3%) | 22 (2.4%) |
| 75 Years and over | 10 (2.2%) | 39 (5.0%) |
Disability Class: Ambulatory Difficulty
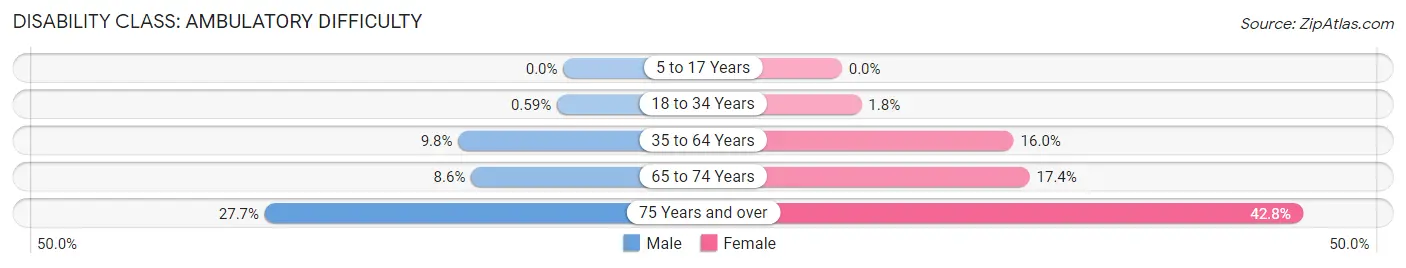
| Age Bracket | Male | Female |
| 5 to 17 Years | 0 (0.0%) | 0 (0.0%) |
| 18 to 34 Years | 23 (0.6%) | 80 (1.8%) |
| 35 to 64 Years | 344 (9.8%) | 573 (16.0%) |
| 65 to 74 Years | 80 (8.6%) | 157 (17.4%) |
| 75 Years and over | 123 (27.7%) | 331 (42.8%) |
Disability Class: Self-Care Difficulty
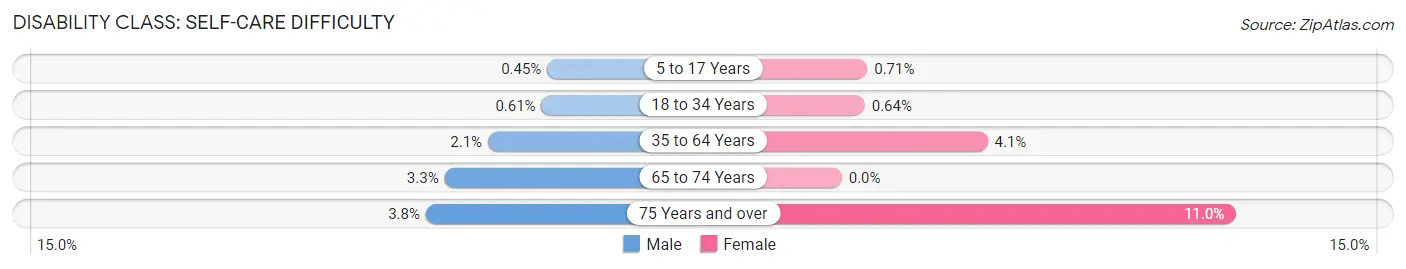
| Age Bracket | Male | Female |
| 5 to 17 Years | 8 (0.4%) | 14 (0.7%) |
| 18 to 34 Years | 24 (0.6%) | 28 (0.6%) |
| 35 to 64 Years | 74 (2.1%) | 146 (4.1%) |
| 65 to 74 Years | 31 (3.3%) | 0 (0.0%) |
| 75 Years and over | 17 (3.8%) | 85 (11.0%) |
Technology Access in Emporia
Computing Device Access in Emporia
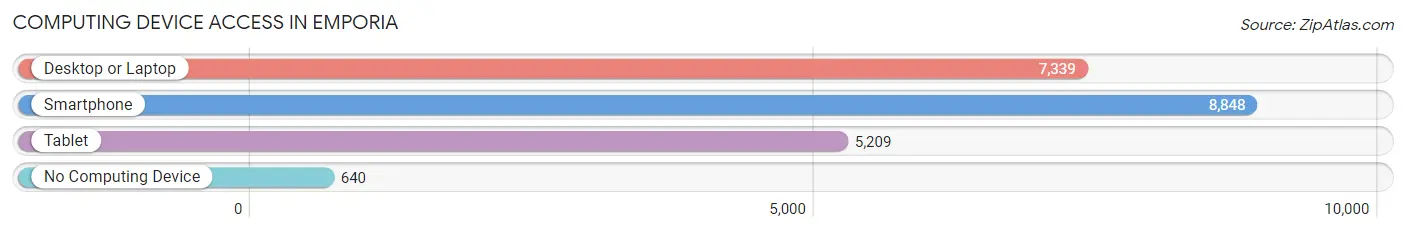
| Device Type | # Households | % Households |
| Desktop or Laptop | 7,339 | 73.1% |
| Smartphone | 8,848 | 88.1% |
| Tablet | 5,209 | 51.9% |
| No Computing Device | 640 | 6.4% |
| Total | 10,037 | 100.0% |
Internet Access in Emporia

| Internet Type | # Households | % Households |
| Dial-Up Internet | 10 | 0.1% |
| Broadband Home | 6,557 | 65.3% |
| Cellular Data Only | 2,023 | 20.2% |
| Satellite Internet | 351 | 3.5% |
| No Internet | 1,251 | 12.5% |
| Total | 10,037 | 100.0% |
Emporia Summary
Emporia, Kansas is a city located in the east-central part of the state, in Lyon County. It is the county seat and the largest city in the county. The city is situated along the banks of the Cottonwood River, and is located about 50 miles south of Topeka and about 90 miles west of Kansas City. As of the 2010 census, the population of Emporia was 24,916.
History
The area that is now Emporia was first settled in 1857 by a group of settlers from the New England Emigrant Aid Company. The town was originally named “Palmyra”, but was later changed to “Emporia” in 1858. The name was chosen to honor the ancient Greek city of Emporion, which was known for its commercial activity.
The city was officially incorporated in 1859, and the first mayor was elected in 1860. During the Civil War, Emporia was a major stop on the Underground Railroad, and many escaped slaves found refuge in the city.
In 1867, the first railroad line was built through Emporia, connecting the city to Topeka and Kansas City. This allowed the city to become a major hub for trade and commerce.
In 1873, the first college in the city was established, and it is now known as Emporia State University. The university has grown to become one of the largest in the state, and is home to over 6,000 students.
In 1881, the first newspaper in the city was established, and it is now known as the Emporia Gazette. The newspaper is still in operation today, and is the oldest continuously published newspaper in the state of Kansas.
In 1887, the first public library in the city was established, and it is now known as the William Allen White Library. The library is named after William Allen White, a Pulitzer Prize-winning journalist and author who was born in Emporia.
Geography
Emporia is located in east-central Kansas, in Lyon County. The city is situated along the banks of the Cottonwood River, and is located about 50 miles south of Topeka and about 90 miles west of Kansas City.
The city has a total area of 16.2 square miles, of which 16.1 square miles is land and 0.1 square miles is water. The city is located in the Flint Hills region of Kansas, and is known for its rolling hills and prairies.
Economy
Emporia’s economy is largely based on agriculture, manufacturing, and education. The city is home to several large employers, including the Emporia State University, the Emporia Gazette, and the William Allen White Library.
The city is also home to several large manufacturing companies, including the Emporia Manufacturing Company, which produces a variety of products, including furniture, clothing, and automotive parts.
Demographics
As of the 2010 census, the population of Emporia was 24,916. The racial makeup of the city was 87.3% White, 5.7% African American, 0.7% Native American, 1.2% Asian, 0.1% Pacific Islander, 2.2% from other races, and 3.0% from two or more races. Hispanic or Latino of any race were 5.7% of the population.
The median income for a household in the city was $37,945, and the median income for a family was $48,945. The per capita income for the city was $20,845. About 11.2% of families and 15.3% of the population were below the poverty line, including 22.2% of those under age 18 and 8.2% of those age 65 or over.
Common Questions
What is Per Capita Income in Emporia?
Per Capita income in Emporia is $26,383.
What is the Median Family Income in Emporia?
Median Family Income in Emporia is $69,562.
What is the Median Household income in Emporia?
Median Household Income in Emporia is $49,661.
What is Income or Wage Gap in Emporia?
Income or Wage Gap in Emporia is 49.1%.
Women in Emporia earn 50.9 cents for every dollar earned by a man.
What is Family Income Deficit in Emporia?
Family Income Deficit in Emporia is $11,848.
Families that are below poverty line in Emporia earn $11,848 less on average than the poverty threshold level.
What is Inequality or Gini Index in Emporia?
Inequality or Gini Index in Emporia is 0.43.
What is the Total Population of Emporia?
Total Population of Emporia is 24,118.
What is the Total Male Population of Emporia?
Total Male Population of Emporia is 11,519.
What is the Total Female Population of Emporia?
Total Female Population of Emporia is 12,599.
What is the Ratio of Males per 100 Females in Emporia?
There are 91.43 Males per 100 Females in Emporia.
What is the Ratio of Females per 100 Males in Emporia?
There are 109.38 Females per 100 Males in Emporia.
What is the Median Population Age in Emporia?
Median Population Age in Emporia is 29.7 Years.
What is the Average Family Size in Emporia
Average Family Size in Emporia is 3.0 People.
What is the Average Household Size in Emporia
Average Household Size in Emporia is 2.3 People.
How Large is the Labor Force in Emporia?
There are 13,354 People in the Labor Forcein in Emporia.
What is the Percentage of People in the Labor Force in Emporia?
68.6% of People are in the Labor Force in Emporia.
What is the Unemployment Rate in Emporia?
Unemployment Rate in Emporia is 3.2%.