Pittsburg, KS Map & Demographics
Pittsburg Map
Pittsburg Overview
$24,987
PER CAPITA INCOME
$52,083
AVG FAMILY INCOME
$42,371
AVG HOUSEHOLD INCOME
20.5%
WAGE / INCOME GAP [ % ]
79.5¢/ $1
WAGE / INCOME GAP [ $ ]
$9,329
FAMILY INCOME DEFICIT
0.49
INEQUALITY / GINI INDEX
20,610
TOTAL POPULATION
10,731
MALE POPULATION
9,879
FEMALE POPULATION
108.62
MALES / 100 FEMALES
92.06
FEMALES / 100 MALES
25.7
MEDIAN AGE
2.9
AVG FAMILY SIZE
2.3
AVG HOUSEHOLD SIZE
10,848
LABOR FORCE [ PEOPLE ]
65.4%
PERCENT IN LABOR FORCE
4.0%
UNEMPLOYMENT RATE
Pittsburg Zip Codes
Pittsburg Area Codes
Income in Pittsburg
Income Overview in Pittsburg
Per Capita Income in Pittsburg is $24,987, while median incomes of families and households are $52,083 and $42,371 respectively.
| Characteristic | Number | Measure |
| Per Capita Income | 20,610 | $24,987 |
| Median Family Income | 4,460 | $52,083 |
| Mean Family Income | 4,460 | $68,531 |
| Median Household Income | 8,305 | $42,371 |
| Mean Household Income | 8,305 | $58,462 |
| Income Deficit | 4,460 | $9,329 |
| Wage / Income Gap (%) | 20,610 | 20.45% |
| Wage / Income Gap ($) | 20,610 | 79.55¢ per $1 |
| Gini / Inequality Index | 20,610 | 0.49 |
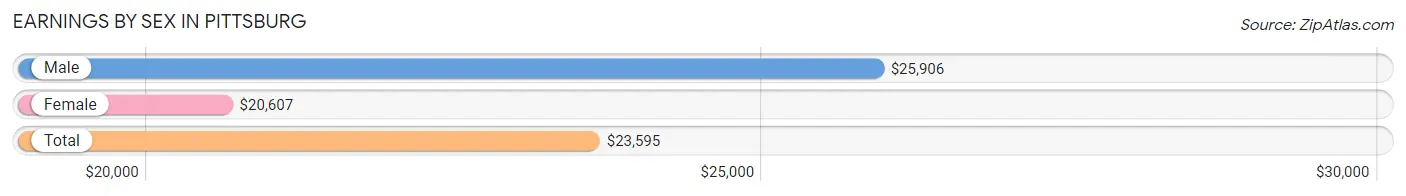
Earnings by Sex in Pittsburg
Average Earnings in Pittsburg are $23,595, $25,906 for men and $20,607 for women, a difference of 20.4%.
| Sex | Number | Average Earnings |
| Male | 6,482 (54.5%) | $25,906 |
| Female | 5,408 (45.5%) | $20,607 |
| Total | 11,890 (100.0%) | $23,595 |
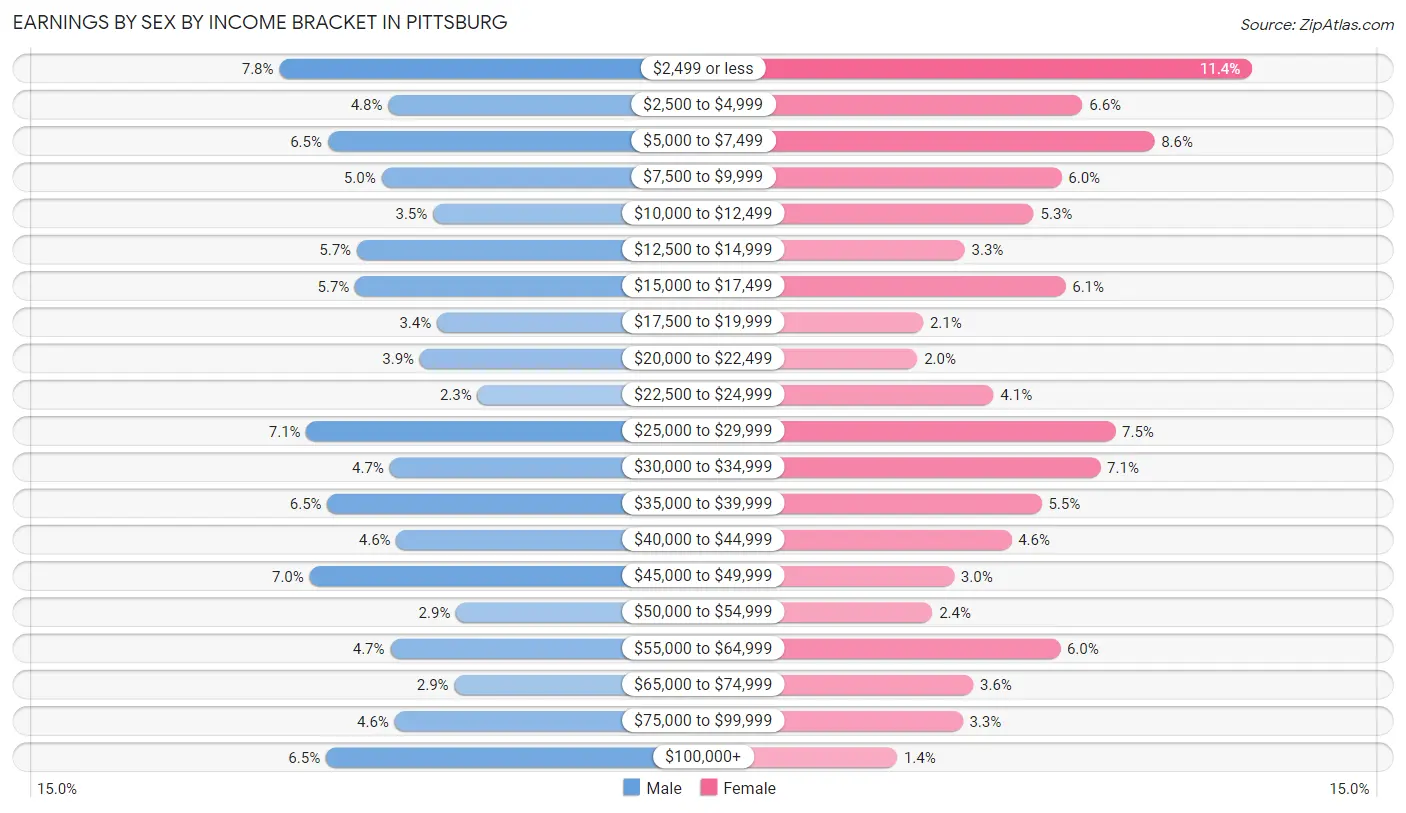
Earnings by Sex by Income Bracket in Pittsburg
The most common earnings brackets in Pittsburg are $2,499 or less for men (508 | 7.8%) and $2,499 or less for women (616 | 11.4%).
| Income | Male | Female |
| $2,499 or less | 508 (7.8%) | 616 (11.4%) |
| $2,500 to $4,999 | 310 (4.8%) | 358 (6.6%) |
| $5,000 to $7,499 | 420 (6.5%) | 467 (8.6%) |
| $7,500 to $9,999 | 322 (5.0%) | 326 (6.0%) |
| $10,000 to $12,499 | 228 (3.5%) | 284 (5.2%) |
| $12,500 to $14,999 | 367 (5.7%) | 179 (3.3%) |
| $15,000 to $17,499 | 370 (5.7%) | 332 (6.1%) |
| $17,500 to $19,999 | 221 (3.4%) | 116 (2.1%) |
| $20,000 to $22,499 | 252 (3.9%) | 107 (2.0%) |
| $22,500 to $24,999 | 147 (2.3%) | 223 (4.1%) |
| $25,000 to $29,999 | 459 (7.1%) | 408 (7.5%) |
| $30,000 to $34,999 | 307 (4.7%) | 385 (7.1%) |
| $35,000 to $39,999 | 421 (6.5%) | 296 (5.5%) |
| $40,000 to $44,999 | 295 (4.5%) | 250 (4.6%) |
| $45,000 to $49,999 | 453 (7.0%) | 163 (3.0%) |
| $50,000 to $54,999 | 186 (2.9%) | 130 (2.4%) |
| $55,000 to $64,999 | 306 (4.7%) | 324 (6.0%) |
| $65,000 to $74,999 | 189 (2.9%) | 192 (3.5%) |
| $75,000 to $99,999 | 298 (4.6%) | 176 (3.3%) |
| $100,000+ | 423 (6.5%) | 76 (1.4%) |
| Total | 6,482 (100.0%) | 5,408 (100.0%) |
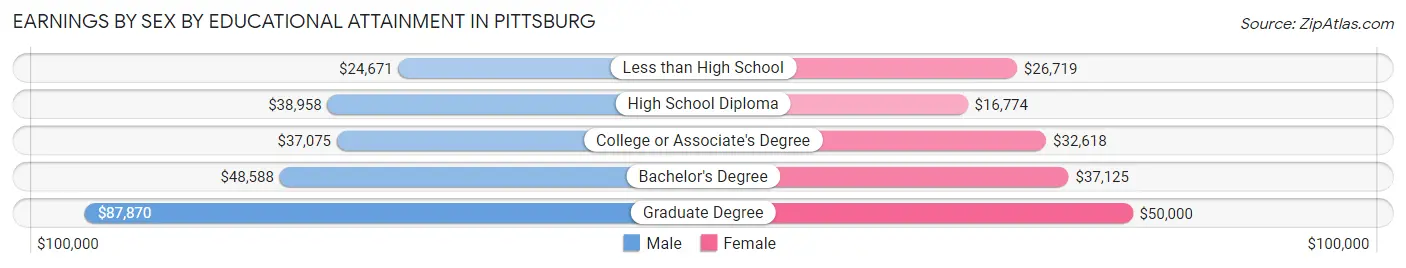
Earnings by Sex by Educational Attainment in Pittsburg
Average earnings in Pittsburg are $42,163 for men and $31,369 for women, a difference of 25.6%. Men with an educational attainment of graduate degree enjoy the highest average annual earnings of $87,870, while those with less than high school education earn the least with $24,671. Women with an educational attainment of graduate degree earn the most with the average annual earnings of $50,000, while those with high school diploma education have the smallest earnings of $16,774.
| Educational Attainment | Male Income | Female Income |
| Less than High School | $24,671 | $26,719 |
| High School Diploma | $38,958 | $16,774 |
| College or Associate's Degree | $37,075 | $32,618 |
| Bachelor's Degree | $48,588 | $37,125 |
| Graduate Degree | $87,870 | $50,000 |
| Total | $42,163 | $31,369 |
Family Income in Pittsburg
Family Income Brackets in Pittsburg
According to the Pittsburg family income data, there are 785 families falling into the $50,000 to $74,999 income range, which is the most common income bracket and makes up 17.6% of all families. Conversely, the $10,000 to $14,999 income bracket is the least frequent group with only 152 families (3.4%) belonging to this category.
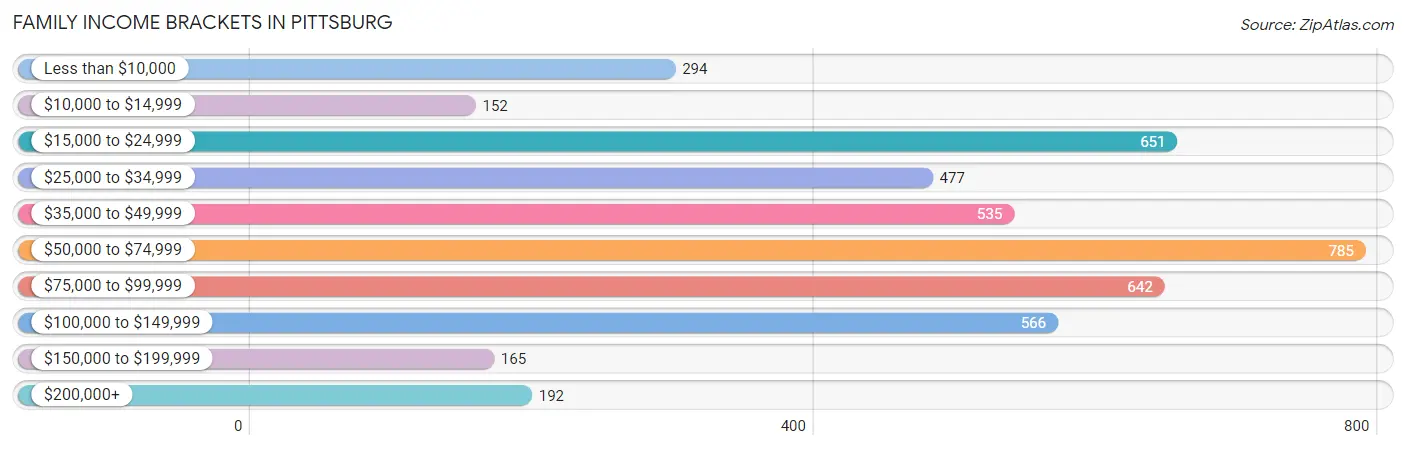
| Income Bracket | # Families | % Families |
| Less than $10,000 | 294 | 6.6% |
| $10,000 to $14,999 | 152 | 3.4% |
| $15,000 to $24,999 | 651 | 14.6% |
| $25,000 to $34,999 | 477 | 10.7% |
| $35,000 to $49,999 | 535 | 12.0% |
| $50,000 to $74,999 | 785 | 17.6% |
| $75,000 to $99,999 | 642 | 14.4% |
| $100,000 to $149,999 | 566 | 12.7% |
| $150,000 to $199,999 | 165 | 3.7% |
| $200,000+ | 192 | 4.3% |
Family Income by Famaliy Size in Pittsburg
4-person families (733 | 16.4%) account for the highest median family income in Pittsburg with $71,110 per family, while 2-person families (2,281 | 51.1%) have the highest median income of $24,194 per family member.
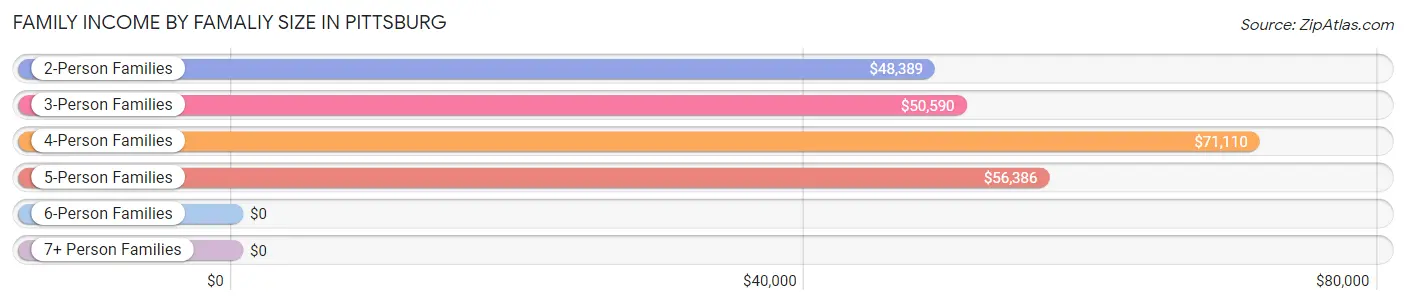
| Income Bracket | # Families | Median Income |
| 2-Person Families | 2,281 (51.1%) | $48,389 |
| 3-Person Families | 958 (21.5%) | $50,590 |
| 4-Person Families | 733 (16.4%) | $71,110 |
| 5-Person Families | 359 (8.1%) | $56,386 |
| 6-Person Families | 86 (1.9%) | $0 |
| 7+ Person Families | 43 (1.0%) | $0 |
| Total | 4,460 (100.0%) | $52,083 |
Family Income by Number of Earners in Pittsburg
The median family income in Pittsburg is $52,083, with families comprising 3+ earners (372) having the highest median family income of $112,778, while families with 1 earner (1,710) have the lowest median family income of $33,551, accounting for 8.3% and 38.3% of families, respectively.
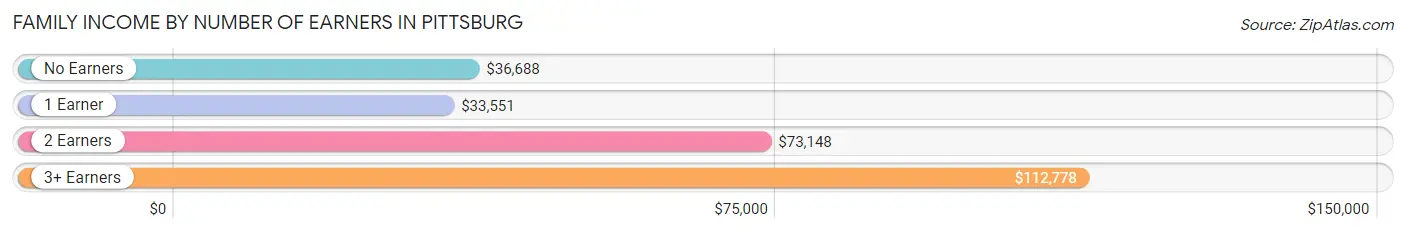
| Number of Earners | # Families | Median Income |
| No Earners | 464 (10.4%) | $36,688 |
| 1 Earner | 1,710 (38.3%) | $33,551 |
| 2 Earners | 1,914 (42.9%) | $73,148 |
| 3+ Earners | 372 (8.3%) | $112,778 |
| Total | 4,460 (100.0%) | $52,083 |
Household Income in Pittsburg
Household Income Brackets in Pittsburg
With 1,570 households falling in the category, the $50,000 to $74,999 income range is the most frequent in Pittsburg, accounting for 18.9% of all households. In contrast, only 257 households (3.1%) fall into the $200,000+ income bracket, making it the least populous group.
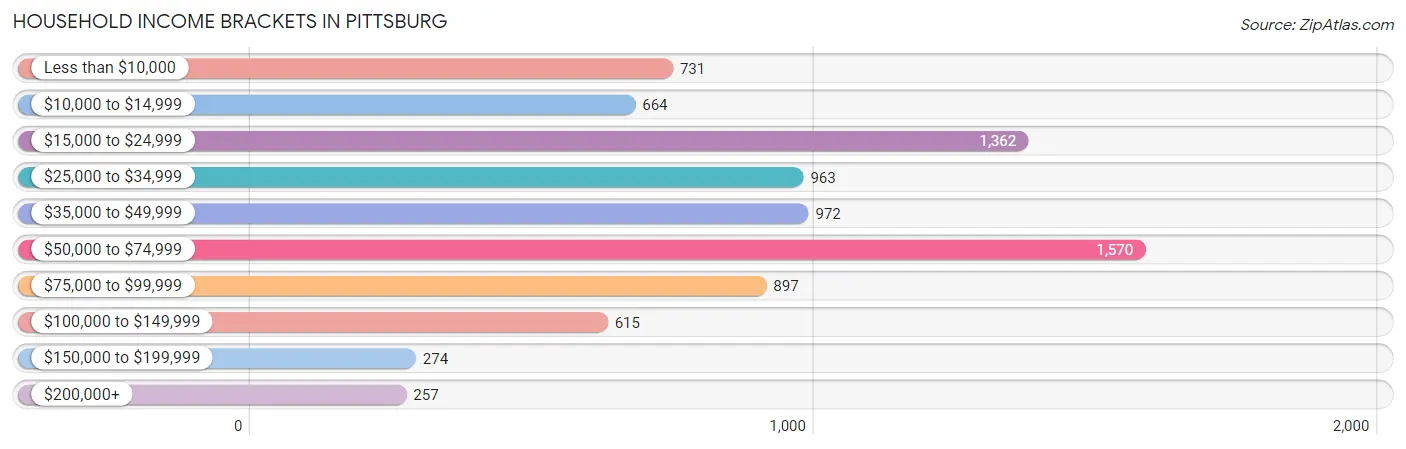
| Income Bracket | # Households | % Households |
| Less than $10,000 | 731 | 8.8% |
| $10,000 to $14,999 | 664 | 8.0% |
| $15,000 to $24,999 | 1,362 | 16.4% |
| $25,000 to $34,999 | 963 | 11.6% |
| $35,000 to $49,999 | 972 | 11.7% |
| $50,000 to $74,999 | 1,570 | 18.9% |
| $75,000 to $99,999 | 897 | 10.8% |
| $100,000 to $149,999 | 615 | 7.4% |
| $150,000 to $199,999 | 274 | 3.3% |
| $200,000+ | 257 | 3.1% |
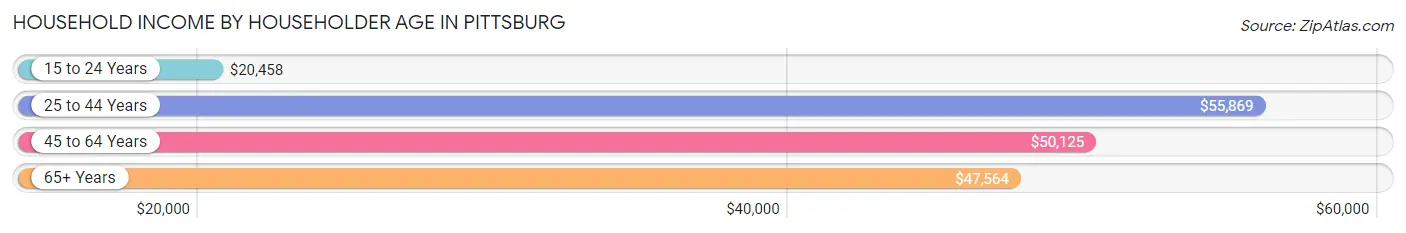
Household Income by Householder Age in Pittsburg
The median household income in Pittsburg is $42,371, with the highest median household income of $55,869 found in the 25 to 44 years age bracket for the primary householder. A total of 2,579 households (31.0%) fall into this category. Meanwhile, the 15 to 24 years age bracket for the primary householder has the lowest median household income of $20,458, with 1,966 households (23.7%) in this group.
| Income Bracket | # Households | Median Income |
| 15 to 24 Years | 1,966 (23.7%) | $20,458 |
| 25 to 44 Years | 2,579 (31.0%) | $55,869 |
| 45 to 64 Years | 2,141 (25.8%) | $50,125 |
| 65+ Years | 1,619 (19.5%) | $47,564 |
| Total | 8,305 (100.0%) | $42,371 |
Poverty in Pittsburg
Income Below Poverty by Sex and Age in Pittsburg
With 27.0% poverty level for males and 32.0% for females among the residents of Pittsburg, 15 year old males and 15 year old females are the most vulnerable to poverty, with 63 males (54.8%) and 103 females (68.2%) in their respective age groups living below the poverty level.
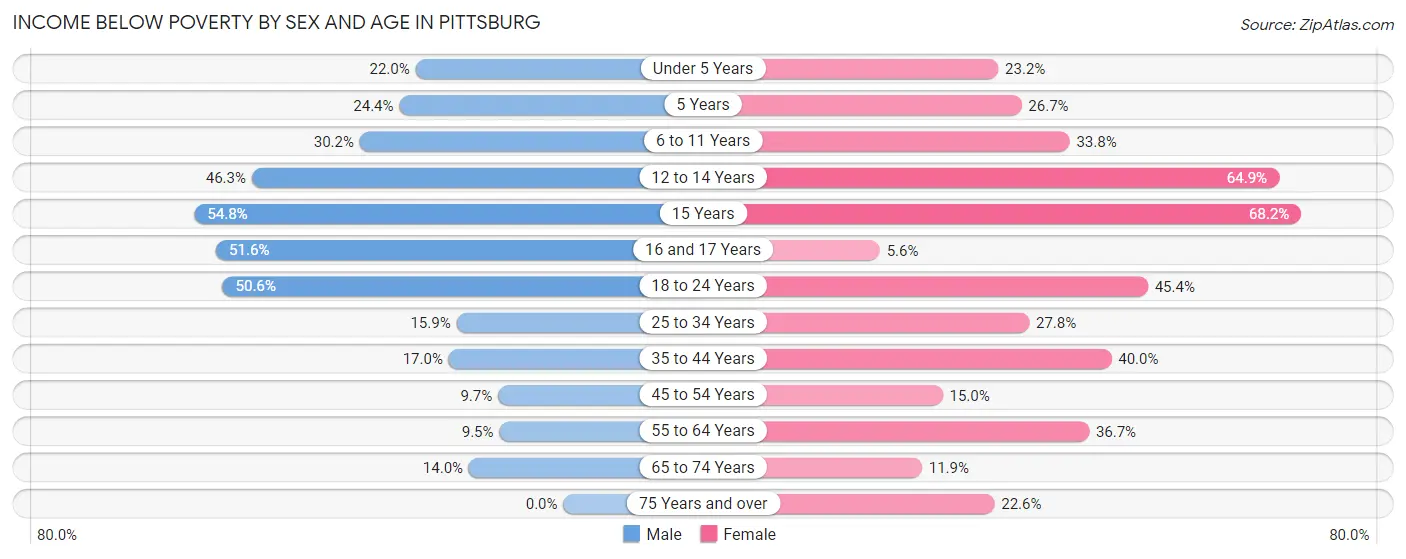
| Age Bracket | Male | Female |
| Under 5 Years | 164 (22.0%) | 124 (23.2%) |
| 5 Years | 28 (24.3%) | 16 (26.7%) |
| 6 to 11 Years | 221 (30.2%) | 236 (33.8%) |
| 12 to 14 Years | 173 (46.3%) | 270 (64.9%) |
| 15 Years | 63 (54.8%) | 103 (68.2%) |
| 16 and 17 Years | 200 (51.5%) | 12 (5.6%) |
| 18 to 24 Years | 1,198 (50.6%) | 775 (45.4%) |
| 25 to 34 Years | 233 (15.9%) | 360 (27.8%) |
| 35 to 44 Years | 146 (17.0%) | 385 (40.0%) |
| 45 to 54 Years | 88 (9.7%) | 137 (15.0%) |
| 55 to 64 Years | 89 (9.5%) | 236 (36.7%) |
| 65 to 74 Years | 68 (14.0%) | 98 (11.9%) |
| 75 Years and over | 0 (0.0%) | 151 (22.6%) |
| Total | 2,671 (27.0%) | 2,903 (32.0%) |
Income Above Poverty by Sex and Age in Pittsburg
According to the poverty statistics in Pittsburg, males aged 75 years and over and females aged 16 and 17 years are the age groups that are most secure financially, with 100.0% of males and 94.4% of females in these age groups living above the poverty line.
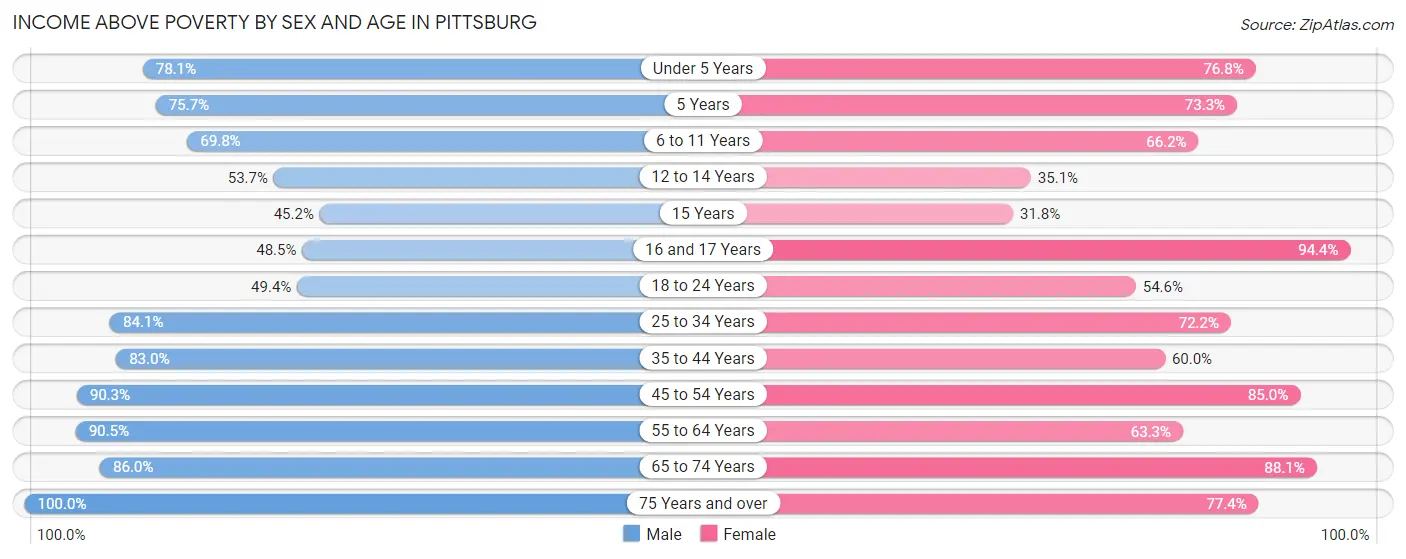
| Age Bracket | Male | Female |
| Under 5 Years | 583 (78.0%) | 410 (76.8%) |
| 5 Years | 87 (75.6%) | 44 (73.3%) |
| 6 to 11 Years | 510 (69.8%) | 462 (66.2%) |
| 12 to 14 Years | 201 (53.7%) | 146 (35.1%) |
| 15 Years | 52 (45.2%) | 48 (31.8%) |
| 16 and 17 Years | 188 (48.4%) | 201 (94.4%) |
| 18 to 24 Years | 1,170 (49.4%) | 931 (54.6%) |
| 25 to 34 Years | 1,235 (84.1%) | 935 (72.2%) |
| 35 to 44 Years | 712 (83.0%) | 577 (60.0%) |
| 45 to 54 Years | 819 (90.3%) | 779 (85.0%) |
| 55 to 64 Years | 848 (90.5%) | 407 (63.3%) |
| 65 to 74 Years | 417 (86.0%) | 727 (88.1%) |
| 75 Years and over | 384 (100.0%) | 516 (77.4%) |
| Total | 7,206 (73.0%) | 6,183 (68.0%) |
Income Below Poverty Among Married-Couple Families in Pittsburg
The poverty statistics for married-couple families in Pittsburg show that 17.0% or 463 of the total 2,720 families live below the poverty line. Families with 3 or 4 children have the highest poverty rate of 30.2%, comprising of 105 families. On the other hand, families with 5 or more children have the lowest poverty rate of 0.0%, which includes 0 families.
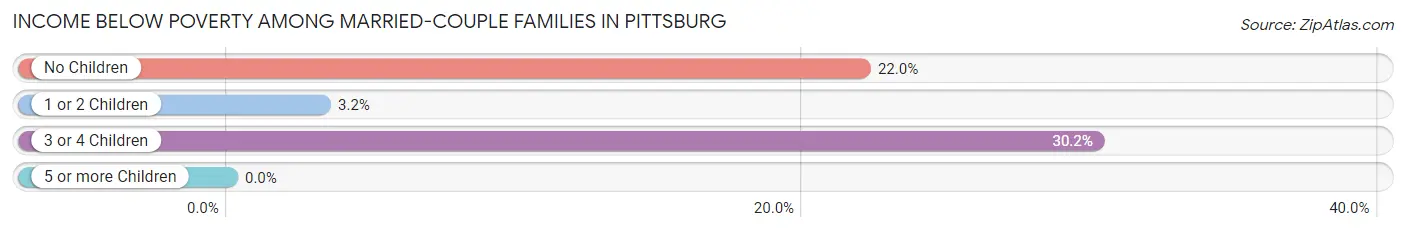
| Children | Above Poverty | Below Poverty |
| No Children | 1,167 (78.0%) | 330 (22.0%) |
| 1 or 2 Children | 835 (96.8%) | 28 (3.2%) |
| 3 or 4 Children | 243 (69.8%) | 105 (30.2%) |
| 5 or more Children | 12 (100.0%) | 0 (0.0%) |
| Total | 2,257 (83.0%) | 463 (17.0%) |
Income Below Poverty Among Single-Parent Households in Pittsburg
According to the poverty data in Pittsburg, 3.4% or 18 single-father households and 45.6% or 551 single-mother households are living below the poverty line. Among single-father households, those with 3 or 4 children have the highest poverty rate, with 5 households (31.2%) experiencing poverty. Likewise, among single-mother households, those with 3 or 4 children have the highest poverty rate, with 148 households (69.5%) falling below the poverty line.
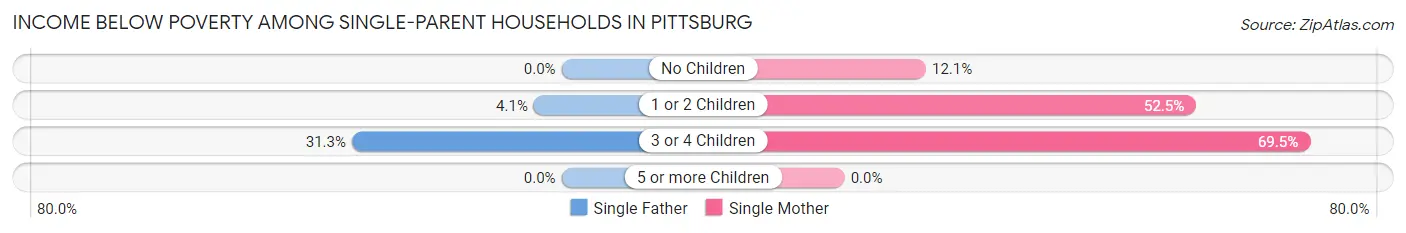
| Children | Single Father | Single Mother |
| No Children | 0 (0.0%) | 36 (12.1%) |
| 1 or 2 Children | 13 (4.1%) | 367 (52.5%) |
| 3 or 4 Children | 5 (31.2%) | 148 (69.5%) |
| 5 or more Children | 0 (0.0%) | 0 (0.0%) |
| Total | 18 (3.4%) | 551 (45.6%) |
Income Below Poverty Among Married-Couple vs Single-Parent Households in Pittsburg
The poverty data for Pittsburg shows that 463 of the married-couple family households (17.0%) and 569 of the single-parent households (32.7%) are living below the poverty level. Within the married-couple family households, those with 3 or 4 children have the highest poverty rate, with 105 households (30.2%) falling below the poverty line. Among the single-parent households, those with 3 or 4 children have the highest poverty rate, with 153 household (66.8%) living below poverty.
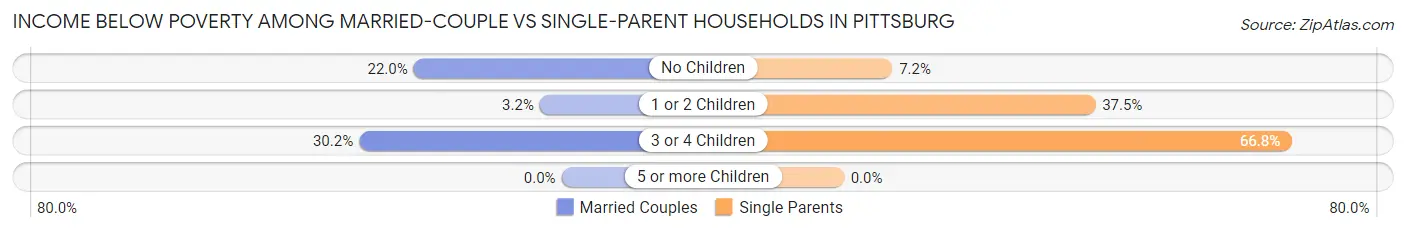
| Children | Married-Couple Families | Single-Parent Households |
| No Children | 330 (22.0%) | 36 (7.2%) |
| 1 or 2 Children | 28 (3.2%) | 380 (37.5%) |
| 3 or 4 Children | 105 (30.2%) | 153 (66.8%) |
| 5 or more Children | 0 (0.0%) | 0 (0.0%) |
| Total | 463 (17.0%) | 569 (32.7%) |
Race in Pittsburg
The most populous races in Pittsburg are White / Caucasian (17,927 | 87.0%), Hispanic or Latino (2,202 | 10.7%), and Two or more Races (1,097 | 5.3%).
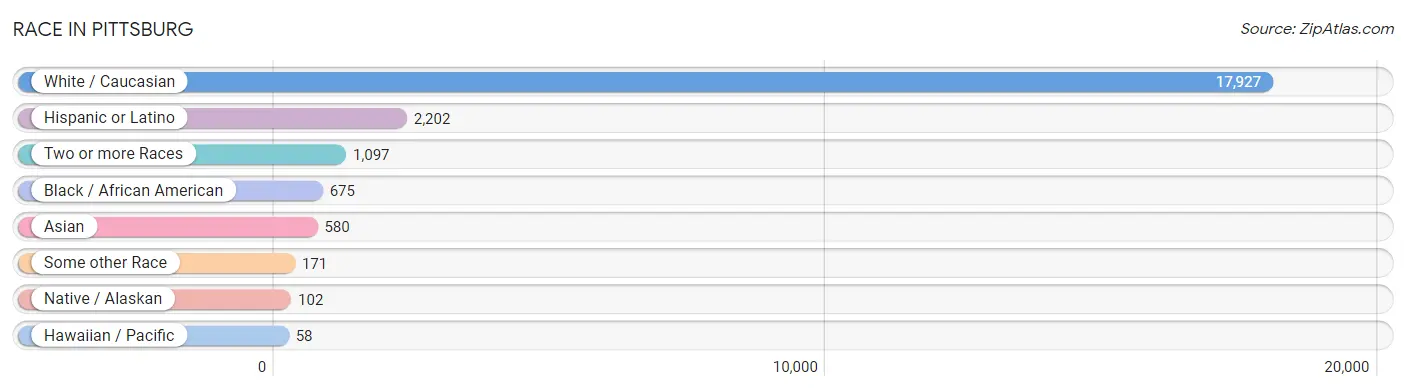
| Race | # Population | % Population |
| Asian | 580 | 2.8% |
| Black / African American | 675 | 3.3% |
| Hawaiian / Pacific | 58 | 0.3% |
| Hispanic or Latino | 2,202 | 10.7% |
| Native / Alaskan | 102 | 0.5% |
| White / Caucasian | 17,927 | 87.0% |
| Two or more Races | 1,097 | 5.3% |
| Some other Race | 171 | 0.8% |
| Total | 20,610 | 100.0% |
Ancestry in Pittsburg
The most populous ancestries reported in Pittsburg are German (4,021 | 19.5%), Irish (3,105 | 15.1%), English (2,552 | 12.4%), American (2,311 | 11.2%), and Mexican (1,523 | 7.4%), together accounting for 65.6% of all Pittsburg residents.
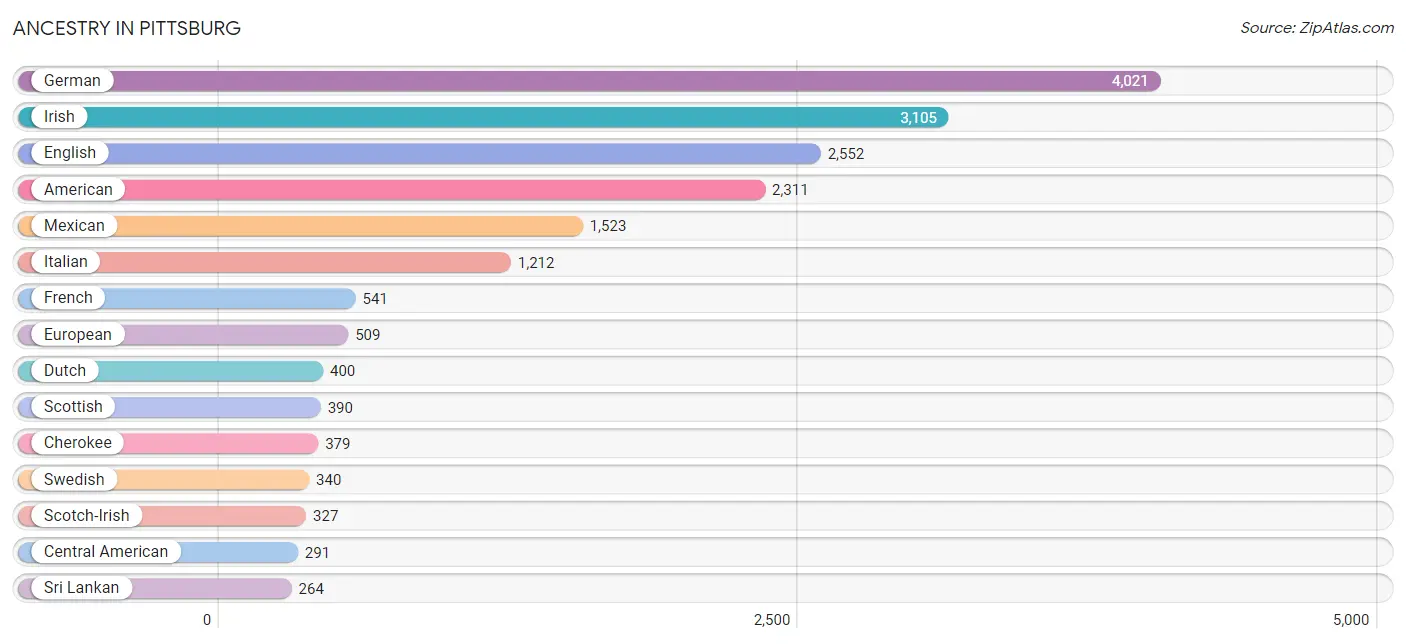
| Ancestry | # Population | % Population |
| African | 5 | 0.0% |
| American | 2,311 | 11.2% |
| Arab | 78 | 0.4% |
| Austrian | 57 | 0.3% |
| Belgian | 8 | 0.0% |
| Blackfeet | 136 | 0.7% |
| British | 90 | 0.4% |
| Burmese | 6 | 0.0% |
| Cajun | 9 | 0.0% |
| Canadian | 26 | 0.1% |
| Central American | 291 | 1.4% |
| Cherokee | 379 | 1.8% |
| Cheyenne | 5 | 0.0% |
| Chickasaw | 2 | 0.0% |
| Chilean | 17 | 0.1% |
| Chippewa | 11 | 0.1% |
| Choctaw | 33 | 0.2% |
| Creek | 10 | 0.1% |
| Cuban | 49 | 0.2% |
| Czech | 246 | 1.2% |
| Czechoslovakian | 26 | 0.1% |
| Danish | 64 | 0.3% |
| Dominican | 9 | 0.0% |
| Dutch | 400 | 1.9% |
| Eastern European | 11 | 0.1% |
| English | 2,552 | 12.4% |
| European | 509 | 2.5% |
| Finnish | 13 | 0.1% |
| French | 541 | 2.6% |
| French Canadian | 66 | 0.3% |
| German | 4,021 | 19.5% |
| Greek | 52 | 0.3% |
| Guatemalan | 134 | 0.6% |
| Haitian | 16 | 0.1% |
| Indian (Asian) | 98 | 0.5% |
| Iranian | 35 | 0.2% |
| Irish | 3,105 | 15.1% |
| Iroquois | 3 | 0.0% |
| Italian | 1,212 | 5.9% |
| Kenyan | 7 | 0.0% |
| Korean | 124 | 0.6% |
| Lebanese | 70 | 0.3% |
| Lithuanian | 6 | 0.0% |
| Mexican | 1,523 | 7.4% |
| Navajo | 10 | 0.1% |
| Nicaraguan | 22 | 0.1% |
| Northern European | 7 | 0.0% |
| Norwegian | 245 | 1.2% |
| Osage | 21 | 0.1% |
| Pakistani | 149 | 0.7% |
| Paraguayan | 84 | 0.4% |
| Peruvian | 15 | 0.1% |
| Polish | 256 | 1.2% |
| Pueblo | 8 | 0.0% |
| Puerto Rican | 170 | 0.8% |
| Romanian | 7 | 0.0% |
| Russian | 207 | 1.0% |
| Salvadoran | 135 | 0.7% |
| Scandinavian | 93 | 0.4% |
| Scotch-Irish | 327 | 1.6% |
| Scottish | 390 | 1.9% |
| Sioux | 8 | 0.0% |
| Slavic | 14 | 0.1% |
| Slovene | 45 | 0.2% |
| South American | 116 | 0.6% |
| Spaniard | 11 | 0.1% |
| Spanish | 9 | 0.0% |
| Sri Lankan | 264 | 1.3% |
| Subsaharan African | 12 | 0.1% |
| Swedish | 340 | 1.7% |
| Swiss | 77 | 0.4% |
| Thai | 50 | 0.2% |
| Tongan | 20 | 0.1% |
| Welsh | 59 | 0.3% |
| Yugoslavian | 16 | 0.1% | View All 75 Rows |
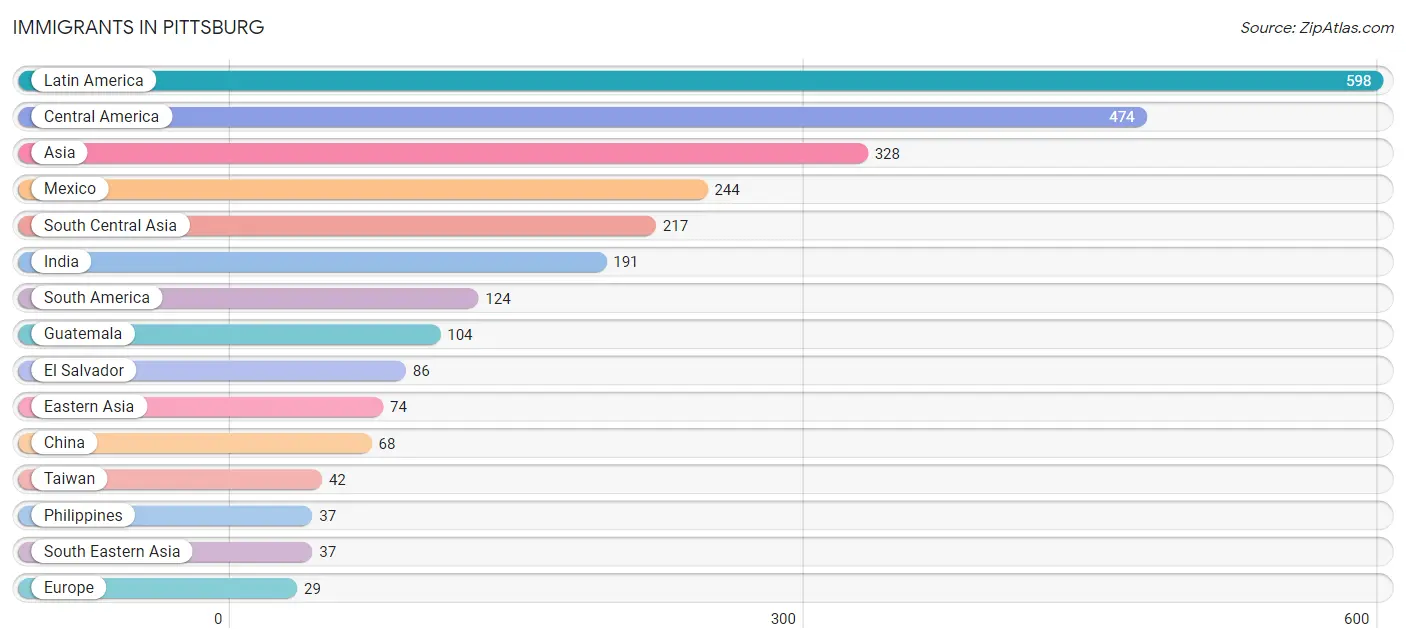
Immigrants in Pittsburg
The most numerous immigrant groups reported in Pittsburg came from Latin America (598 | 2.9%), Central America (474 | 2.3%), Asia (328 | 1.6%), Mexico (244 | 1.2%), and South Central Asia (217 | 1.1%), together accounting for 9.0% of all Pittsburg residents.
| Immigration Origin | # Population | % Population |
| Africa | 8 | 0.0% |
| Asia | 328 | 1.6% |
| Brazil | 8 | 0.0% |
| Canada | 13 | 0.1% |
| Central America | 474 | 2.3% |
| Chile | 17 | 0.1% |
| China | 68 | 0.3% |
| Eastern Africa | 7 | 0.0% |
| Eastern Asia | 74 | 0.4% |
| Eastern Europe | 13 | 0.1% |
| El Salvador | 86 | 0.4% |
| Europe | 29 | 0.1% |
| Guatemala | 104 | 0.5% |
| Honduras | 18 | 0.1% |
| India | 191 | 0.9% |
| Iran | 26 | 0.1% |
| Kenya | 7 | 0.0% |
| Korea | 6 | 0.0% |
| Latin America | 598 | 2.9% |
| Mexico | 244 | 1.2% |
| Nicaragua | 22 | 0.1% |
| Northern Europe | 16 | 0.1% |
| Oceania | 22 | 0.1% |
| Peru | 15 | 0.1% |
| Philippines | 37 | 0.2% |
| Russia | 13 | 0.1% |
| Scotland | 5 | 0.0% |
| South America | 124 | 0.6% |
| South Central Asia | 217 | 1.1% |
| South Eastern Asia | 37 | 0.2% |
| Taiwan | 42 | 0.2% | View All 31 Rows |
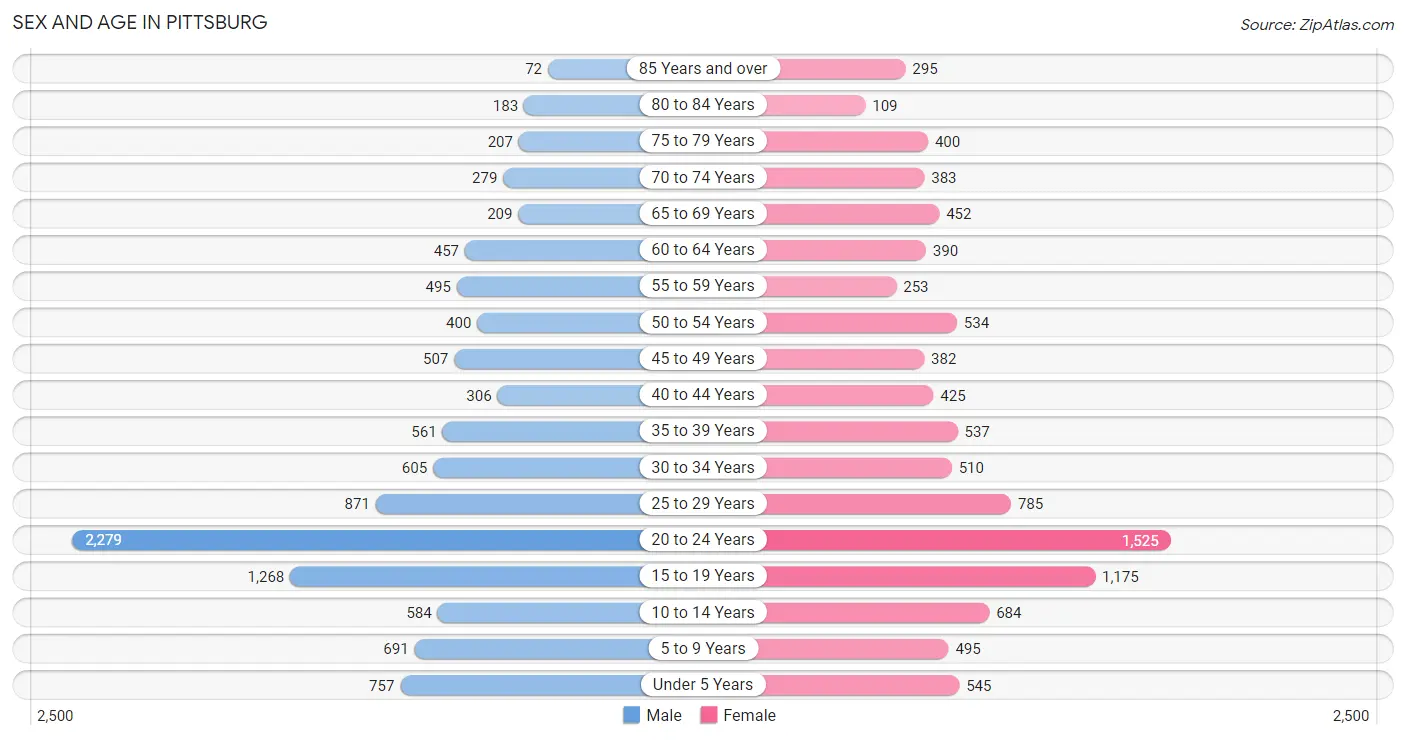
Sex and Age in Pittsburg
Sex and Age in Pittsburg
The most populous age groups in Pittsburg are 20 to 24 Years (2,279 | 21.2%) for men and 20 to 24 Years (1,525 | 15.4%) for women.
| Age Bracket | Male | Female |
| Under 5 Years | 757 (7.0%) | 545 (5.5%) |
| 5 to 9 Years | 691 (6.4%) | 495 (5.0%) |
| 10 to 14 Years | 584 (5.4%) | 684 (6.9%) |
| 15 to 19 Years | 1,268 (11.8%) | 1,175 (11.9%) |
| 20 to 24 Years | 2,279 (21.2%) | 1,525 (15.4%) |
| 25 to 29 Years | 871 (8.1%) | 785 (8.0%) |
| 30 to 34 Years | 605 (5.6%) | 510 (5.2%) |
| 35 to 39 Years | 561 (5.2%) | 537 (5.4%) |
| 40 to 44 Years | 306 (2.9%) | 425 (4.3%) |
| 45 to 49 Years | 507 (4.7%) | 382 (3.9%) |
| 50 to 54 Years | 400 (3.7%) | 534 (5.4%) |
| 55 to 59 Years | 495 (4.6%) | 253 (2.6%) |
| 60 to 64 Years | 457 (4.3%) | 390 (4.0%) |
| 65 to 69 Years | 209 (1.9%) | 452 (4.6%) |
| 70 to 74 Years | 279 (2.6%) | 383 (3.9%) |
| 75 to 79 Years | 207 (1.9%) | 400 (4.1%) |
| 80 to 84 Years | 183 (1.7%) | 109 (1.1%) |
| 85 Years and over | 72 (0.7%) | 295 (3.0%) |
| Total | 10,731 (100.0%) | 9,879 (100.0%) |
Families and Households in Pittsburg
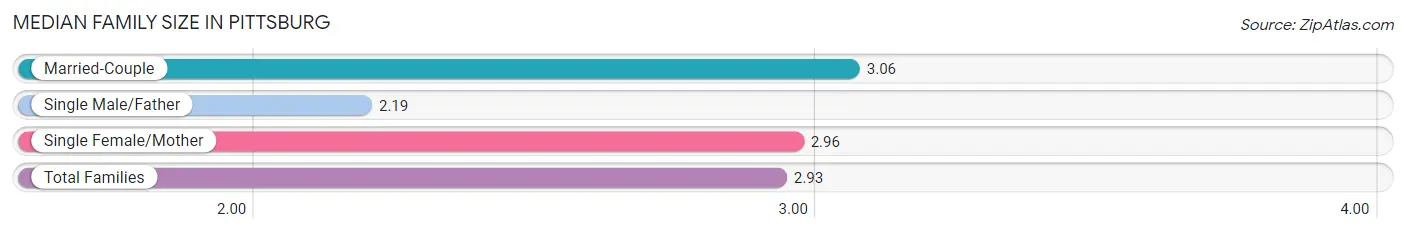
Median Family Size in Pittsburg
The median family size in Pittsburg is 2.93 persons per family, with married-couple families (2,720 | 61.0%) accounting for the largest median family size of 3.06 persons per family. On the other hand, single male/father families (531 | 11.9%) represent the smallest median family size with 2.19 persons per family.
| Family Type | # Families | Family Size |
| Married-Couple | 2,720 (61.0%) | 3.06 |
| Single Male/Father | 531 (11.9%) | 2.19 |
| Single Female/Mother | 1,209 (27.1%) | 2.96 |
| Total Families | 4,460 (100.0%) | 2.93 |
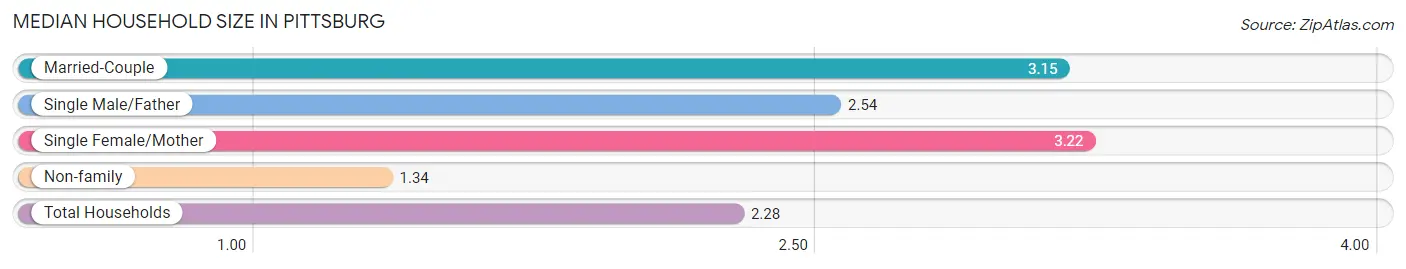
Median Household Size in Pittsburg
The median household size in Pittsburg is 2.28 persons per household, with single female/mother households (1,209 | 14.6%) accounting for the largest median household size of 3.22 persons per household. non-family households (3,845 | 46.3%) represent the smallest median household size with 1.34 persons per household.
| Household Type | # Households | Household Size |
| Married-Couple | 2,720 (32.8%) | 3.15 |
| Single Male/Father | 531 (6.4%) | 2.54 |
| Single Female/Mother | 1,209 (14.6%) | 3.22 |
| Non-family | 3,845 (46.3%) | 1.34 |
| Total Households | 8,305 (100.0%) | 2.28 |
Household Size by Marriage Status in Pittsburg
Out of a total of 8,305 households in Pittsburg, 4,460 (53.7%) are family households, while 3,845 (46.3%) are nonfamily households. The most numerous type of family households are 2-person households, comprising 1,894, and the most common type of nonfamily households are 1-person households, comprising 2,962.
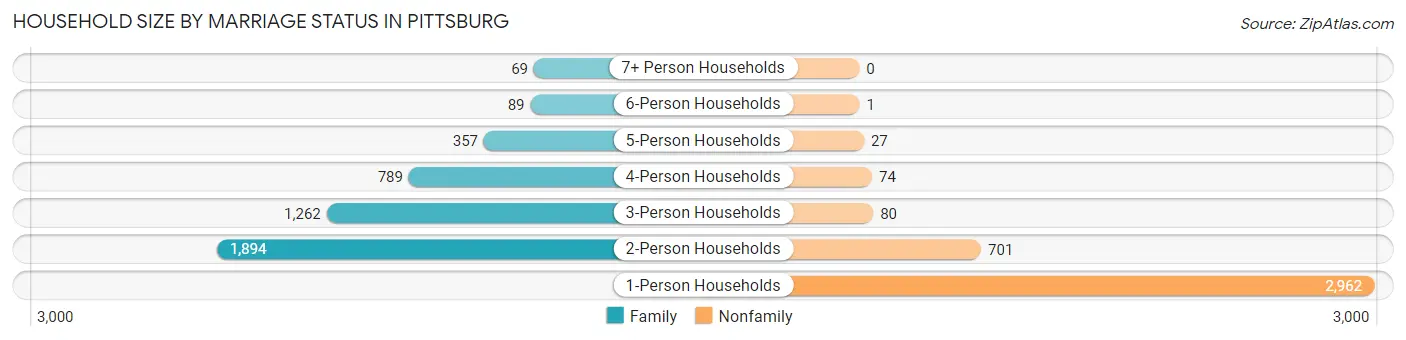
| Household Size | Family Households | Nonfamily Households |
| 1-Person Households | - | 2,962 (35.7%) |
| 2-Person Households | 1,894 (22.8%) | 701 (8.4%) |
| 3-Person Households | 1,262 (15.2%) | 80 (1.0%) |
| 4-Person Households | 789 (9.5%) | 74 (0.9%) |
| 5-Person Households | 357 (4.3%) | 27 (0.3%) |
| 6-Person Households | 89 (1.1%) | 1 (0.0%) |
| 7+ Person Households | 69 (0.8%) | 0 (0.0%) |
| Total | 4,460 (53.7%) | 3,845 (46.3%) |
Female Fertility in Pittsburg
Fertility by Age in Pittsburg
Average fertility rate in Pittsburg is 65.0 births per 1,000 women. Women in the age bracket of 20 to 34 years have the highest fertility rate with 122.0 births per 1,000 women. Women in the age bracket of 20 to 34 years acount for 97.4% of all women with births.
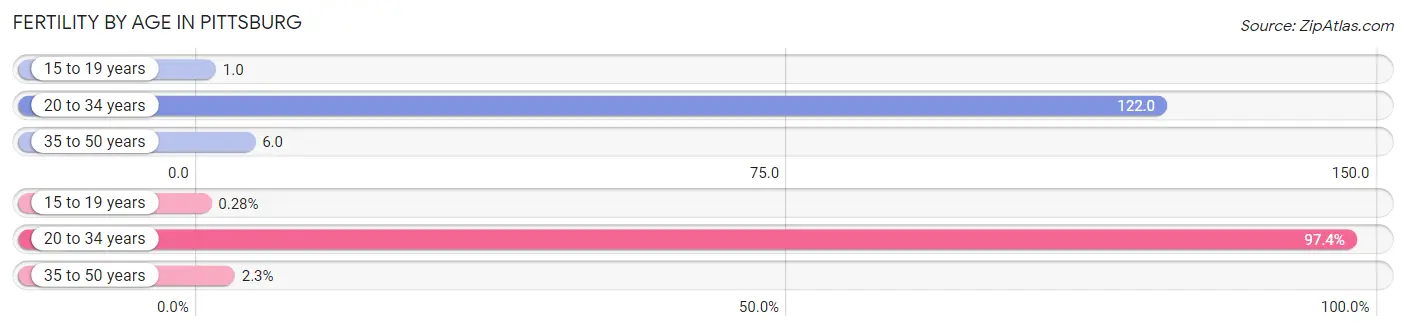
| Age Bracket | Women with Births | Births / 1,000 Women |
| 15 to 19 years | 1 (0.3%) | 1.0 |
| 20 to 34 years | 343 (97.4%) | 122.0 |
| 35 to 50 years | 8 (2.3%) | 6.0 |
| Total | 352 (100.0%) | 65.0 |
Fertility by Age by Marriage Status in Pittsburg
63.1% of women with births (352) in Pittsburg are married. The highest percentage of unmarried women with births falls into 15 to 19 years age bracket with 100.0% of them unmarried at the time of birth, while the lowest percentage of unmarried women with births belong to 20 to 34 years age bracket with 36.4% of them unmarried.
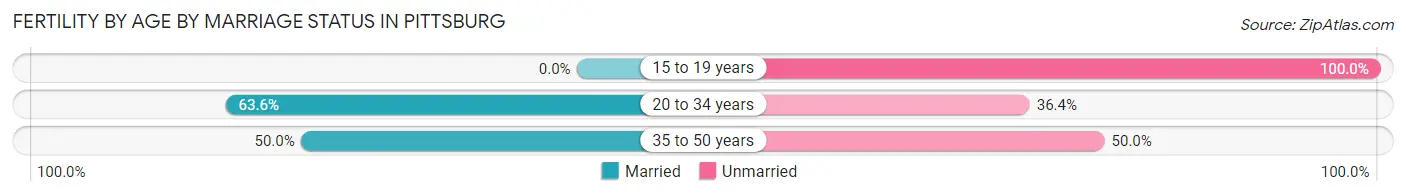
| Age Bracket | Married | Unmarried |
| 15 to 19 years | 0 (0.0%) | 1 (100.0%) |
| 20 to 34 years | 218 (63.6%) | 125 (36.4%) |
| 35 to 50 years | 4 (50.0%) | 4 (50.0%) |
| Total | 222 (63.1%) | 130 (36.9%) |
Fertility by Education in Pittsburg
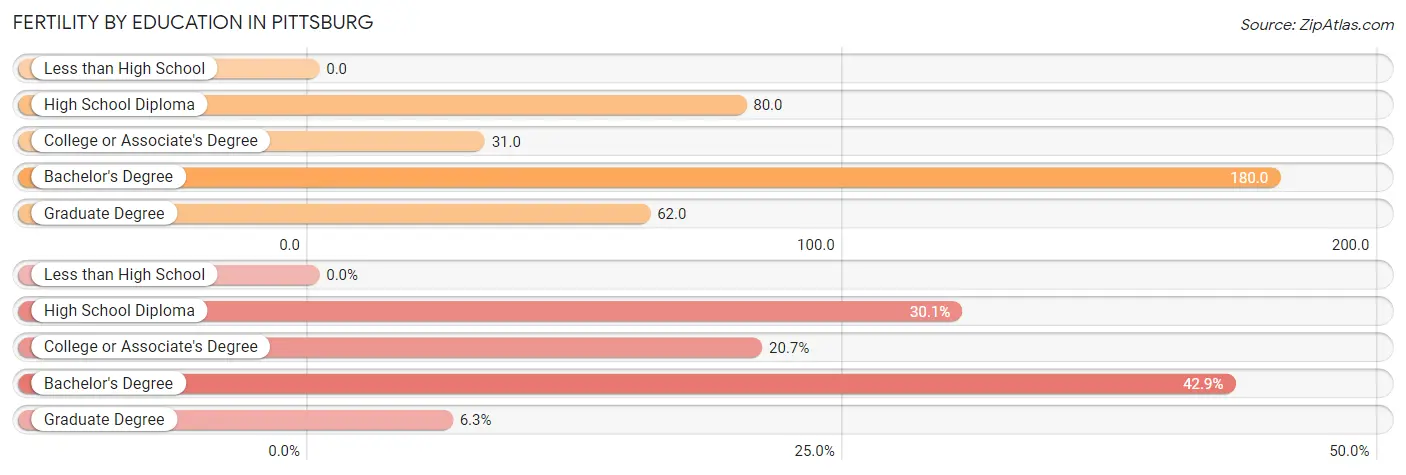
| Educational Attainment | Women with Births | Births / 1,000 Women |
| Less than High School | 0 (0.0%) | 0.0 |
| High School Diploma | 106 (30.1%) | 80.0 |
| College or Associate's Degree | 73 (20.7%) | 31.0 |
| Bachelor's Degree | 151 (42.9%) | 180.0 |
| Graduate Degree | 22 (6.2%) | 62.0 |
| Total | 352 (100.0%) | 65.0 |
Fertility by Education by Marriage Status in Pittsburg
36.9% of women with births in Pittsburg are unmarried. Women with the educational attainment of graduate degree are most likely to be married with 81.8% of them married at childbirth, while women with the educational attainment of college or associate's degree are least likely to be married with 47.9% of them unmarried at childbirth.
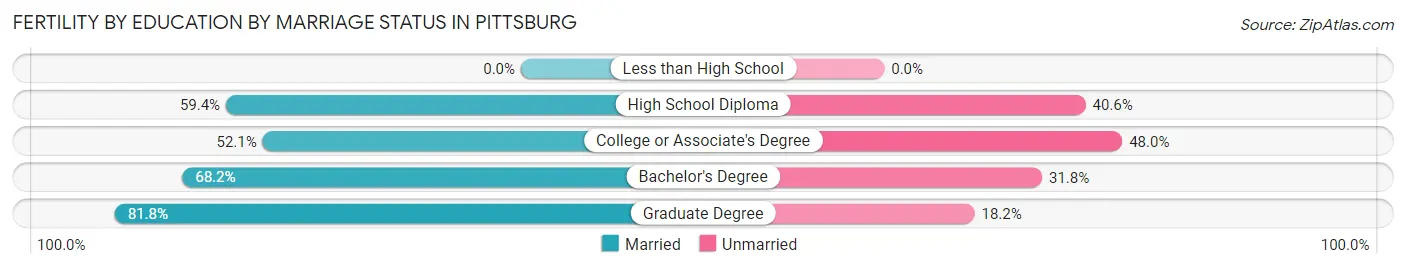
| Educational Attainment | Married | Unmarried |
| Less than High School | 0 (0.0%) | 0 (0.0%) |
| High School Diploma | 63 (59.4%) | 43 (40.6%) |
| College or Associate's Degree | 38 (52.0%) | 35 (47.9%) |
| Bachelor's Degree | 103 (68.2%) | 48 (31.8%) |
| Graduate Degree | 18 (81.8%) | 4 (18.2%) |
| Total | 222 (63.1%) | 130 (36.9%) |
Employment Characteristics in Pittsburg
Employment by Class of Employer in Pittsburg
Among the 10,139 employed individuals in Pittsburg, private company employees (6,875 | 67.8%), local government employees (876 | 8.6%), and state government employees (851 | 8.4%) make up the most common classes of employment.
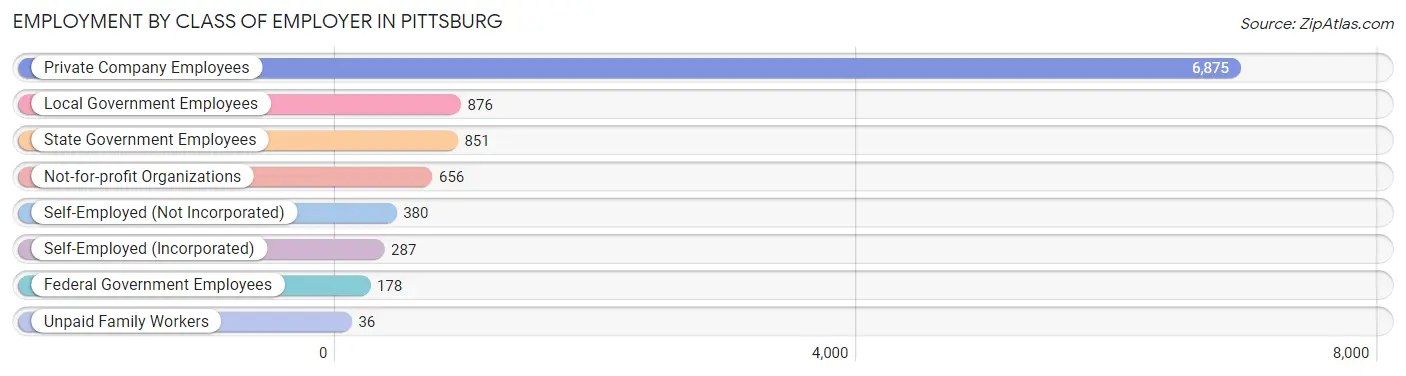
| Employer Class | # Employees | % Employees |
| Private Company Employees | 6,875 | 67.8% |
| Self-Employed (Incorporated) | 287 | 2.8% |
| Self-Employed (Not Incorporated) | 380 | 3.7% |
| Not-for-profit Organizations | 656 | 6.5% |
| Local Government Employees | 876 | 8.6% |
| State Government Employees | 851 | 8.4% |
| Federal Government Employees | 178 | 1.8% |
| Unpaid Family Workers | 36 | 0.4% |
| Total | 10,139 | 100.0% |
Employment Status by Age in Pittsburg
According to the labor force statistics for Pittsburg, out of the total population over 16 years of age (16,587), 65.4% or 10,848 individuals are in the labor force, with 4.0% or 434 of them unemployed. The age group with the highest labor force participation rate is 25 to 29 years, with 88.9% or 1,472 individuals in the labor force. Within the labor force, the 16 to 19 years age range has the highest percentage of unemployed individuals, with 11.5% or 119 of them being unemployed.
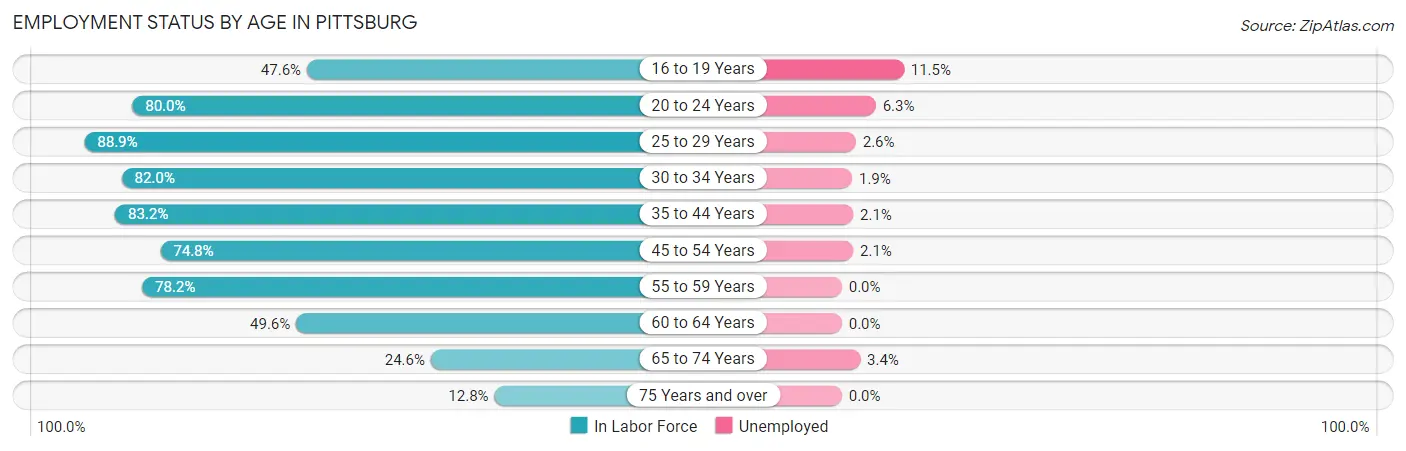
| Age Bracket | In Labor Force | Unemployed |
| 16 to 19 Years | 1,036 (47.6%) | 119 (11.5%) |
| 20 to 24 Years | 3,043 (80.0%) | 192 (6.3%) |
| 25 to 29 Years | 1,472 (88.9%) | 38 (2.6%) |
| 30 to 34 Years | 914 (82.0%) | 17 (1.9%) |
| 35 to 44 Years | 1,522 (83.2%) | 32 (2.1%) |
| 45 to 54 Years | 1,364 (74.8%) | 29 (2.1%) |
| 55 to 59 Years | 585 (78.2%) | 0 (0.0%) |
| 60 to 64 Years | 420 (49.6%) | 0 (0.0%) |
| 65 to 74 Years | 325 (24.6%) | 11 (3.4%) |
| 75 Years and over | 162 (12.8%) | 0 (0.0%) |
| Total | 10,848 (65.4%) | 434 (4.0%) |
Employment Status by Educational Attainment in Pittsburg
According to labor force statistics for Pittsburg, 78.3% of individuals (6,278) out of the total population between 25 and 64 years of age (8,018) are in the labor force, with 1.8% or 113 of them being unemployed. The group with the highest labor force participation rate are those with the educational attainment of bachelor's degree or higher, with 90.3% or 2,349 individuals in the labor force. Within the labor force, individuals with less than high school education have the highest percentage of unemployment, with 7.6% or 14 of them being unemployed.
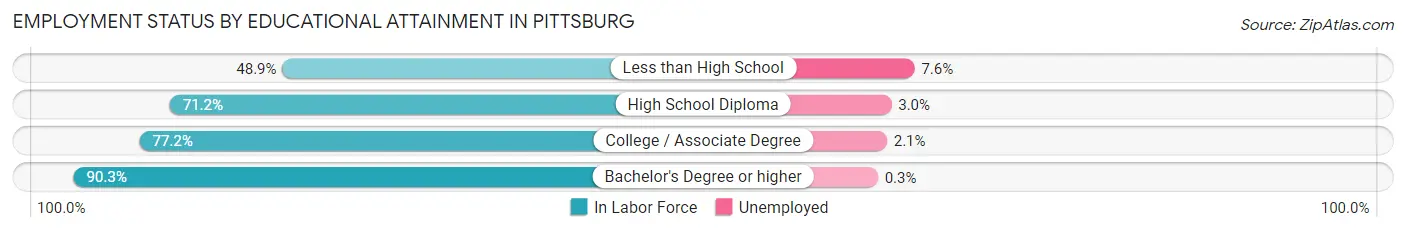
| Educational Attainment | In Labor Force | Unemployed |
| Less than High School | 185 (48.9%) | 29 (7.6%) |
| High School Diploma | 1,741 (71.2%) | 73 (3.0%) |
| College / Associate Degree | 2,003 (77.2%) | 54 (2.1%) |
| Bachelor's Degree or higher | 2,349 (90.3%) | 8 (0.3%) |
| Total | 6,278 (78.3%) | 144 (1.8%) |
Employment Occupations by Sex in Pittsburg
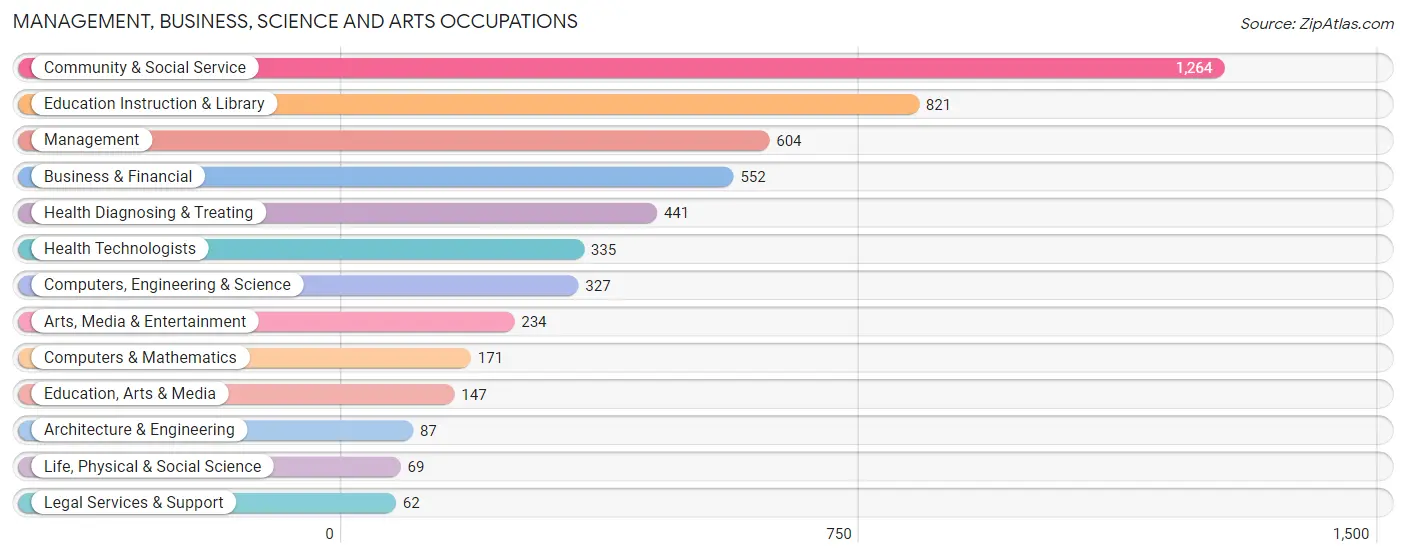
Management, Business, Science and Arts Occupations
The most common Management, Business, Science and Arts occupations in Pittsburg are Community & Social Service (1,264 | 12.1%), Education Instruction & Library (821 | 7.9%), Management (604 | 5.8%), Business & Financial (552 | 5.3%), and Health Diagnosing & Treating (441 | 4.2%).
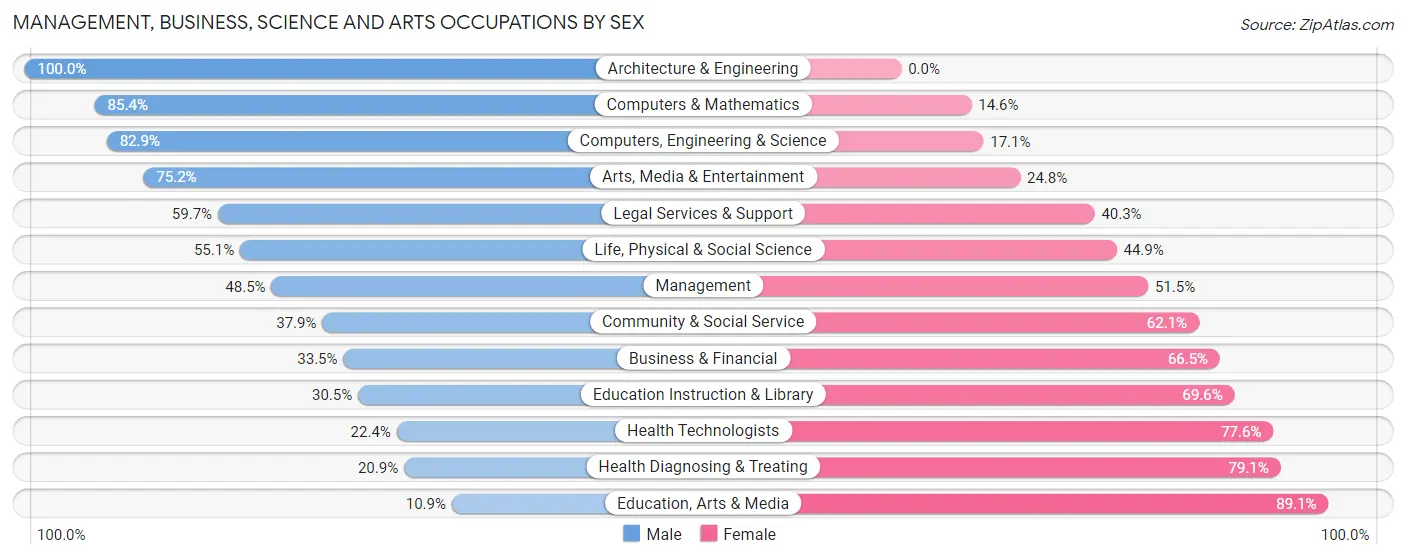
Management, Business, Science and Arts Occupations by Sex
Within the Management, Business, Science and Arts occupations in Pittsburg, the most male-oriented occupations are Architecture & Engineering (100.0%), Computers & Mathematics (85.4%), and Computers, Engineering & Science (82.9%), while the most female-oriented occupations are Education, Arts & Media (89.1%), Health Diagnosing & Treating (79.1%), and Health Technologists (77.6%).
| Occupation | Male | Female |
| Management | 293 (48.5%) | 311 (51.5%) |
| Business & Financial | 185 (33.5%) | 367 (66.5%) |
| Computers, Engineering & Science | 271 (82.9%) | 56 (17.1%) |
| Computers & Mathematics | 146 (85.4%) | 25 (14.6%) |
| Architecture & Engineering | 87 (100.0%) | 0 (0.0%) |
| Life, Physical & Social Science | 38 (55.1%) | 31 (44.9%) |
| Community & Social Service | 479 (37.9%) | 785 (62.1%) |
| Education, Arts & Media | 16 (10.9%) | 131 (89.1%) |
| Legal Services & Support | 37 (59.7%) | 25 (40.3%) |
| Education Instruction & Library | 250 (30.4%) | 571 (69.6%) |
| Arts, Media & Entertainment | 176 (75.2%) | 58 (24.8%) |
| Health Diagnosing & Treating | 92 (20.9%) | 349 (79.1%) |
| Health Technologists | 75 (22.4%) | 260 (77.6%) |
| Total (Category) | 1,320 (41.4%) | 1,868 (58.6%) |
| Total (Overall) | 5,633 (54.1%) | 4,775 (45.9%) |
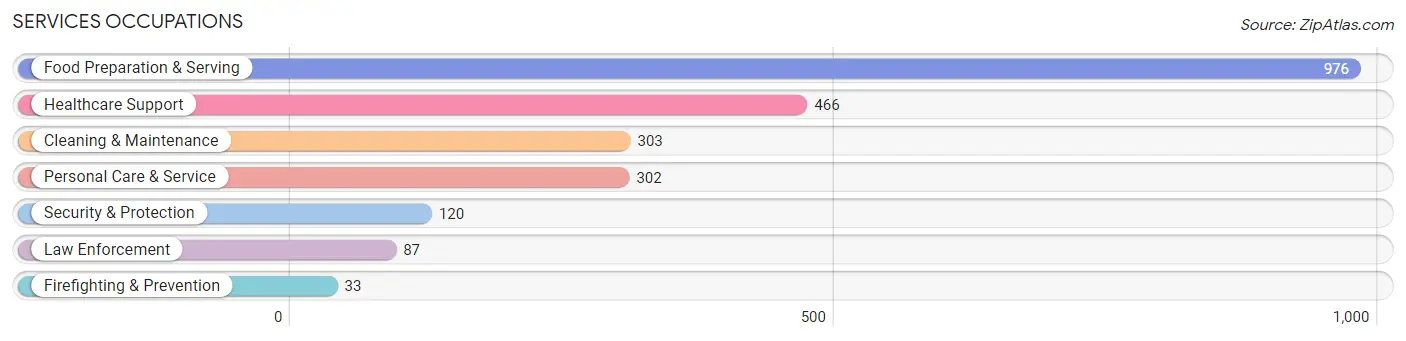
Services Occupations
The most common Services occupations in Pittsburg are Food Preparation & Serving (976 | 9.4%), Healthcare Support (466 | 4.5%), Cleaning & Maintenance (303 | 2.9%), Personal Care & Service (302 | 2.9%), and Security & Protection (120 | 1.1%).
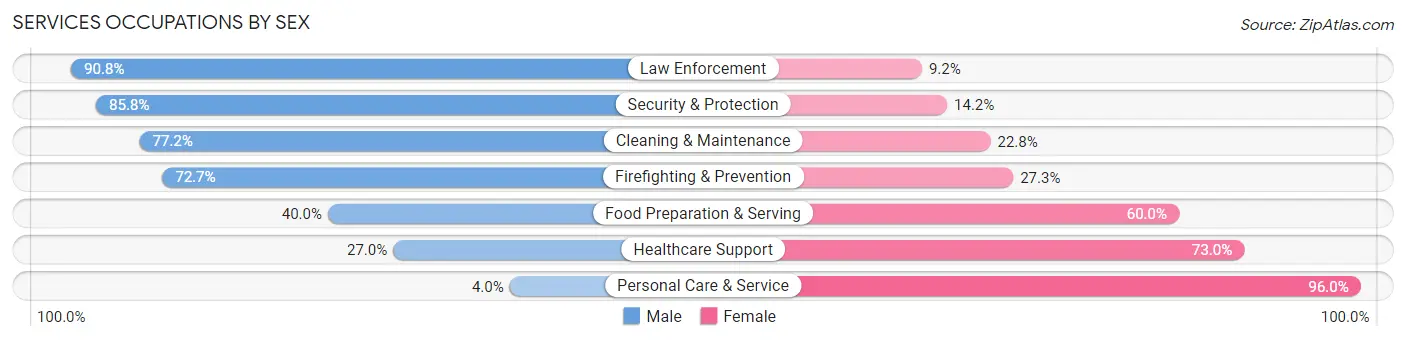
Services Occupations by Sex
Within the Services occupations in Pittsburg, the most male-oriented occupations are Law Enforcement (90.8%), Security & Protection (85.8%), and Cleaning & Maintenance (77.2%), while the most female-oriented occupations are Personal Care & Service (96.0%), Healthcare Support (73.0%), and Food Preparation & Serving (60.0%).
| Occupation | Male | Female |
| Healthcare Support | 126 (27.0%) | 340 (73.0%) |
| Security & Protection | 103 (85.8%) | 17 (14.2%) |
| Firefighting & Prevention | 24 (72.7%) | 9 (27.3%) |
| Law Enforcement | 79 (90.8%) | 8 (9.2%) |
| Food Preparation & Serving | 390 (40.0%) | 586 (60.0%) |
| Cleaning & Maintenance | 234 (77.2%) | 69 (22.8%) |
| Personal Care & Service | 12 (4.0%) | 290 (96.0%) |
| Total (Category) | 865 (39.9%) | 1,302 (60.1%) |
| Total (Overall) | 5,633 (54.1%) | 4,775 (45.9%) |
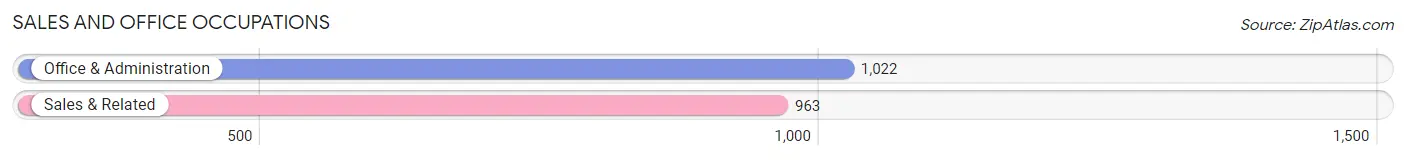
Sales and Office Occupations
The most common Sales and Office occupations in Pittsburg are Office & Administration (1,022 | 9.8%), and Sales & Related (963 | 9.2%).
Sales and Office Occupations by Sex
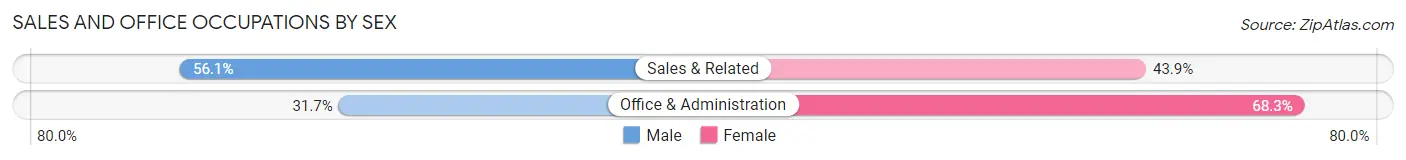
| Occupation | Male | Female |
| Sales & Related | 540 (56.1%) | 423 (43.9%) |
| Office & Administration | 324 (31.7%) | 698 (68.3%) |
| Total (Category) | 864 (43.5%) | 1,121 (56.5%) |
| Total (Overall) | 5,633 (54.1%) | 4,775 (45.9%) |
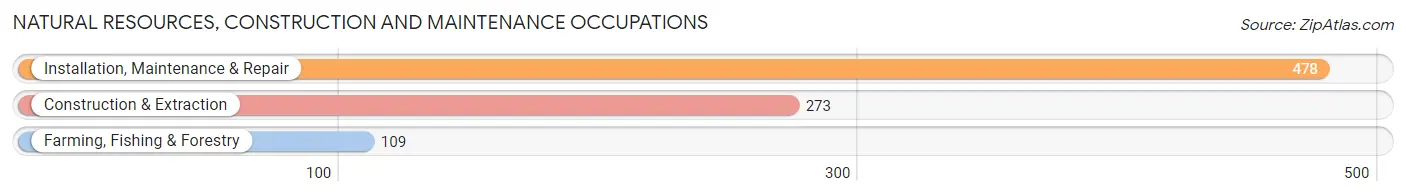
Natural Resources, Construction and Maintenance Occupations
The most common Natural Resources, Construction and Maintenance occupations in Pittsburg are Installation, Maintenance & Repair (478 | 4.6%), Construction & Extraction (273 | 2.6%), and Farming, Fishing & Forestry (109 | 1.1%).
Natural Resources, Construction and Maintenance Occupations by Sex
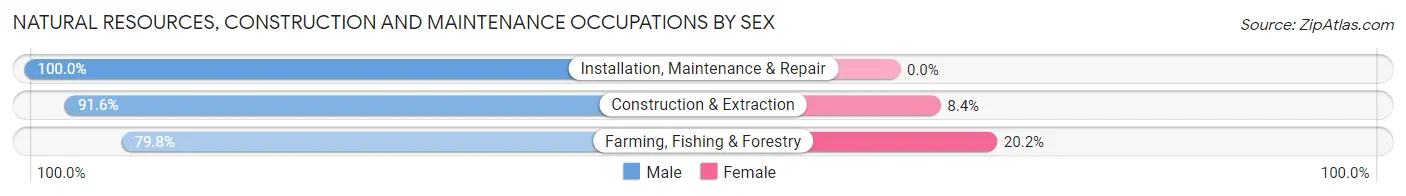
| Occupation | Male | Female |
| Farming, Fishing & Forestry | 87 (79.8%) | 22 (20.2%) |
| Construction & Extraction | 250 (91.6%) | 23 (8.4%) |
| Installation, Maintenance & Repair | 478 (100.0%) | 0 (0.0%) |
| Total (Category) | 815 (94.8%) | 45 (5.2%) |
| Total (Overall) | 5,633 (54.1%) | 4,775 (45.9%) |
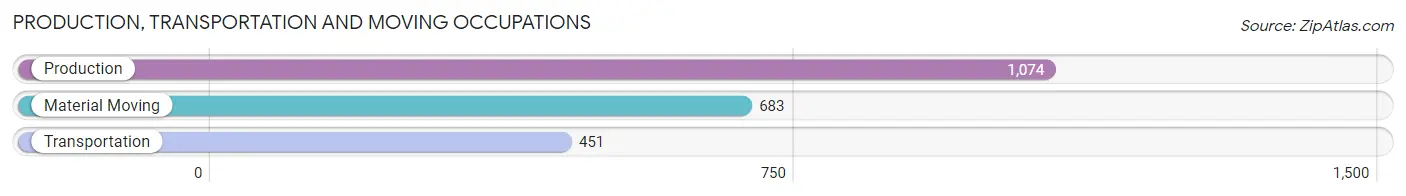
Production, Transportation and Moving Occupations
The most common Production, Transportation and Moving occupations in Pittsburg are Production (1,074 | 10.3%), Material Moving (683 | 6.6%), and Transportation (451 | 4.3%).
Production, Transportation and Moving Occupations by Sex
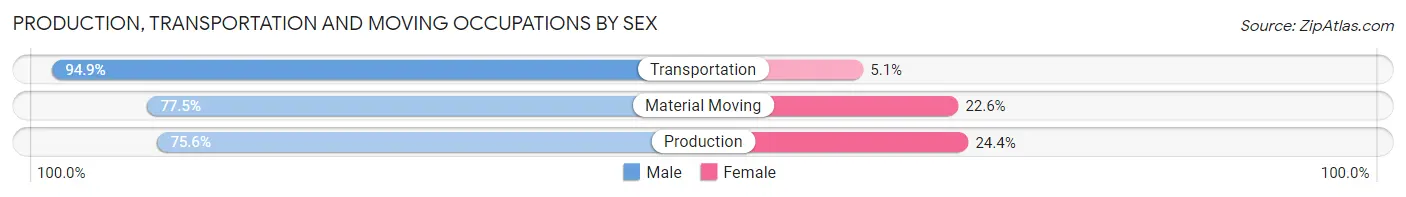
| Occupation | Male | Female |
| Production | 812 (75.6%) | 262 (24.4%) |
| Transportation | 428 (94.9%) | 23 (5.1%) |
| Material Moving | 529 (77.4%) | 154 (22.6%) |
| Total (Category) | 1,769 (80.1%) | 439 (19.9%) |
| Total (Overall) | 5,633 (54.1%) | 4,775 (45.9%) |
Employment Industries by Sex in Pittsburg
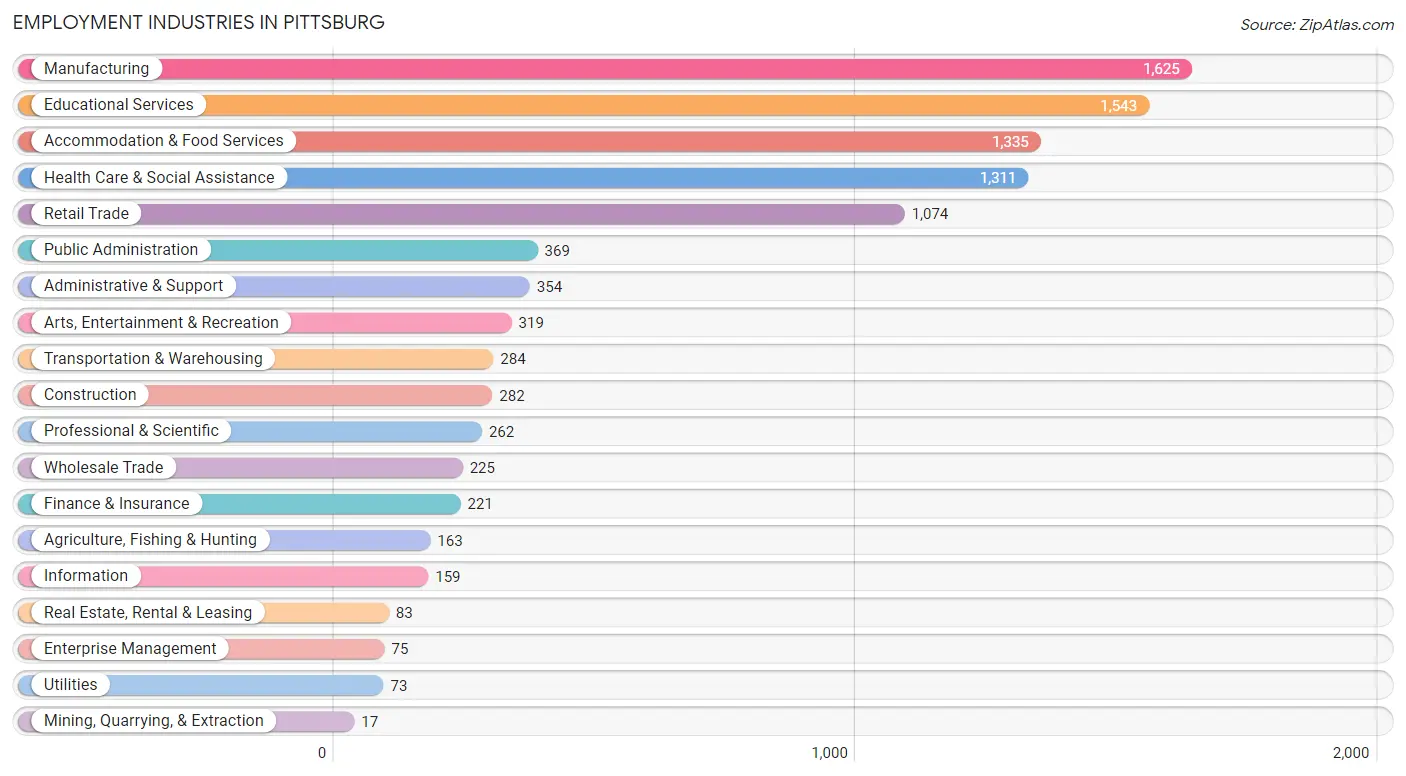
Employment Industries in Pittsburg
The major employment industries in Pittsburg include Manufacturing (1,625 | 15.6%), Educational Services (1,543 | 14.8%), Accommodation & Food Services (1,335 | 12.8%), Health Care & Social Assistance (1,311 | 12.6%), and Retail Trade (1,074 | 10.3%).
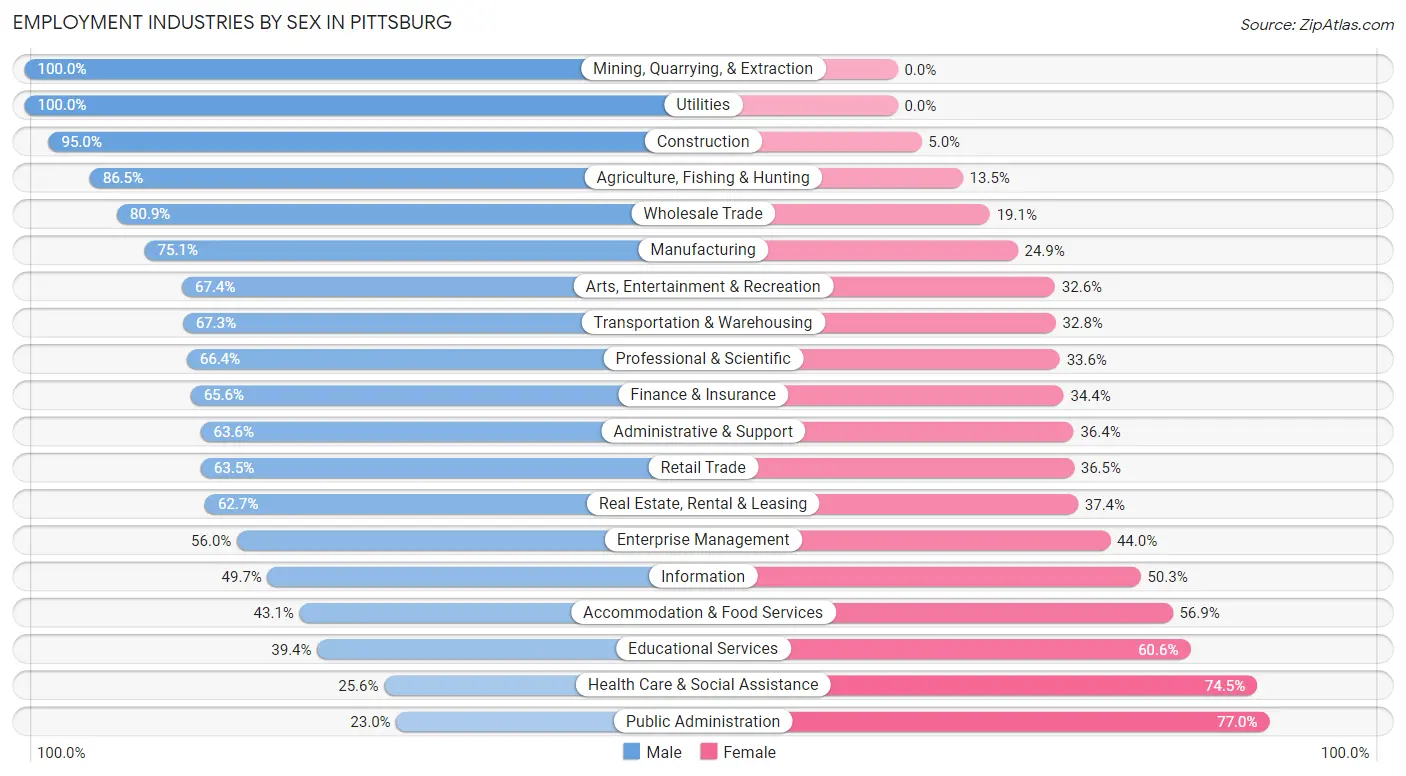
Employment Industries by Sex in Pittsburg
The Pittsburg industries that see more men than women are Mining, Quarrying, & Extraction (100.0%), Utilities (100.0%), and Construction (95.0%), whereas the industries that tend to have a higher number of women are Public Administration (77.0%), Health Care & Social Assistance (74.5%), and Educational Services (60.6%).
| Industry | Male | Female |
| Agriculture, Fishing & Hunting | 141 (86.5%) | 22 (13.5%) |
| Mining, Quarrying, & Extraction | 17 (100.0%) | 0 (0.0%) |
| Construction | 268 (95.0%) | 14 (5.0%) |
| Manufacturing | 1,221 (75.1%) | 404 (24.9%) |
| Wholesale Trade | 182 (80.9%) | 43 (19.1%) |
| Retail Trade | 682 (63.5%) | 392 (36.5%) |
| Transportation & Warehousing | 191 (67.2%) | 93 (32.8%) |
| Utilities | 73 (100.0%) | 0 (0.0%) |
| Information | 79 (49.7%) | 80 (50.3%) |
| Finance & Insurance | 145 (65.6%) | 76 (34.4%) |
| Real Estate, Rental & Leasing | 52 (62.6%) | 31 (37.3%) |
| Professional & Scientific | 174 (66.4%) | 88 (33.6%) |
| Enterprise Management | 42 (56.0%) | 33 (44.0%) |
| Administrative & Support | 225 (63.6%) | 129 (36.4%) |
| Educational Services | 608 (39.4%) | 935 (60.6%) |
| Health Care & Social Assistance | 335 (25.6%) | 976 (74.5%) |
| Arts, Entertainment & Recreation | 215 (67.4%) | 104 (32.6%) |
| Accommodation & Food Services | 575 (43.1%) | 760 (56.9%) |
| Public Administration | 85 (23.0%) | 284 (77.0%) |
| Total | 5,633 (54.1%) | 4,775 (45.9%) |
Education in Pittsburg
School Enrollment in Pittsburg
The most common levels of schooling among the 7,344 students in Pittsburg are college / undergraduate (3,446 | 46.9%), middle school (1,129 | 15.4%), and elementary school (1,000 | 13.6%).
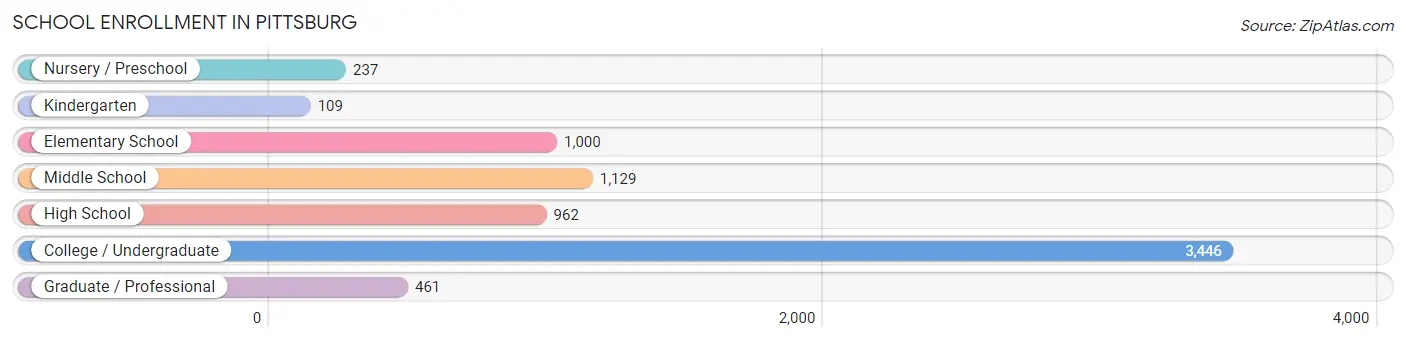
| School Level | # Students | % Students |
| Nursery / Preschool | 237 | 3.2% |
| Kindergarten | 109 | 1.5% |
| Elementary School | 1,000 | 13.6% |
| Middle School | 1,129 | 15.4% |
| High School | 962 | 13.1% |
| College / Undergraduate | 3,446 | 46.9% |
| Graduate / Professional | 461 | 6.3% |
| Total | 7,344 | 100.0% |
School Enrollment by Age by Funding Source in Pittsburg
Out of a total of 7,344 students who are enrolled in schools in Pittsburg, 617 (8.4%) attend a private institution, while the remaining 6,727 (91.6%) are enrolled in public schools. The age group of 35 years and over has the highest likelihood of being enrolled in private schools, with 27 (16.5% in the age bracket) enrolled. Conversely, the age group of 3 to 4 year olds has the lowest likelihood of being enrolled in a private school, with 185 (100.0% in the age bracket) attending a public institution.
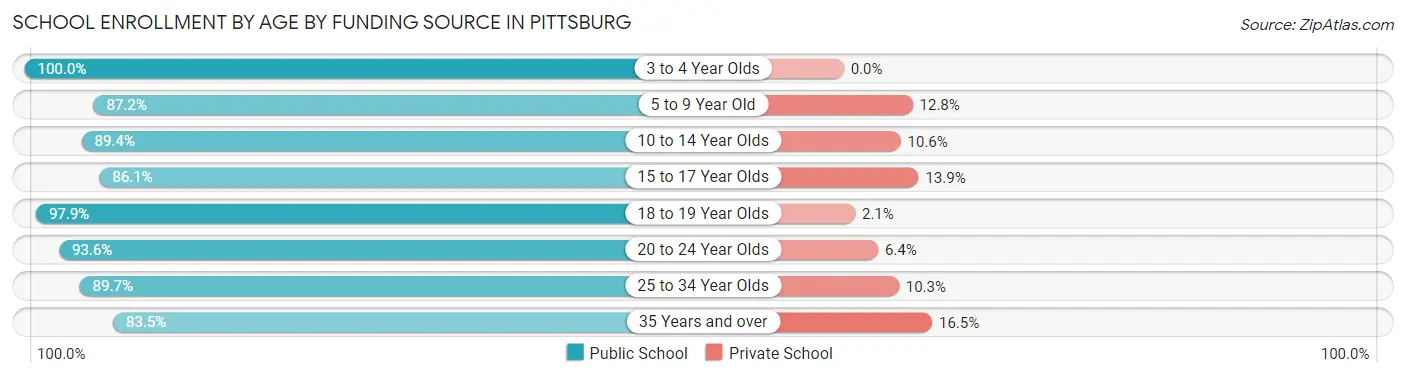
| Age Bracket | Public School | Private School |
| 3 to 4 Year Olds | 185 (100.0%) | 0 (0.0%) |
| 5 to 9 Year Old | 950 (87.2%) | 140 (12.8%) |
| 10 to 14 Year Olds | 1,112 (89.4%) | 132 (10.6%) |
| 15 to 17 Year Olds | 747 (86.1%) | 121 (13.9%) |
| 18 to 19 Year Olds | 1,336 (97.9%) | 29 (2.1%) |
| 20 to 24 Year Olds | 1,990 (93.6%) | 136 (6.4%) |
| 25 to 34 Year Olds | 271 (89.7%) | 31 (10.3%) |
| 35 Years and over | 137 (83.5%) | 27 (16.5%) |
| Total | 6,727 (91.6%) | 617 (8.4%) |
Educational Attainment by Field of Study in Pittsburg
Education (913 | 24.1%), business (625 | 16.5%), science & technology (410 | 10.8%), arts & humanities (275 | 7.3%), and communications (271 | 7.2%) are the most common fields of study among 3,783 individuals in Pittsburg who have obtained a bachelor's degree or higher.
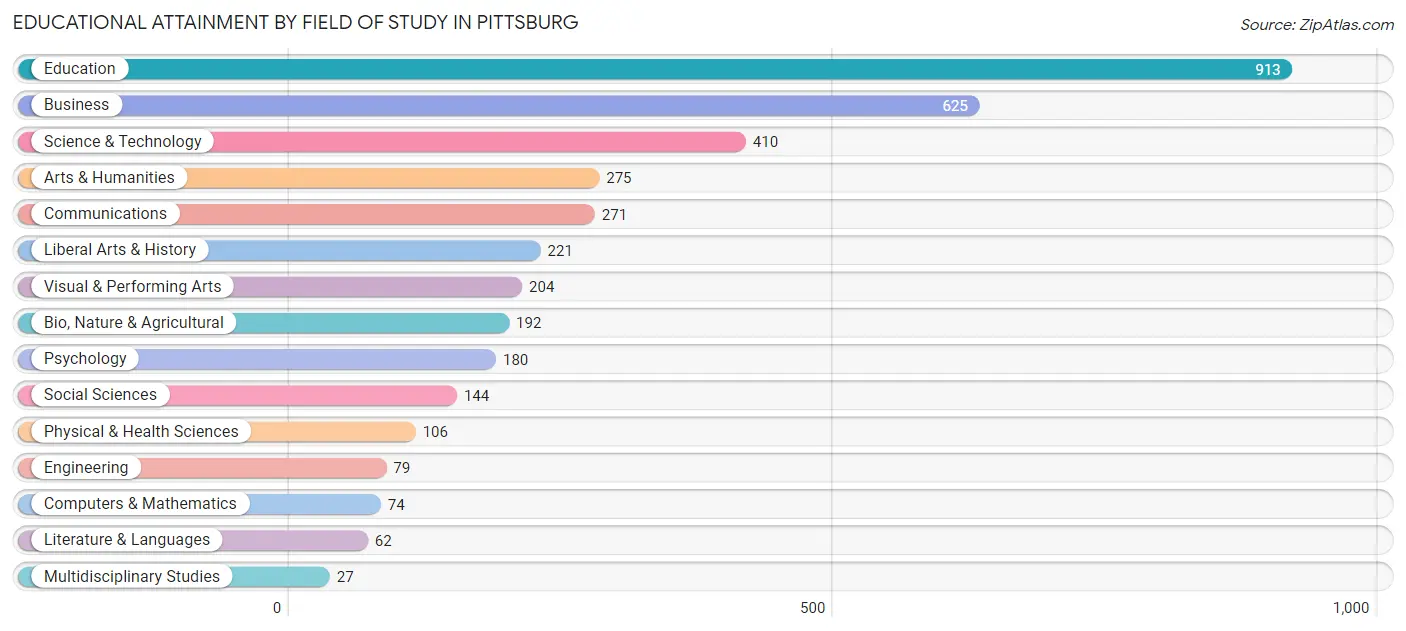
| Field of Study | # Graduates | % Graduates |
| Computers & Mathematics | 74 | 2.0% |
| Bio, Nature & Agricultural | 192 | 5.1% |
| Physical & Health Sciences | 106 | 2.8% |
| Psychology | 180 | 4.8% |
| Social Sciences | 144 | 3.8% |
| Engineering | 79 | 2.1% |
| Multidisciplinary Studies | 27 | 0.7% |
| Science & Technology | 410 | 10.8% |
| Business | 625 | 16.5% |
| Education | 913 | 24.1% |
| Literature & Languages | 62 | 1.6% |
| Liberal Arts & History | 221 | 5.8% |
| Visual & Performing Arts | 204 | 5.4% |
| Communications | 271 | 7.2% |
| Arts & Humanities | 275 | 7.3% |
| Total | 3,783 | 100.0% |
Transportation & Commute in Pittsburg
Vehicle Availability by Sex in Pittsburg
The most prevalent vehicle ownership categories in Pittsburg are males with 2 vehicles (2,105, accounting for 40.1%) and females with 2 vehicles (1,524, making up 48.6%).
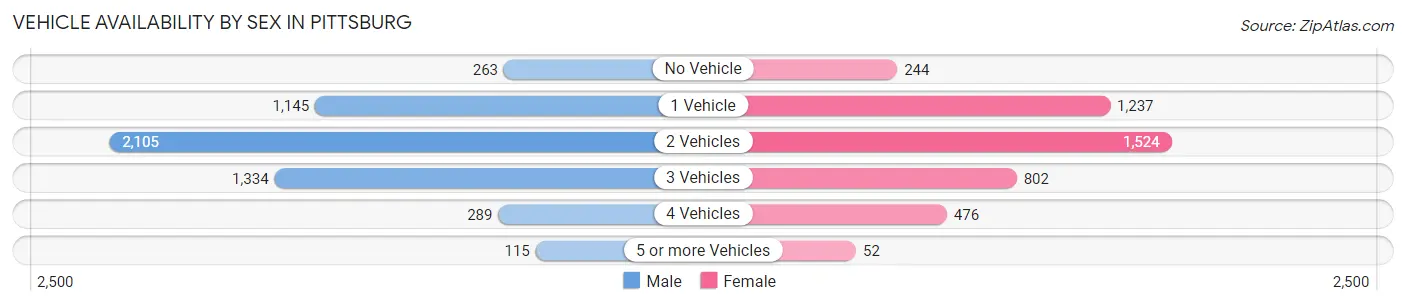
| Vehicles Available | Male | Female |
| No Vehicle | 263 (5.0%) | 244 (5.6%) |
| 1 Vehicle | 1,145 (21.8%) | 1,237 (28.5%) |
| 2 Vehicles | 2,105 (40.1%) | 1,524 (35.2%) |
| 3 Vehicles | 1,334 (25.4%) | 802 (18.5%) |
| 4 Vehicles | 289 (5.5%) | 476 (11.0%) |
| 5 or more Vehicles | 115 (2.2%) | 52 (1.2%) |
| Total | 5,251 (100.0%) | 4,335 (100.0%) |
Commute Time in Pittsburg
The most frequently occuring commute durations in Pittsburg are 5 to 9 minutes (3,478 commuters, 35.7%), 10 to 14 minutes (2,780 commuters, 28.5%), and 15 to 19 minutes (808 commuters, 8.3%).
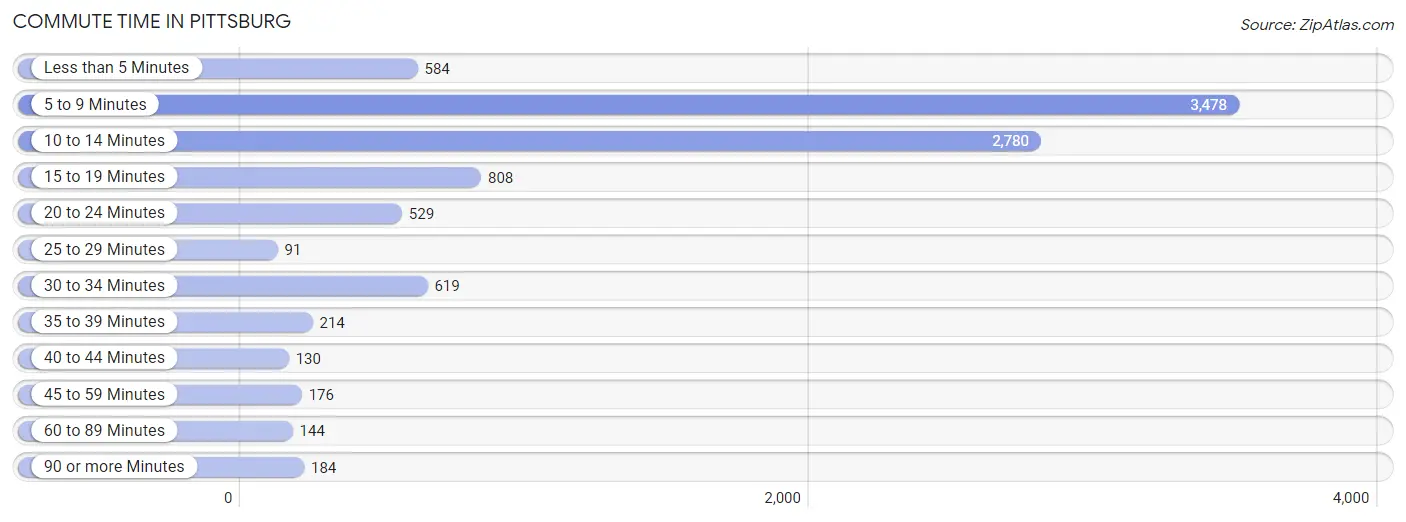
| Commute Time | # Commuters | % Commuters |
| Less than 5 Minutes | 584 | 6.0% |
| 5 to 9 Minutes | 3,478 | 35.7% |
| 10 to 14 Minutes | 2,780 | 28.5% |
| 15 to 19 Minutes | 808 | 8.3% |
| 20 to 24 Minutes | 529 | 5.4% |
| 25 to 29 Minutes | 91 | 0.9% |
| 30 to 34 Minutes | 619 | 6.4% |
| 35 to 39 Minutes | 214 | 2.2% |
| 40 to 44 Minutes | 130 | 1.3% |
| 45 to 59 Minutes | 176 | 1.8% |
| 60 to 89 Minutes | 144 | 1.5% |
| 90 or more Minutes | 184 | 1.9% |
Commute Time by Sex in Pittsburg
The most common commute times in Pittsburg are 5 to 9 minutes (1,910 commuters, 36.1%) for males and 5 to 9 minutes (1,568 commuters, 35.3%) for females.
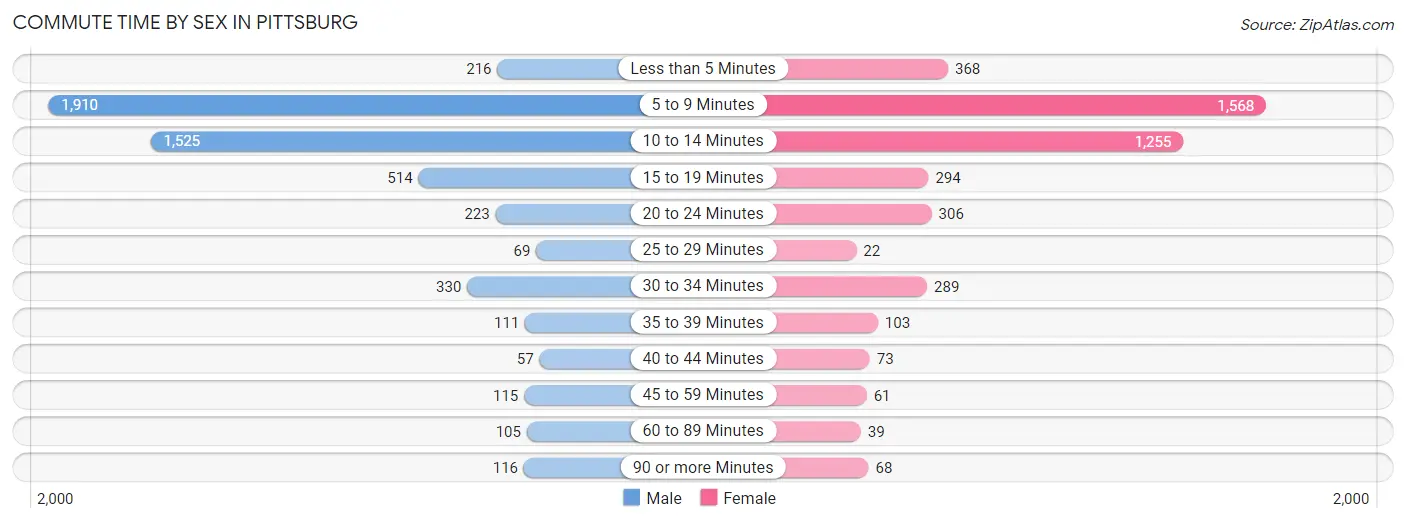
| Commute Time | Male | Female |
| Less than 5 Minutes | 216 (4.1%) | 368 (8.3%) |
| 5 to 9 Minutes | 1,910 (36.1%) | 1,568 (35.3%) |
| 10 to 14 Minutes | 1,525 (28.8%) | 1,255 (28.2%) |
| 15 to 19 Minutes | 514 (9.7%) | 294 (6.6%) |
| 20 to 24 Minutes | 223 (4.2%) | 306 (6.9%) |
| 25 to 29 Minutes | 69 (1.3%) | 22 (0.5%) |
| 30 to 34 Minutes | 330 (6.2%) | 289 (6.5%) |
| 35 to 39 Minutes | 111 (2.1%) | 103 (2.3%) |
| 40 to 44 Minutes | 57 (1.1%) | 73 (1.6%) |
| 45 to 59 Minutes | 115 (2.2%) | 61 (1.4%) |
| 60 to 89 Minutes | 105 (2.0%) | 39 (0.9%) |
| 90 or more Minutes | 116 (2.2%) | 68 (1.5%) |
Time of Departure to Work by Sex in Pittsburg
The most frequent times of departure to work in Pittsburg are 7:30 AM to 7:59 AM (1,199, 22.7%) for males and 7:30 AM to 7:59 AM (1,187, 26.7%) for females.
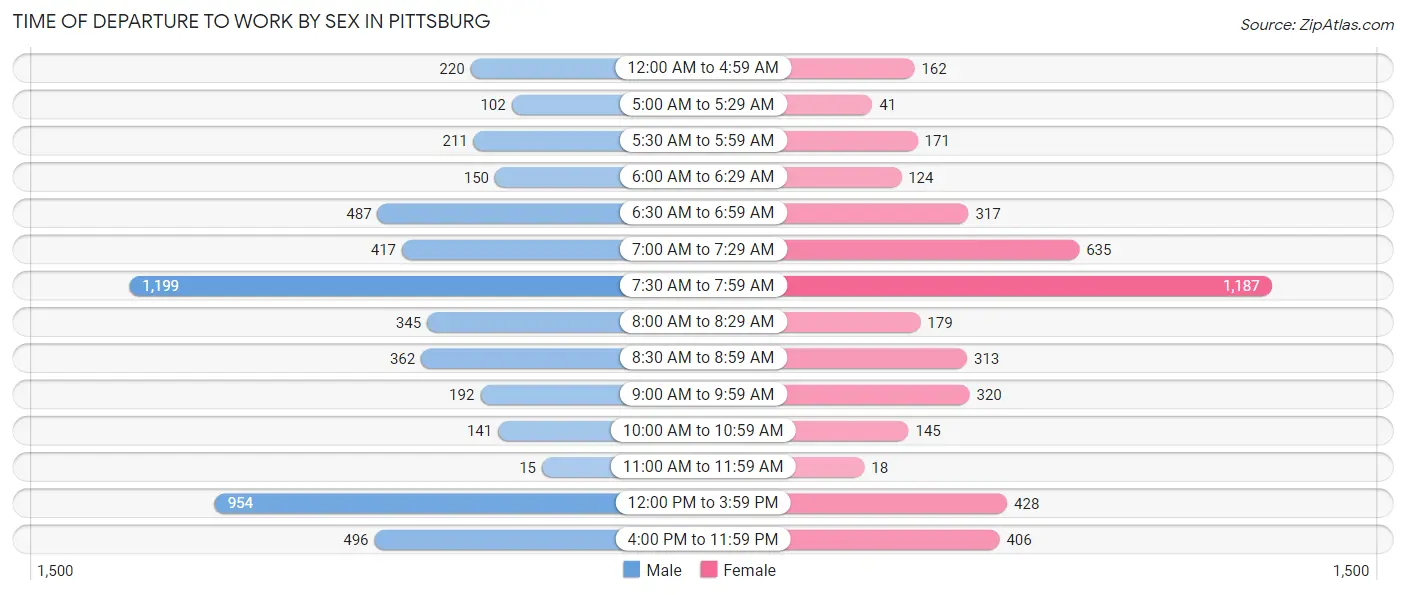
| Time of Departure | Male | Female |
| 12:00 AM to 4:59 AM | 220 (4.2%) | 162 (3.6%) |
| 5:00 AM to 5:29 AM | 102 (1.9%) | 41 (0.9%) |
| 5:30 AM to 5:59 AM | 211 (4.0%) | 171 (3.8%) |
| 6:00 AM to 6:29 AM | 150 (2.8%) | 124 (2.8%) |
| 6:30 AM to 6:59 AM | 487 (9.2%) | 317 (7.1%) |
| 7:00 AM to 7:29 AM | 417 (7.9%) | 635 (14.3%) |
| 7:30 AM to 7:59 AM | 1,199 (22.7%) | 1,187 (26.7%) |
| 8:00 AM to 8:29 AM | 345 (6.5%) | 179 (4.0%) |
| 8:30 AM to 8:59 AM | 362 (6.8%) | 313 (7.0%) |
| 9:00 AM to 9:59 AM | 192 (3.6%) | 320 (7.2%) |
| 10:00 AM to 10:59 AM | 141 (2.7%) | 145 (3.3%) |
| 11:00 AM to 11:59 AM | 15 (0.3%) | 18 (0.4%) |
| 12:00 PM to 3:59 PM | 954 (18.0%) | 428 (9.6%) |
| 4:00 PM to 11:59 PM | 496 (9.4%) | 406 (9.1%) |
| Total | 5,291 (100.0%) | 4,446 (100.0%) |
Housing Occupancy in Pittsburg
Occupancy by Ownership in Pittsburg
Of the total 8,305 dwellings in Pittsburg, owner-occupied units account for 3,695 (44.5%), while renter-occupied units make up 4,610 (55.5%).
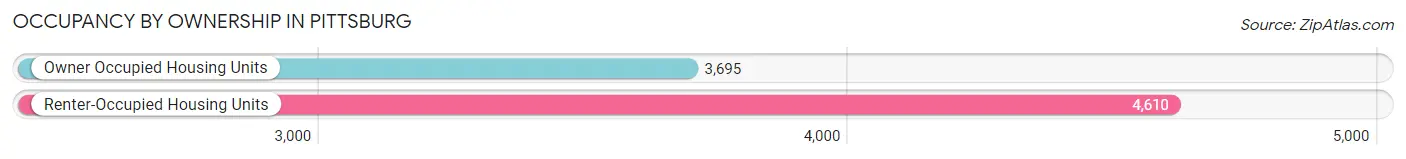
| Occupancy | # Housing Units | % Housing Units |
| Owner Occupied Housing Units | 3,695 | 44.5% |
| Renter-Occupied Housing Units | 4,610 | 55.5% |
| Total Occupied Housing Units | 8,305 | 100.0% |
Occupancy by Household Size in Pittsburg
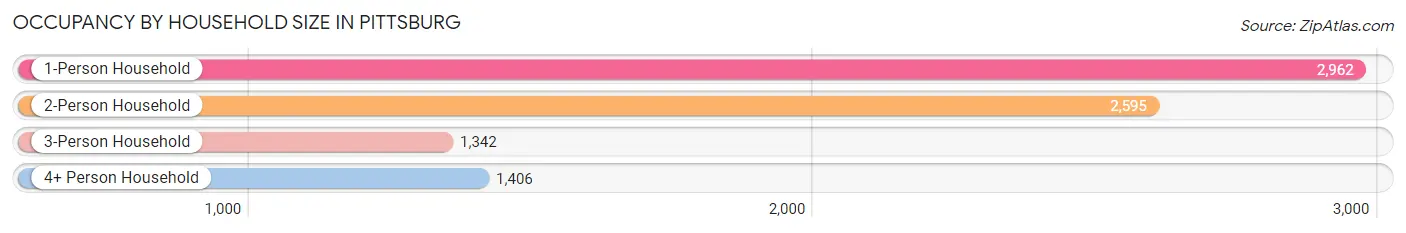
| Household Size | # Housing Units | % Housing Units |
| 1-Person Household | 2,962 | 35.7% |
| 2-Person Household | 2,595 | 31.2% |
| 3-Person Household | 1,342 | 16.2% |
| 4+ Person Household | 1,406 | 16.9% |
| Total Housing Units | 8,305 | 100.0% |
Occupancy by Ownership by Household Size in Pittsburg
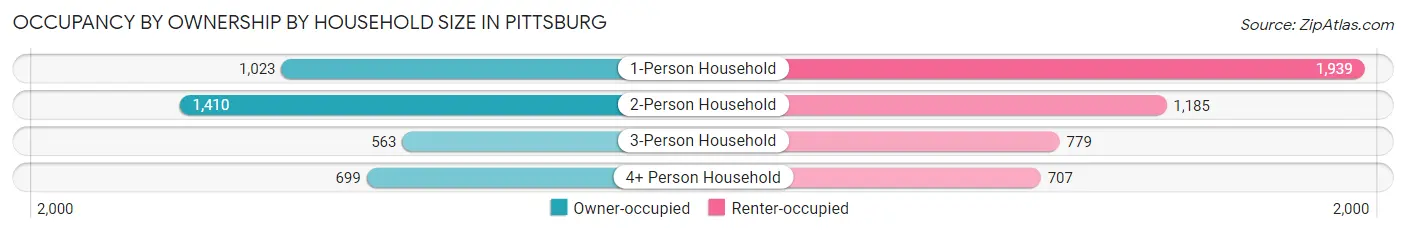
| Household Size | Owner-occupied | Renter-occupied |
| 1-Person Household | 1,023 (34.5%) | 1,939 (65.5%) |
| 2-Person Household | 1,410 (54.3%) | 1,185 (45.7%) |
| 3-Person Household | 563 (41.9%) | 779 (58.1%) |
| 4+ Person Household | 699 (49.7%) | 707 (50.3%) |
| Total Housing Units | 3,695 (44.5%) | 4,610 (55.5%) |
Occupancy by Educational Attainment in Pittsburg
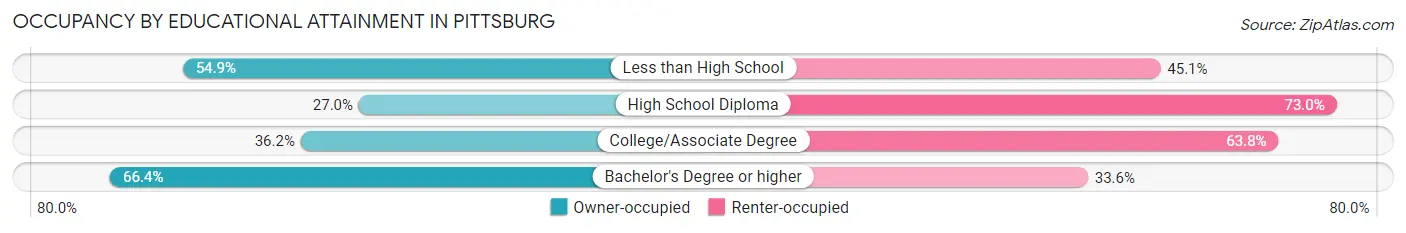
| Household Size | Owner-occupied | Renter-occupied |
| Less than High School | 279 (54.9%) | 229 (45.1%) |
| High School Diploma | 532 (27.0%) | 1,440 (73.0%) |
| College/Associate Degree | 1,180 (36.2%) | 2,080 (63.8%) |
| Bachelor's Degree or higher | 1,704 (66.4%) | 861 (33.6%) |
Occupancy by Age of Householder in Pittsburg
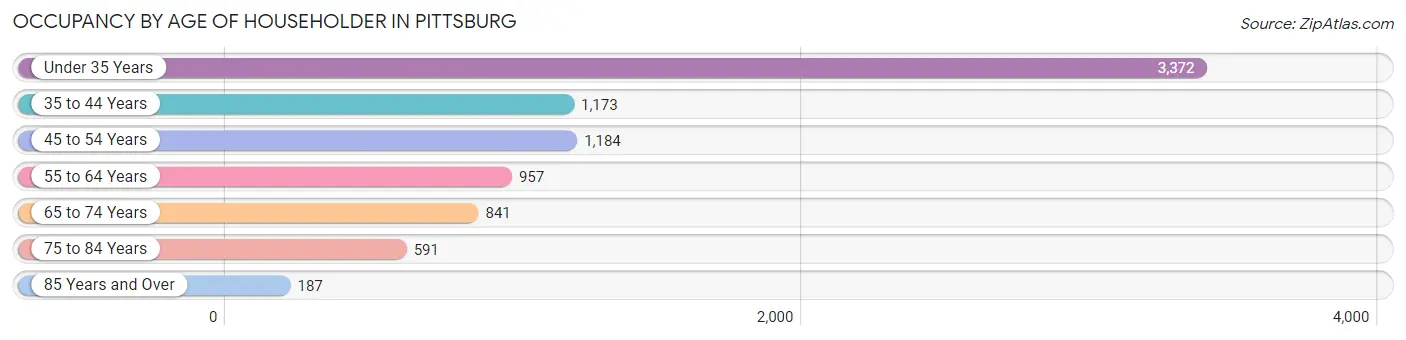
| Age Bracket | # Households | % Households |
| Under 35 Years | 3,372 | 40.6% |
| 35 to 44 Years | 1,173 | 14.1% |
| 45 to 54 Years | 1,184 | 14.3% |
| 55 to 64 Years | 957 | 11.5% |
| 65 to 74 Years | 841 | 10.1% |
| 75 to 84 Years | 591 | 7.1% |
| 85 Years and Over | 187 | 2.2% |
| Total | 8,305 | 100.0% |
Housing Finances in Pittsburg
Median Income by Occupancy in Pittsburg
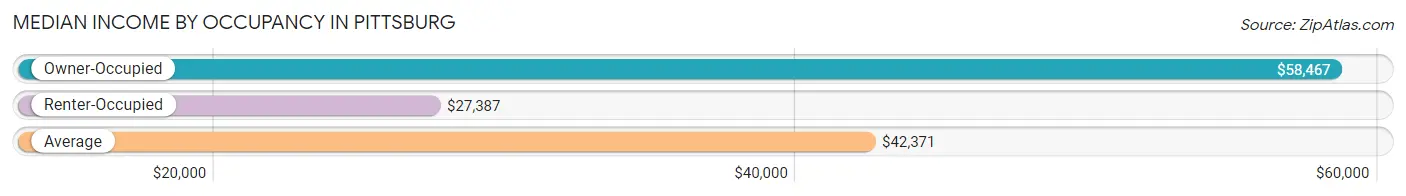
| Occupancy Type | # Households | Median Income |
| Owner-Occupied | 3,695 (44.5%) | $58,467 |
| Renter-Occupied | 4,610 (55.5%) | $27,387 |
| Average | 8,305 (100.0%) | $42,371 |
Occupancy by Householder Income Bracket in Pittsburg
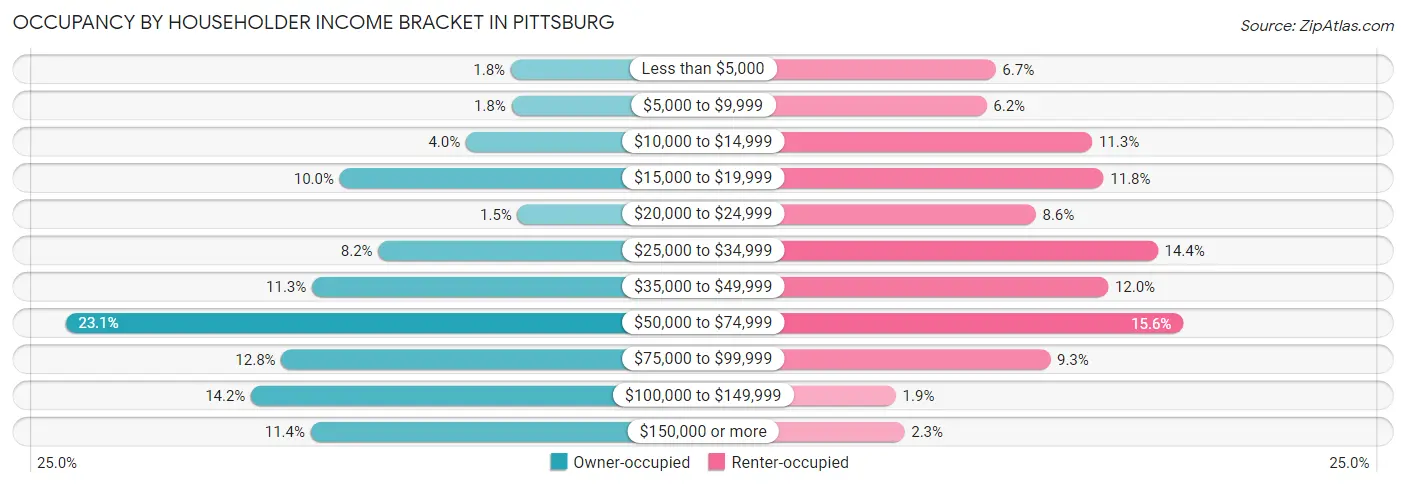
| Income Bracket | Owner-occupied | Renter-occupied |
| Less than $5,000 | 68 (1.8%) | 307 (6.7%) |
| $5,000 to $9,999 | 67 (1.8%) | 287 (6.2%) |
| $10,000 to $14,999 | 147 (4.0%) | 519 (11.3%) |
| $15,000 to $19,999 | 369 (10.0%) | 544 (11.8%) |
| $20,000 to $24,999 | 56 (1.5%) | 395 (8.6%) |
| $25,000 to $34,999 | 301 (8.2%) | 663 (14.4%) |
| $35,000 to $49,999 | 418 (11.3%) | 554 (12.0%) |
| $50,000 to $74,999 | 852 (23.1%) | 719 (15.6%) |
| $75,000 to $99,999 | 472 (12.8%) | 427 (9.3%) |
| $100,000 to $149,999 | 525 (14.2%) | 88 (1.9%) |
| $150,000 or more | 420 (11.4%) | 107 (2.3%) |
| Total | 3,695 (100.0%) | 4,610 (100.0%) |
Monthly Housing Cost Tiers in Pittsburg
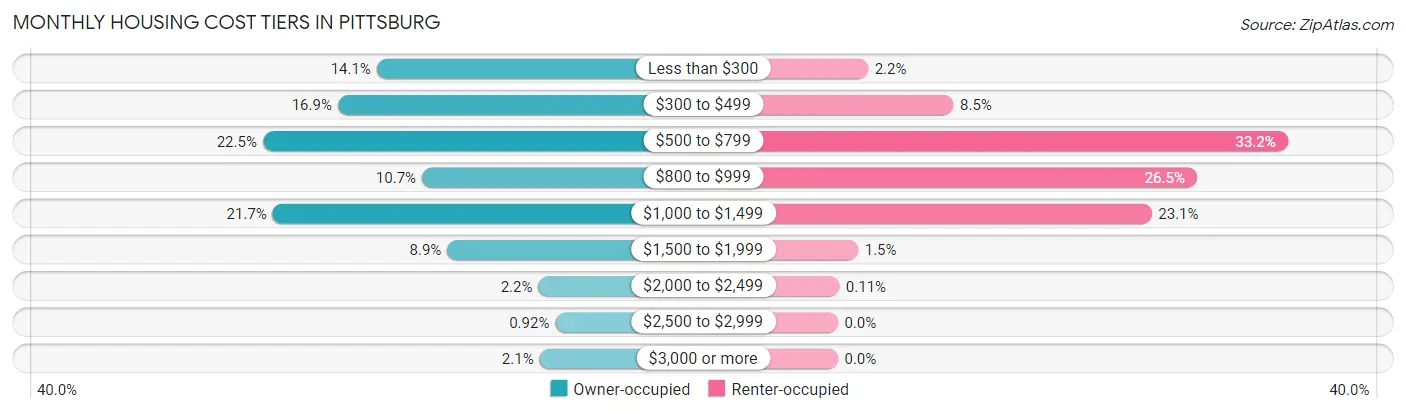
| Monthly Cost | Owner-occupied | Renter-occupied |
| Less than $300 | 520 (14.1%) | 103 (2.2%) |
| $300 to $499 | 626 (16.9%) | 393 (8.5%) |
| $500 to $799 | 830 (22.5%) | 1,528 (33.2%) |
| $800 to $999 | 397 (10.7%) | 1,220 (26.5%) |
| $1,000 to $1,499 | 803 (21.7%) | 1,066 (23.1%) |
| $1,500 to $1,999 | 328 (8.9%) | 69 (1.5%) |
| $2,000 to $2,499 | 80 (2.2%) | 5 (0.1%) |
| $2,500 to $2,999 | 34 (0.9%) | 0 (0.0%) |
| $3,000 or more | 77 (2.1%) | 0 (0.0%) |
| Total | 3,695 (100.0%) | 4,610 (100.0%) |
Physical Housing Characteristics in Pittsburg
Housing Structures in Pittsburg
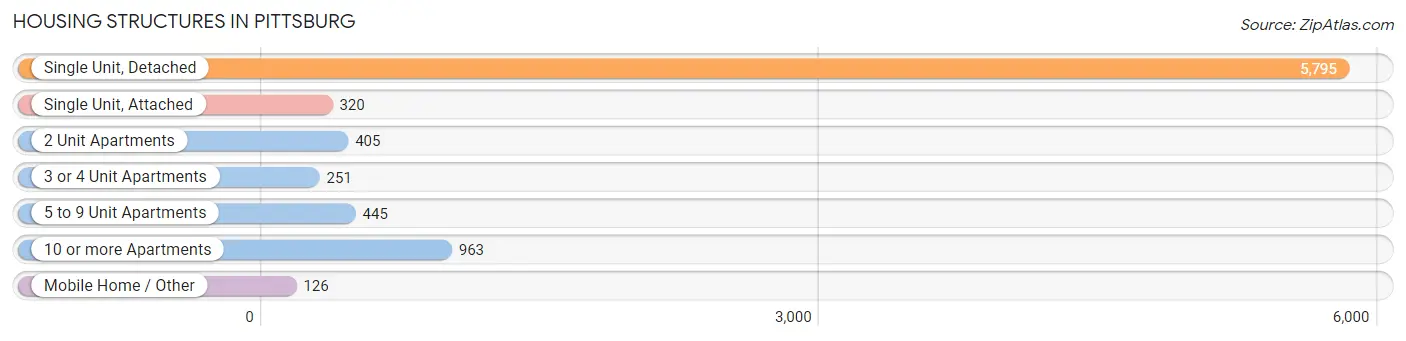
| Structure Type | # Housing Units | % Housing Units |
| Single Unit, Detached | 5,795 | 69.8% |
| Single Unit, Attached | 320 | 3.8% |
| 2 Unit Apartments | 405 | 4.9% |
| 3 or 4 Unit Apartments | 251 | 3.0% |
| 5 to 9 Unit Apartments | 445 | 5.4% |
| 10 or more Apartments | 963 | 11.6% |
| Mobile Home / Other | 126 | 1.5% |
| Total | 8,305 | 100.0% |
Housing Structures by Occupancy in Pittsburg
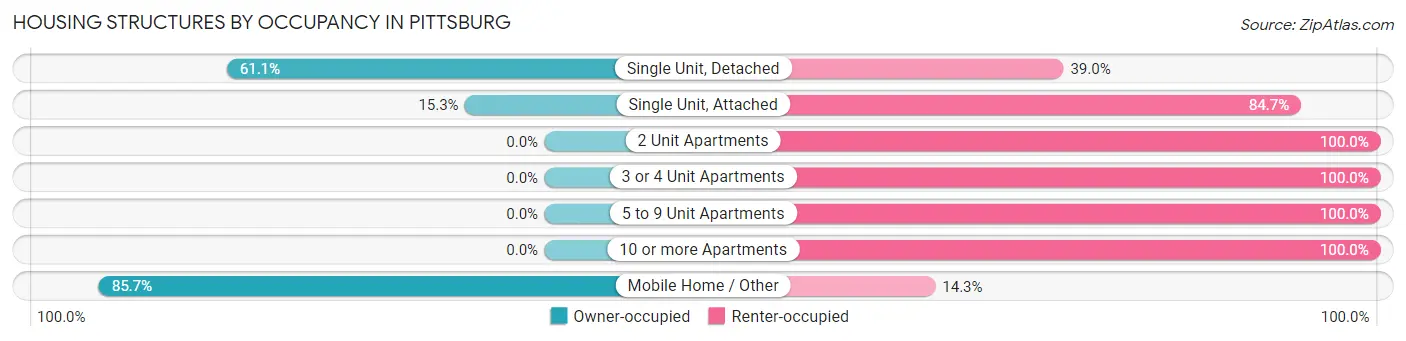
| Structure Type | Owner-occupied | Renter-occupied |
| Single Unit, Detached | 3,538 (61.1%) | 2,257 (39.0%) |
| Single Unit, Attached | 49 (15.3%) | 271 (84.7%) |
| 2 Unit Apartments | 0 (0.0%) | 405 (100.0%) |
| 3 or 4 Unit Apartments | 0 (0.0%) | 251 (100.0%) |
| 5 to 9 Unit Apartments | 0 (0.0%) | 445 (100.0%) |
| 10 or more Apartments | 0 (0.0%) | 963 (100.0%) |
| Mobile Home / Other | 108 (85.7%) | 18 (14.3%) |
| Total | 3,695 (44.5%) | 4,610 (55.5%) |
Housing Structures by Number of Rooms in Pittsburg
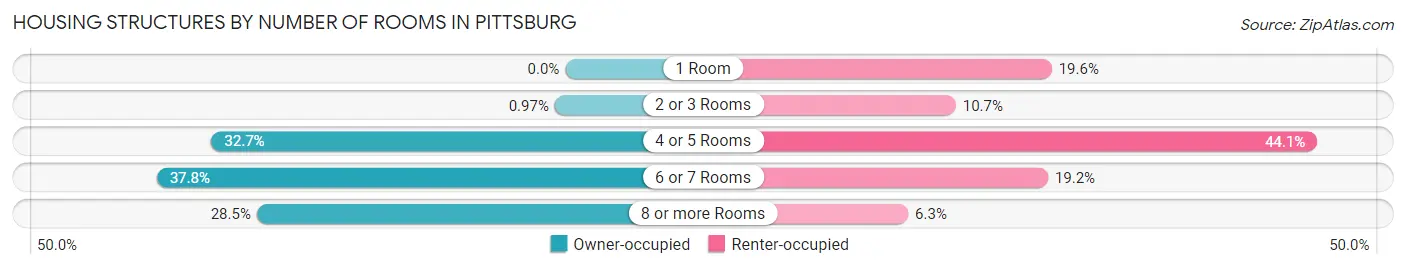
| Number of Rooms | Owner-occupied | Renter-occupied |
| 1 Room | 0 (0.0%) | 903 (19.6%) |
| 2 or 3 Rooms | 36 (1.0%) | 494 (10.7%) |
| 4 or 5 Rooms | 1,209 (32.7%) | 2,035 (44.1%) |
| 6 or 7 Rooms | 1,396 (37.8%) | 887 (19.2%) |
| 8 or more Rooms | 1,054 (28.5%) | 291 (6.3%) |
| Total | 3,695 (100.0%) | 4,610 (100.0%) |
Housing Structure by Heating Type in Pittsburg
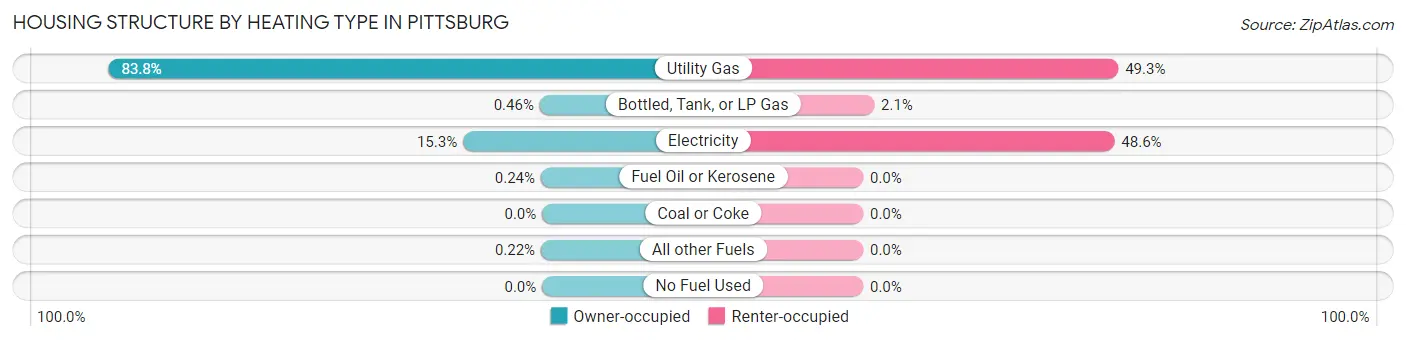
| Heating Type | Owner-occupied | Renter-occupied |
| Utility Gas | 3,096 (83.8%) | 2,273 (49.3%) |
| Bottled, Tank, or LP Gas | 17 (0.5%) | 98 (2.1%) |
| Electricity | 565 (15.3%) | 2,239 (48.6%) |
| Fuel Oil or Kerosene | 9 (0.2%) | 0 (0.0%) |
| Coal or Coke | 0 (0.0%) | 0 (0.0%) |
| All other Fuels | 8 (0.2%) | 0 (0.0%) |
| No Fuel Used | 0 (0.0%) | 0 (0.0%) |
| Total | 3,695 (100.0%) | 4,610 (100.0%) |
Household Vehicle Usage in Pittsburg
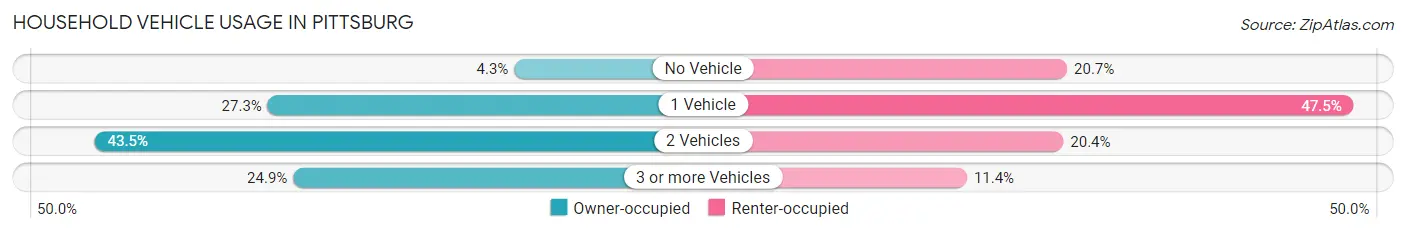
| Vehicles per Household | Owner-occupied | Renter-occupied |
| No Vehicle | 159 (4.3%) | 956 (20.7%) |
| 1 Vehicle | 1,009 (27.3%) | 2,189 (47.5%) |
| 2 Vehicles | 1,606 (43.5%) | 940 (20.4%) |
| 3 or more Vehicles | 921 (24.9%) | 525 (11.4%) |
| Total | 3,695 (100.0%) | 4,610 (100.0%) |
Real Estate & Mortgages in Pittsburg
Real Estate and Mortgage Overview in Pittsburg
| Characteristic | Without Mortgage | With Mortgage |
| Housing Units | 1,711 | 1,984 |
| Median Property Value | $79,600 | $114,900 |
| Median Household Income | $50,557 | $310 |
| Monthly Housing Costs | $434 | $77 |
| Real Estate Taxes | $1,102 | $115 |
Property Value by Mortgage Status in Pittsburg
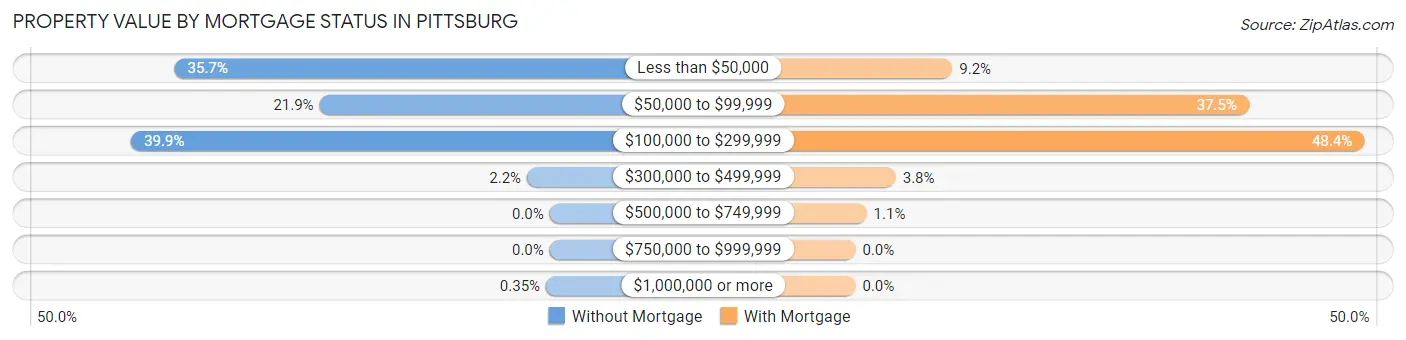
| Property Value | Without Mortgage | With Mortgage |
| Less than $50,000 | 611 (35.7%) | 183 (9.2%) |
| $50,000 to $99,999 | 375 (21.9%) | 743 (37.4%) |
| $100,000 to $299,999 | 682 (39.9%) | 961 (48.4%) |
| $300,000 to $499,999 | 37 (2.2%) | 76 (3.8%) |
| $500,000 to $749,999 | 0 (0.0%) | 21 (1.1%) |
| $750,000 to $999,999 | 0 (0.0%) | 0 (0.0%) |
| $1,000,000 or more | 6 (0.4%) | 0 (0.0%) |
| Total | 1,711 (100.0%) | 1,984 (100.0%) |
Household Income by Mortgage Status in Pittsburg
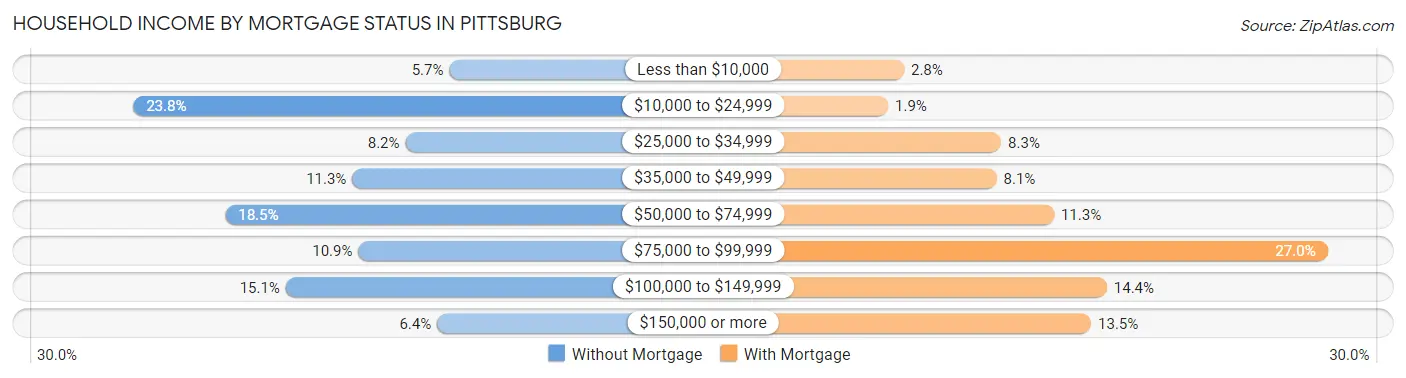
| Household Income | Without Mortgage | With Mortgage |
| Less than $10,000 | 98 (5.7%) | 55 (2.8%) |
| $10,000 to $24,999 | 407 (23.8%) | 37 (1.9%) |
| $25,000 to $34,999 | 141 (8.2%) | 165 (8.3%) |
| $35,000 to $49,999 | 193 (11.3%) | 160 (8.1%) |
| $50,000 to $74,999 | 317 (18.5%) | 225 (11.3%) |
| $75,000 to $99,999 | 187 (10.9%) | 535 (27.0%) |
| $100,000 to $149,999 | 258 (15.1%) | 285 (14.4%) |
| $150,000 or more | 110 (6.4%) | 267 (13.5%) |
| Total | 1,711 (100.0%) | 1,984 (100.0%) |
Property Value to Household Income Ratio in Pittsburg
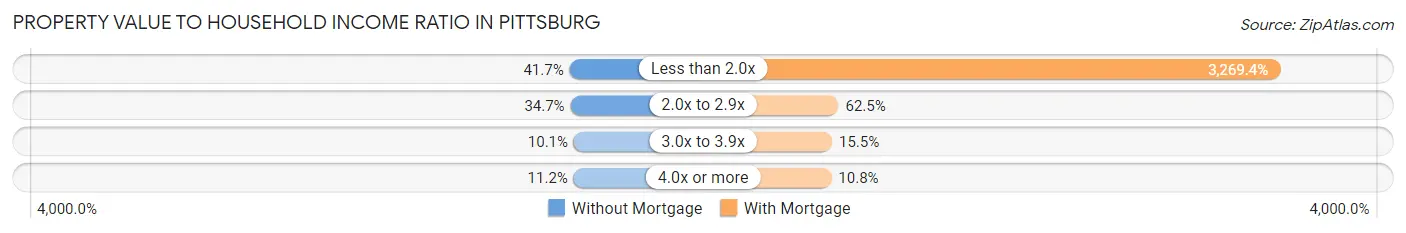
| Value-to-Income Ratio | Without Mortgage | With Mortgage |
| Less than 2.0x | 713 (41.7%) | 64,864 (3,269.4%) |
| 2.0x to 2.9x | 593 (34.7%) | 1,240 (62.5%) |
| 3.0x to 3.9x | 172 (10.1%) | 307 (15.5%) |
| 4.0x or more | 192 (11.2%) | 214 (10.8%) |
| Total | 1,711 (100.0%) | 1,984 (100.0%) |
Real Estate Taxes by Mortgage Status in Pittsburg
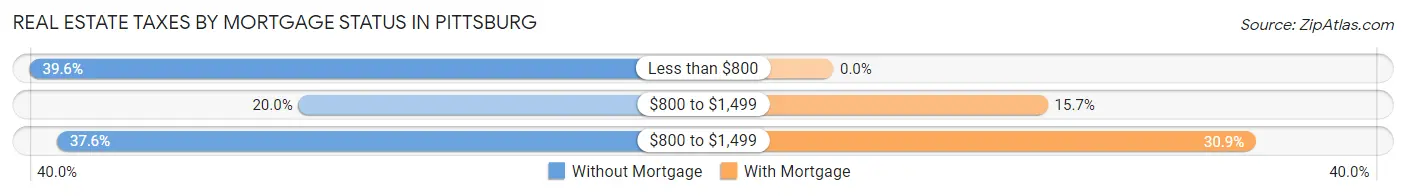
| Property Taxes | Without Mortgage | With Mortgage |
| Less than $800 | 678 (39.6%) | 0 (0.0%) |
| $800 to $1,499 | 342 (20.0%) | 311 (15.7%) |
| $800 to $1,499 | 644 (37.6%) | 613 (30.9%) |
| Total | 1,711 (100.0%) | 1,984 (100.0%) |
Health & Disability in Pittsburg
Health Insurance Coverage by Age in Pittsburg
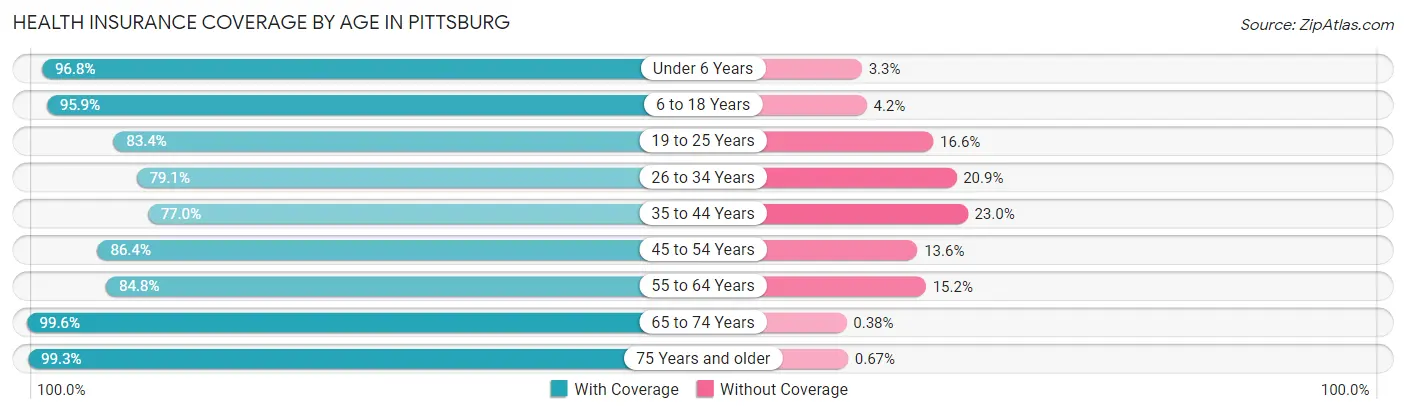
| Age Bracket | With Coverage | Without Coverage |
| Under 6 Years | 1,429 (96.8%) | 48 (3.3%) |
| 6 to 18 Years | 3,668 (95.9%) | 159 (4.2%) |
| 19 to 25 Years | 4,259 (83.4%) | 846 (16.6%) |
| 26 to 34 Years | 1,865 (79.1%) | 492 (20.9%) |
| 35 to 44 Years | 1,402 (77.0%) | 418 (23.0%) |
| 45 to 54 Years | 1,575 (86.4%) | 248 (13.6%) |
| 55 to 64 Years | 1,340 (84.8%) | 240 (15.2%) |
| 65 to 74 Years | 1,305 (99.6%) | 5 (0.4%) |
| 75 Years and older | 1,044 (99.3%) | 7 (0.7%) |
| Total | 17,887 (87.9%) | 2,463 (12.1%) |
Health Insurance Coverage by Citizenship Status in Pittsburg
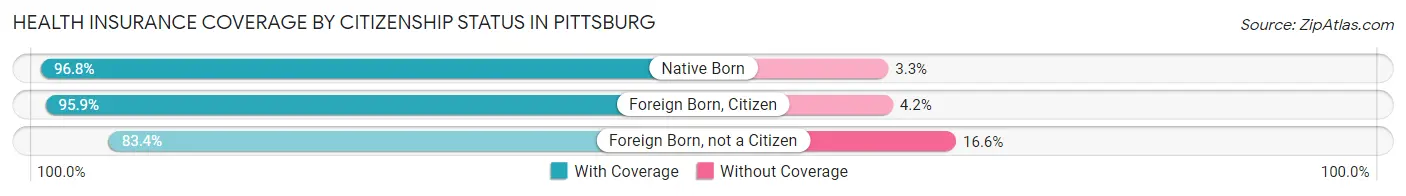
| Citizenship Status | With Coverage | Without Coverage |
| Native Born | 1,429 (96.8%) | 48 (3.3%) |
| Foreign Born, Citizen | 3,668 (95.9%) | 159 (4.2%) |
| Foreign Born, not a Citizen | 4,259 (83.4%) | 846 (16.6%) |
Health Insurance Coverage by Household Income in Pittsburg
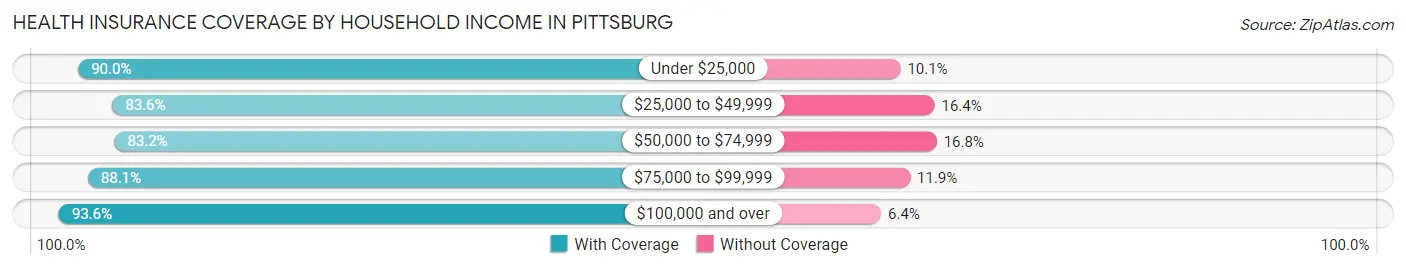
| Household Income | With Coverage | Without Coverage |
| Under $25,000 | 4,581 (89.9%) | 512 (10.1%) |
| $25,000 to $49,999 | 3,569 (83.6%) | 702 (16.4%) |
| $50,000 to $74,999 | 3,037 (83.2%) | 615 (16.8%) |
| $75,000 to $99,999 | 2,170 (88.1%) | 292 (11.9%) |
| $100,000 and over | 3,267 (93.6%) | 224 (6.4%) |
Public vs Private Health Insurance Coverage by Age in Pittsburg
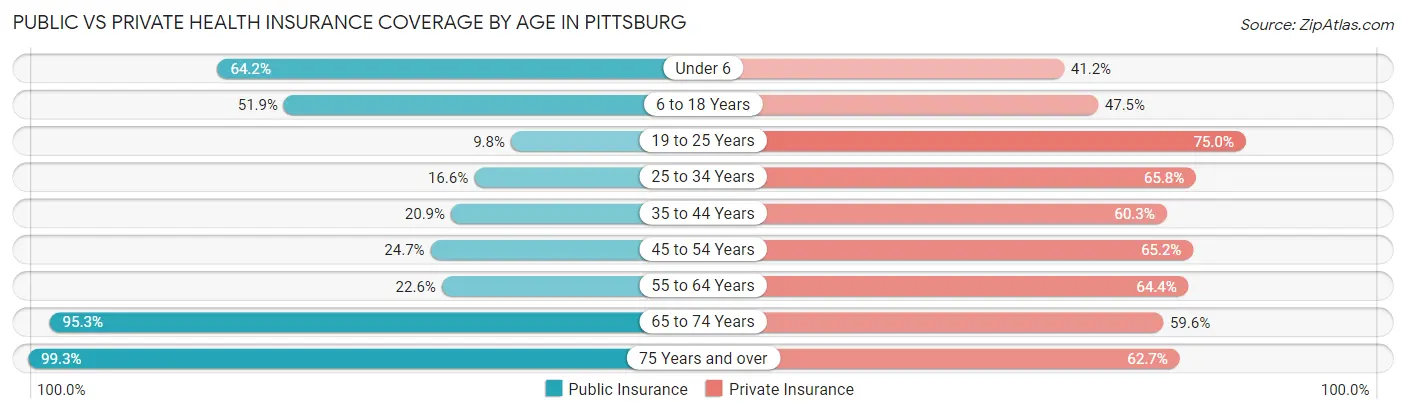
| Age Bracket | Public Insurance | Private Insurance |
| Under 6 | 948 (64.2%) | 609 (41.2%) |
| 6 to 18 Years | 1,986 (51.9%) | 1,819 (47.5%) |
| 19 to 25 Years | 498 (9.8%) | 3,827 (75.0%) |
| 25 to 34 Years | 391 (16.6%) | 1,550 (65.8%) |
| 35 to 44 Years | 380 (20.9%) | 1,097 (60.3%) |
| 45 to 54 Years | 450 (24.7%) | 1,189 (65.2%) |
| 55 to 64 Years | 357 (22.6%) | 1,017 (64.4%) |
| 65 to 74 Years | 1,249 (95.3%) | 781 (59.6%) |
| 75 Years and over | 1,044 (99.3%) | 659 (62.7%) |
| Total | 7,303 (35.9%) | 12,548 (61.7%) |
Disability Status by Sex by Age in Pittsburg
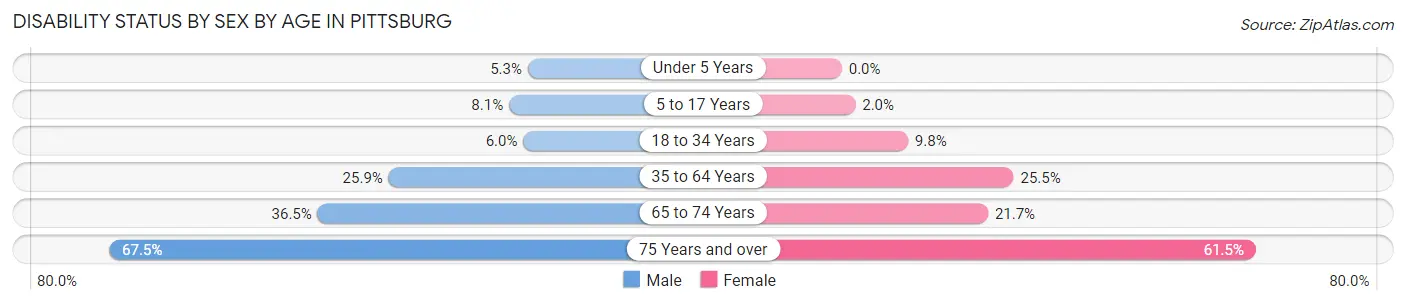
| Age Bracket | Male | Female |
| Under 5 Years | 40 (5.3%) | 0 (0.0%) |
| 5 to 17 Years | 143 (8.1%) | 31 (2.0%) |
| 18 to 34 Years | 269 (5.9%) | 356 (9.8%) |
| 35 to 64 Years | 701 (25.9%) | 643 (25.5%) |
| 65 to 74 Years | 177 (36.5%) | 179 (21.7%) |
| 75 Years and over | 259 (67.4%) | 410 (61.5%) |
Disability Class by Sex by Age in Pittsburg
Disability Class: Hearing Difficulty
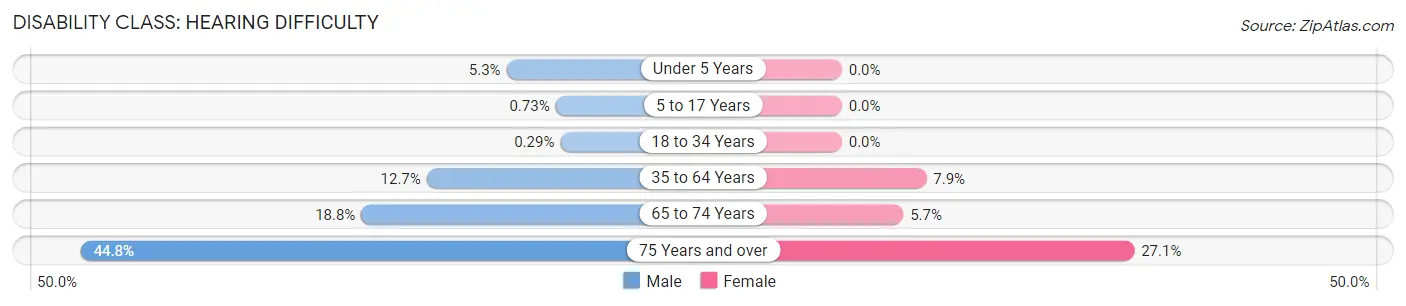
| Age Bracket | Male | Female |
| Under 5 Years | 40 (5.3%) | 0 (0.0%) |
| 5 to 17 Years | 13 (0.7%) | 0 (0.0%) |
| 18 to 34 Years | 13 (0.3%) | 0 (0.0%) |
| 35 to 64 Years | 343 (12.7%) | 198 (7.9%) |
| 65 to 74 Years | 91 (18.8%) | 47 (5.7%) |
| 75 Years and over | 172 (44.8%) | 181 (27.1%) |
Disability Class: Vision Difficulty
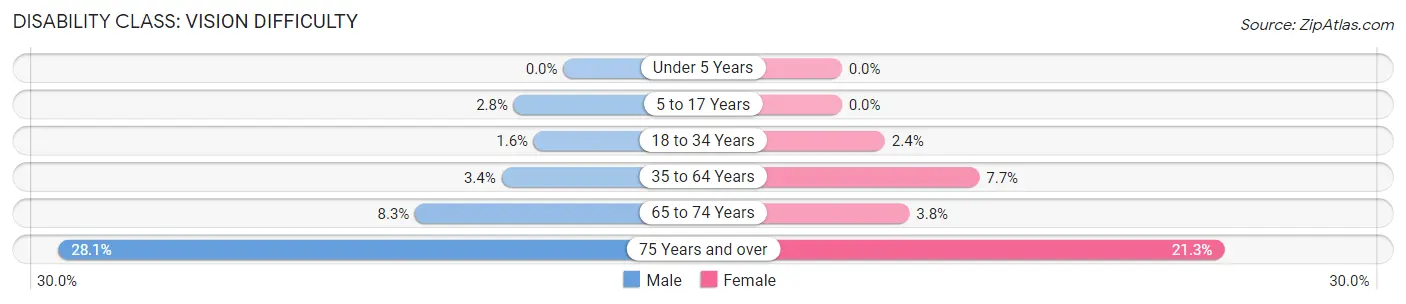
| Age Bracket | Male | Female |
| Under 5 Years | 0 (0.0%) | 0 (0.0%) |
| 5 to 17 Years | 49 (2.8%) | 0 (0.0%) |
| 18 to 34 Years | 74 (1.6%) | 87 (2.4%) |
| 35 to 64 Years | 93 (3.4%) | 193 (7.7%) |
| 65 to 74 Years | 40 (8.3%) | 31 (3.8%) |
| 75 Years and over | 108 (28.1%) | 142 (21.3%) |
Disability Class: Cognitive Difficulty
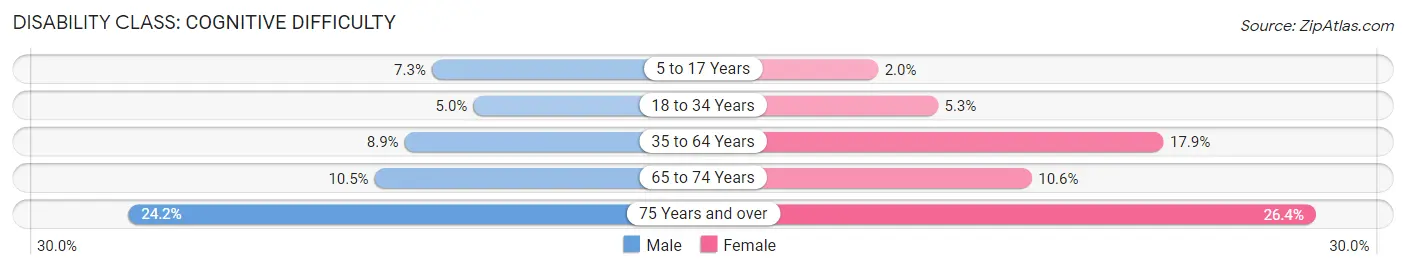
| Age Bracket | Male | Female |
| 5 to 17 Years | 130 (7.3%) | 31 (2.0%) |
| 18 to 34 Years | 227 (5.0%) | 193 (5.3%) |
| 35 to 64 Years | 239 (8.8%) | 451 (17.9%) |
| 65 to 74 Years | 51 (10.5%) | 87 (10.5%) |
| 75 Years and over | 93 (24.2%) | 176 (26.4%) |
Disability Class: Ambulatory Difficulty
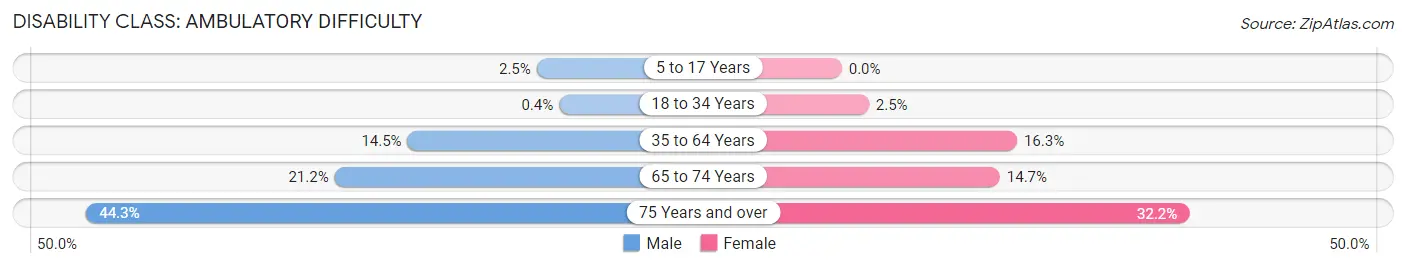
| Age Bracket | Male | Female |
| 5 to 17 Years | 44 (2.5%) | 0 (0.0%) |
| 18 to 34 Years | 18 (0.4%) | 91 (2.5%) |
| 35 to 64 Years | 391 (14.5%) | 410 (16.3%) |
| 65 to 74 Years | 103 (21.2%) | 121 (14.7%) |
| 75 Years and over | 170 (44.3%) | 215 (32.2%) |
Disability Class: Self-Care Difficulty
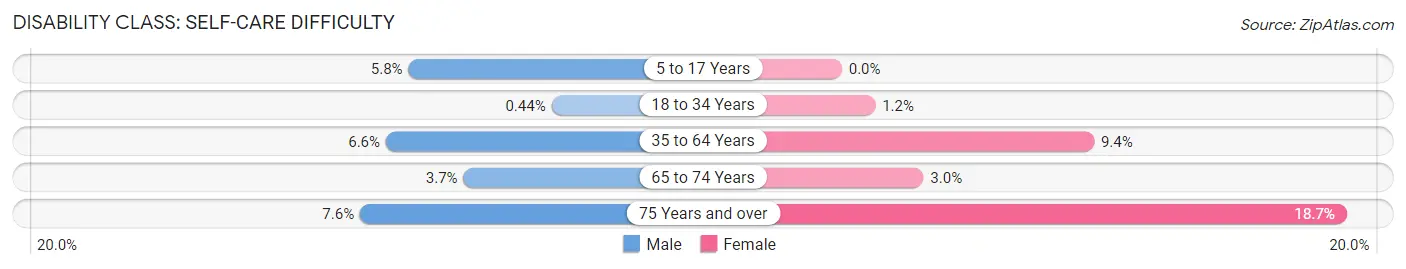
| Age Bracket | Male | Female |
| 5 to 17 Years | 102 (5.8%) | 0 (0.0%) |
| 18 to 34 Years | 20 (0.4%) | 45 (1.2%) |
| 35 to 64 Years | 178 (6.6%) | 236 (9.4%) |
| 65 to 74 Years | 18 (3.7%) | 25 (3.0%) |
| 75 Years and over | 29 (7.5%) | 125 (18.7%) |
Technology Access in Pittsburg
Computing Device Access in Pittsburg
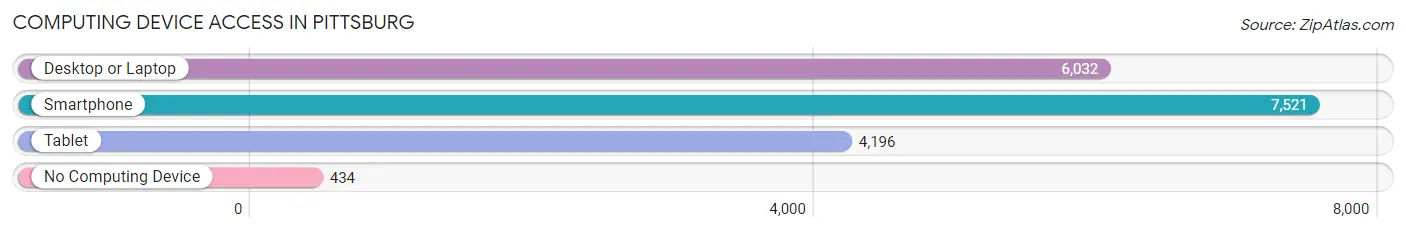
| Device Type | # Households | % Households |
| Desktop or Laptop | 6,032 | 72.6% |
| Smartphone | 7,521 | 90.6% |
| Tablet | 4,196 | 50.5% |
| No Computing Device | 434 | 5.2% |
| Total | 8,305 | 100.0% |
Internet Access in Pittsburg
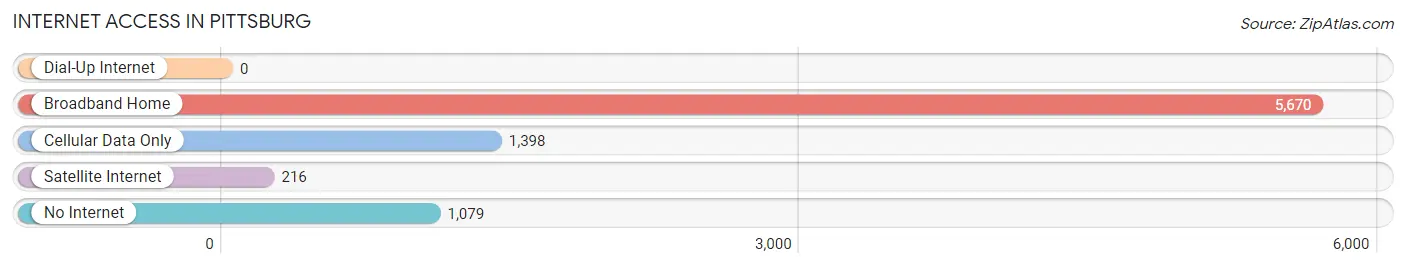
| Internet Type | # Households | % Households |
| Dial-Up Internet | 0 | 0.0% |
| Broadband Home | 5,670 | 68.3% |
| Cellular Data Only | 1,398 | 16.8% |
| Satellite Internet | 216 | 2.6% |
| No Internet | 1,079 | 13.0% |
| Total | 8,305 | 100.0% |
Pittsburg Summary
Pittsburg, Kansas is a city located in the southeast corner of the state, in Crawford County. It is the county seat and the most populous city in the county. The city is situated on the western edge of the Ozark Plateau, and is surrounded by rolling hills and wooded areas. The city is located approximately 90 miles south of Kansas City, and is part of the Joplin, Missouri metropolitan area.
History
The area that is now Pittsburg was first settled in the early 1800s by Native Americans, primarily the Osage and Cherokee tribes. The first white settlers arrived in the area in the 1840s, and the town was officially founded in 1876. The city was named after Pittsburgh, Pennsylvania, and was incorporated in 1879.
In the late 1800s, Pittsburg was a major coal mining center, and the city was home to several large coal mines. The city also had a thriving railroad industry, and was a major hub for the Missouri Pacific Railroad.
In the early 1900s, Pittsburg experienced a period of rapid growth and development. The city was home to several large manufacturing plants, including a glass factory, a steel mill, and a brick factory. The city also had a thriving retail sector, and was home to several large department stores.
In the 1950s, Pittsburg experienced a period of decline as the coal industry declined and the railroad industry moved away from the city. The city's population declined, and the city's economy shifted to a more service-oriented economy.
Geography
Pittsburg is located in the southeast corner of Kansas, in Crawford County. The city is situated on the western edge of the Ozark Plateau, and is surrounded by rolling hills and wooded areas. The city is located approximately 90 miles south of Kansas City, and is part of the Joplin, Missouri metropolitan area.
The city has a total area of 8.3 square miles, of which 8.2 square miles is land and 0.1 square miles is water. The city is located at an elevation of 890 feet above sea level.
Economy
Pittsburg's economy is largely based on the service sector. The city is home to several large employers, including Pittsburg State University, the Pittsburg Community School District, and the Pittsburg Medical Center. The city also has a thriving retail sector, and is home to several large department stores.
The city is also home to several manufacturing plants, including a glass factory, a steel mill, and a brick factory. The city is also home to several coal mines, and is a major hub for the Missouri Pacific Railroad.
Demographics
As of the 2010 census, Pittsburg had a population of 20,233. The racial makeup of the city was 87.3% White, 5.7% African American, 0.7% Native American, 1.2% Asian, 0.1% Pacific Islander, 2.2% from other races, and 2.8% from two or more races. Hispanic or Latino of any race were 5.3% of the population.
The median household income in Pittsburg was $37,945, and the median family income was $45,945. The per capita income in the city was $19,945. About 14.3% of the population was below the poverty line.
Common Questions
What is Per Capita Income in Pittsburg?
Per Capita income in Pittsburg is $24,987.
What is the Median Family Income in Pittsburg?
Median Family Income in Pittsburg is $52,083.
What is the Median Household income in Pittsburg?
Median Household Income in Pittsburg is $42,371.
What is Income or Wage Gap in Pittsburg?
Income or Wage Gap in Pittsburg is 20.5%.
Women in Pittsburg earn 79.5 cents for every dollar earned by a man.
What is Family Income Deficit in Pittsburg?
Family Income Deficit in Pittsburg is $9,329.
Families that are below poverty line in Pittsburg earn $9,329 less on average than the poverty threshold level.
What is Inequality or Gini Index in Pittsburg?
Inequality or Gini Index in Pittsburg is 0.49.
What is the Total Population of Pittsburg?
Total Population of Pittsburg is 20,610.
What is the Total Male Population of Pittsburg?
Total Male Population of Pittsburg is 10,731.
What is the Total Female Population of Pittsburg?
Total Female Population of Pittsburg is 9,879.
What is the Ratio of Males per 100 Females in Pittsburg?
There are 108.62 Males per 100 Females in Pittsburg.
What is the Ratio of Females per 100 Males in Pittsburg?
There are 92.06 Females per 100 Males in Pittsburg.
What is the Median Population Age in Pittsburg?
Median Population Age in Pittsburg is 25.7 Years.
What is the Average Family Size in Pittsburg
Average Family Size in Pittsburg is 2.9 People.
What is the Average Household Size in Pittsburg
Average Household Size in Pittsburg is 2.3 People.
How Large is the Labor Force in Pittsburg?
There are 10,848 People in the Labor Forcein in Pittsburg.
What is the Percentage of People in the Labor Force in Pittsburg?
65.4% of People are in the Labor Force in Pittsburg.
What is the Unemployment Rate in Pittsburg?
Unemployment Rate in Pittsburg is 4.0%.