Peabody, KS Map & Demographics
Peabody Map
Peabody Overview
$21,043
PER CAPITA INCOME
$53,750
AVG FAMILY INCOME
$51,299
AVG HOUSEHOLD INCOME
4.5%
WAGE / INCOME GAP [ % ]
95.5¢/ $1
WAGE / INCOME GAP [ $ ]
$3,911
FAMILY INCOME DEFICIT
0.37
INEQUALITY / GINI INDEX
1,259
TOTAL POPULATION
599
MALE POPULATION
660
FEMALE POPULATION
90.76
MALES / 100 FEMALES
110.18
FEMALES / 100 MALES
42.9
MEDIAN AGE
3.5
AVG FAMILY SIZE
2.7
AVG HOUSEHOLD SIZE
541
LABOR FORCE [ PEOPLE ]
51.3%
PERCENT IN LABOR FORCE
12.2%
UNEMPLOYMENT RATE
Peabody Zip Codes
Peabody Area Codes
Income in Peabody
Income Overview in Peabody
Per Capita Income in Peabody is $21,043, while median incomes of families and households are $53,750 and $51,299 respectively.
| Characteristic | Number | Measure |
| Per Capita Income | 1,259 | $21,043 |
| Median Family Income | 253 | $53,750 |
| Mean Family Income | 253 | $67,233 |
| Median Household Income | 423 | $51,299 |
| Mean Household Income | 423 | $53,695 |
| Income Deficit | 253 | $3,911 |
| Wage / Income Gap (%) | 1,259 | 4.52% |
| Wage / Income Gap ($) | 1,259 | 95.48¢ per $1 |
| Gini / Inequality Index | 1,259 | 0.37 |
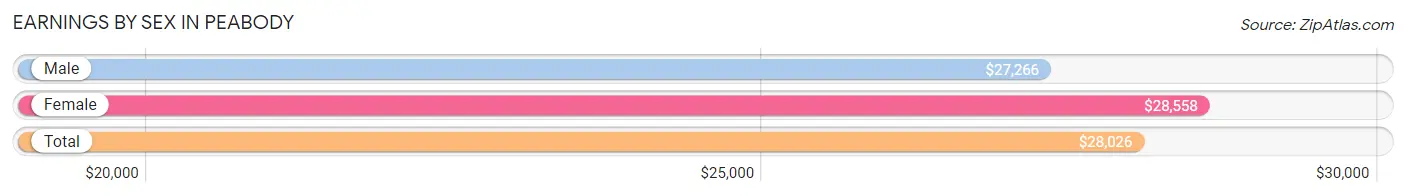
Earnings by Sex in Peabody
Average Earnings in Peabody are $28,026, $27,266 for men and $28,558 for women, a difference of 4.5%.
| Sex | Number | Average Earnings |
| Male | 281 (49.5%) | $27,266 |
| Female | 287 (50.5%) | $28,558 |
| Total | 568 (100.0%) | $28,026 |
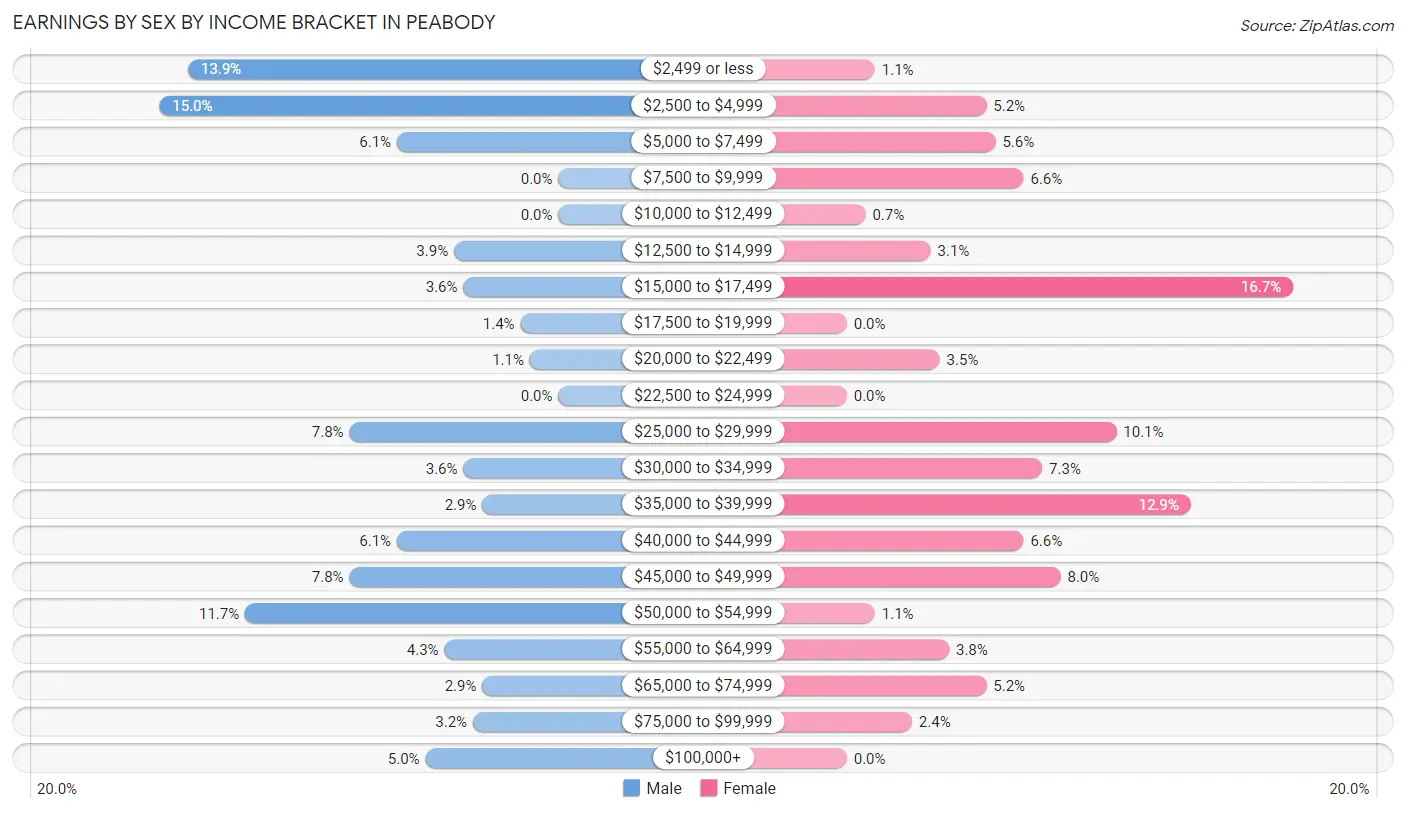
Earnings by Sex by Income Bracket in Peabody
The most common earnings brackets in Peabody are $2,500 to $4,999 for men (42 | 14.9%) and $15,000 to $17,499 for women (48 | 16.7%).
| Income | Male | Female |
| $2,499 or less | 39 (13.9%) | 3 (1.1%) |
| $2,500 to $4,999 | 42 (14.9%) | 15 (5.2%) |
| $5,000 to $7,499 | 17 (6.0%) | 16 (5.6%) |
| $7,500 to $9,999 | 0 (0.0%) | 19 (6.6%) |
| $10,000 to $12,499 | 0 (0.0%) | 2 (0.7%) |
| $12,500 to $14,999 | 11 (3.9%) | 9 (3.1%) |
| $15,000 to $17,499 | 10 (3.6%) | 48 (16.7%) |
| $17,500 to $19,999 | 4 (1.4%) | 0 (0.0%) |
| $20,000 to $22,499 | 3 (1.1%) | 10 (3.5%) |
| $22,500 to $24,999 | 0 (0.0%) | 0 (0.0%) |
| $25,000 to $29,999 | 22 (7.8%) | 29 (10.1%) |
| $30,000 to $34,999 | 10 (3.6%) | 21 (7.3%) |
| $35,000 to $39,999 | 8 (2.9%) | 37 (12.9%) |
| $40,000 to $44,999 | 17 (6.0%) | 19 (6.6%) |
| $45,000 to $49,999 | 22 (7.8%) | 23 (8.0%) |
| $50,000 to $54,999 | 33 (11.7%) | 3 (1.1%) |
| $55,000 to $64,999 | 12 (4.3%) | 11 (3.8%) |
| $65,000 to $74,999 | 8 (2.9%) | 15 (5.2%) |
| $75,000 to $99,999 | 9 (3.2%) | 7 (2.4%) |
| $100,000+ | 14 (5.0%) | 0 (0.0%) |
| Total | 281 (100.0%) | 287 (100.0%) |
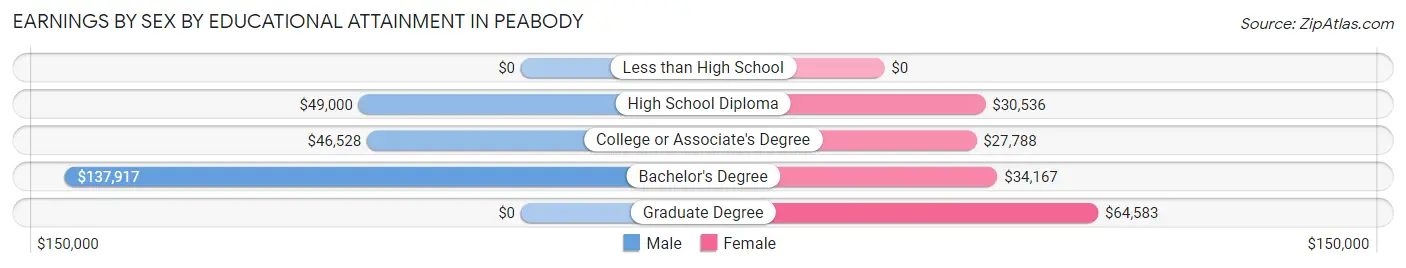
Earnings by Sex by Educational Attainment in Peabody
Average earnings in Peabody are $44,412 for men and $32,232 for women, a difference of 27.4%. Men with an educational attainment of bachelor's degree enjoy the highest average annual earnings of $137,917, while those with college or associate's degree education earn the least with $46,528. Women with an educational attainment of graduate degree earn the most with the average annual earnings of $64,583, while those with college or associate's degree education have the smallest earnings of $27,788.
| Educational Attainment | Male Income | Female Income |
| Less than High School | - | - |
| High School Diploma | $49,000 | $30,536 |
| College or Associate's Degree | $46,528 | $27,788 |
| Bachelor's Degree | $137,917 | $34,167 |
| Graduate Degree | - | - |
| Total | $44,412 | $32,232 |
Family Income in Peabody
Family Income Brackets in Peabody
According to the Peabody family income data, there are 84 families falling into the $50,000 to $74,999 income range, which is the most common income bracket and makes up 33.2% of all families.
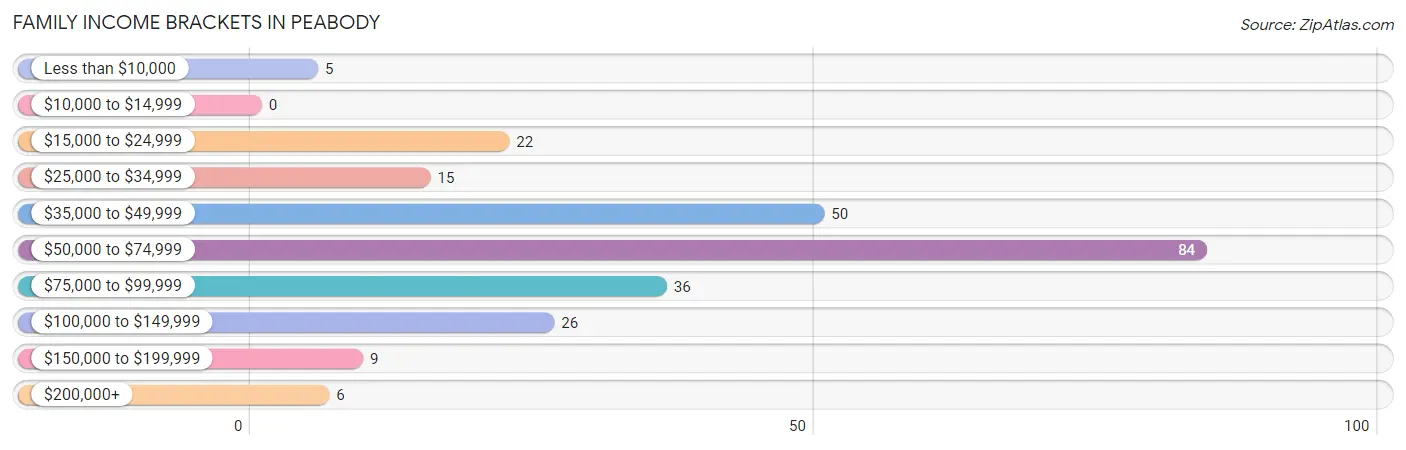
| Income Bracket | # Families | % Families |
| Less than $10,000 | 5 | 2.0% |
| $10,000 to $14,999 | 0 | 0.0% |
| $15,000 to $24,999 | 22 | 8.7% |
| $25,000 to $34,999 | 15 | 5.9% |
| $35,000 to $49,999 | 50 | 19.8% |
| $50,000 to $74,999 | 84 | 33.2% |
| $75,000 to $99,999 | 36 | 14.2% |
| $100,000 to $149,999 | 26 | 10.3% |
| $150,000 to $199,999 | 9 | 3.6% |
| $200,000+ | 6 | 2.4% |
Family Income by Famaliy Size in Peabody
5-person families (15 | 5.9%) account for the highest median family income in Peabody with $91,094 per family, while 2-person families (142 | 56.1%) have the highest median income of $27,116 per family member.
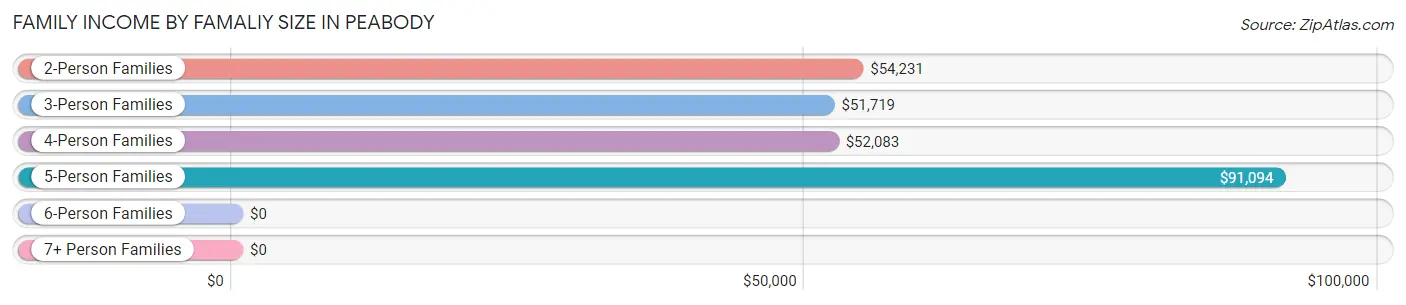
| Income Bracket | # Families | Median Income |
| 2-Person Families | 142 (56.1%) | $54,231 |
| 3-Person Families | 41 (16.2%) | $51,719 |
| 4-Person Families | 51 (20.2%) | $52,083 |
| 5-Person Families | 15 (5.9%) | $91,094 |
| 6-Person Families | 4 (1.6%) | $0 |
| 7+ Person Families | 0 (0.0%) | $0 |
| Total | 253 (100.0%) | $53,750 |
Family Income by Number of Earners in Peabody
The median family income in Peabody is $53,750, with families comprising 3+ earners (27) having the highest median family income of $90,781, while families with no earners (47) have the lowest median family income of $30,313, accounting for 10.7% and 18.6% of families, respectively.
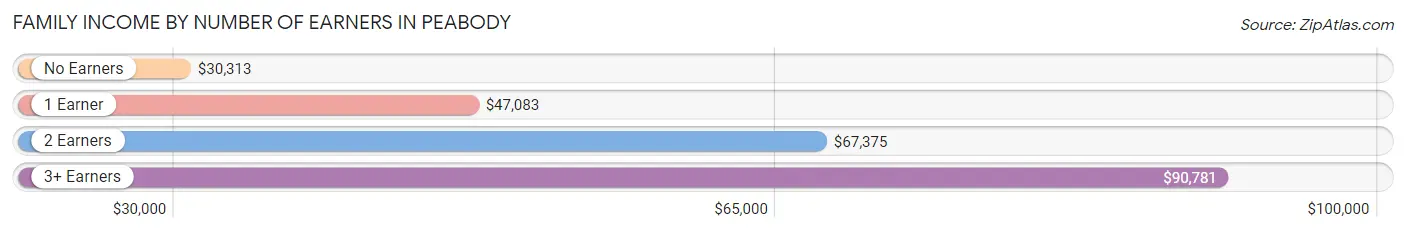
| Number of Earners | # Families | Median Income |
| No Earners | 47 (18.6%) | $30,313 |
| 1 Earner | 98 (38.7%) | $47,083 |
| 2 Earners | 81 (32.0%) | $67,375 |
| 3+ Earners | 27 (10.7%) | $90,781 |
| Total | 253 (100.0%) | $53,750 |
Household Income in Peabody
Household Income Brackets in Peabody
With 154 households falling in the category, the $50,000 to $74,999 income range is the most frequent in Peabody, accounting for 36.4% of all households. In contrast, only 6 households (1.4%) fall into the $200,000+ income bracket, making it the least populous group.
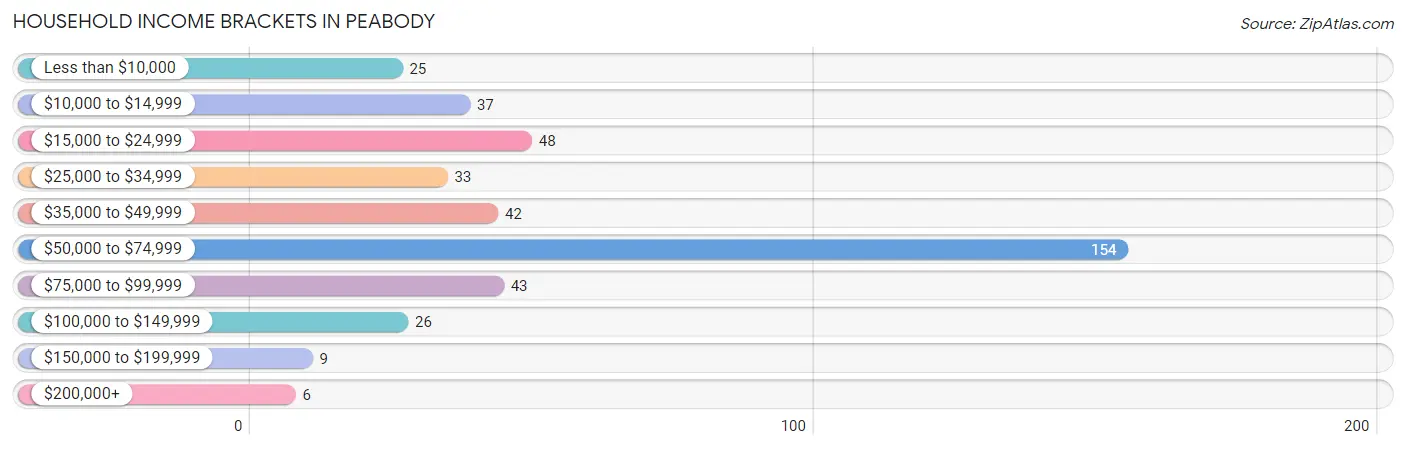
| Income Bracket | # Households | % Households |
| Less than $10,000 | 25 | 5.9% |
| $10,000 to $14,999 | 37 | 8.7% |
| $15,000 to $24,999 | 48 | 11.3% |
| $25,000 to $34,999 | 33 | 7.8% |
| $35,000 to $49,999 | 42 | 9.9% |
| $50,000 to $74,999 | 154 | 36.4% |
| $75,000 to $99,999 | 43 | 10.2% |
| $100,000 to $149,999 | 26 | 6.1% |
| $150,000 to $199,999 | 9 | 2.1% |
| $200,000+ | 6 | 1.4% |
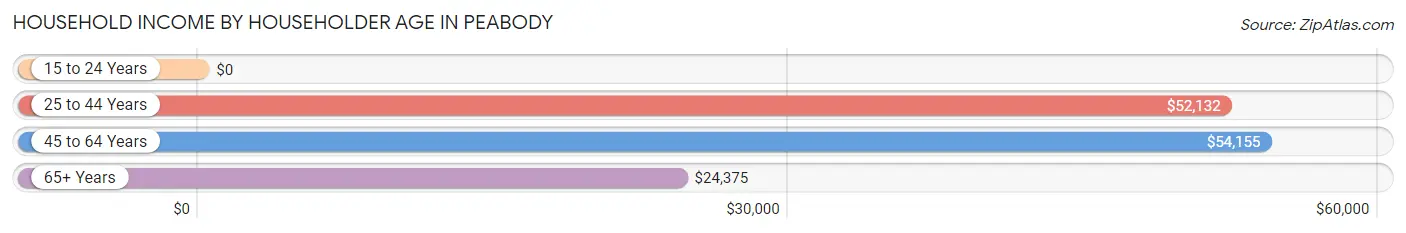
Household Income by Householder Age in Peabody
The median household income in Peabody is $51,299, with the highest median household income of $54,155 found in the 45 to 64 years age bracket for the primary householder. A total of 159 households (37.6%) fall into this category. Meanwhile, the 15 to 24 years age bracket for the primary householder has the lowest median household income of $0, with 2 households (0.5%) in this group.
| Income Bracket | # Households | Median Income |
| 15 to 24 Years | 2 (0.5%) | $0 |
| 25 to 44 Years | 96 (22.7%) | $52,132 |
| 45 to 64 Years | 159 (37.6%) | $54,155 |
| 65+ Years | 166 (39.2%) | $24,375 |
| Total | 423 (100.0%) | $51,299 |
Poverty in Peabody
Income Below Poverty by Sex and Age in Peabody
With 17.5% poverty level for males and 15.2% for females among the residents of Peabody, 25 to 34 year old males and 75 year old and over females are the most vulnerable to poverty, with 45 males (58.4%) and 35 females (60.3%) in their respective age groups living below the poverty level.
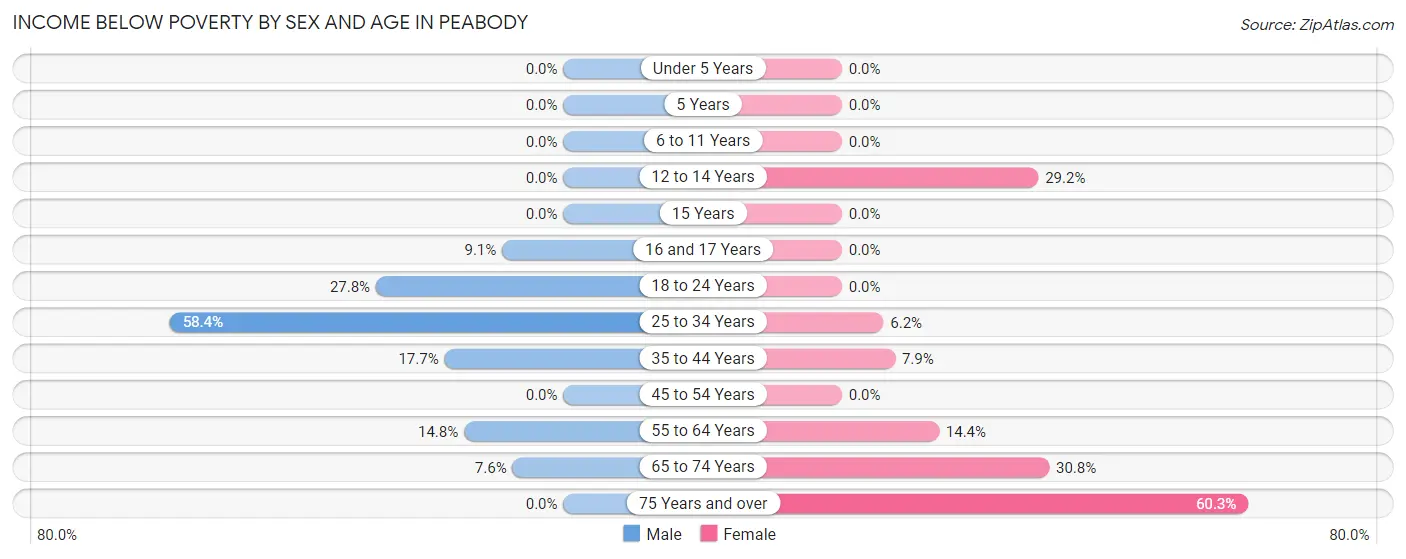
| Age Bracket | Male | Female |
| Under 5 Years | 0 (0.0%) | 0 (0.0%) |
| 5 Years | 0 (0.0%) | 0 (0.0%) |
| 6 to 11 Years | 0 (0.0%) | 0 (0.0%) |
| 12 to 14 Years | 0 (0.0%) | 7 (29.2%) |
| 15 Years | 0 (0.0%) | 0 (0.0%) |
| 16 and 17 Years | 2 (9.1%) | 0 (0.0%) |
| 18 to 24 Years | 32 (27.8%) | 0 (0.0%) |
| 25 to 34 Years | 45 (58.4%) | 5 (6.2%) |
| 35 to 44 Years | 6 (17.6%) | 3 (7.9%) |
| 45 to 54 Years | 0 (0.0%) | 0 (0.0%) |
| 55 to 64 Years | 9 (14.7%) | 17 (14.4%) |
| 65 to 74 Years | 4 (7.5%) | 20 (30.8%) |
| 75 Years and over | 0 (0.0%) | 35 (60.3%) |
| Total | 98 (17.5%) | 87 (15.2%) |
Income Above Poverty by Sex and Age in Peabody
According to the poverty statistics in Peabody, males aged under 5 years and females aged under 5 years are the age groups that are most secure financially, with 100.0% of males and 100.0% of females in these age groups living above the poverty line.
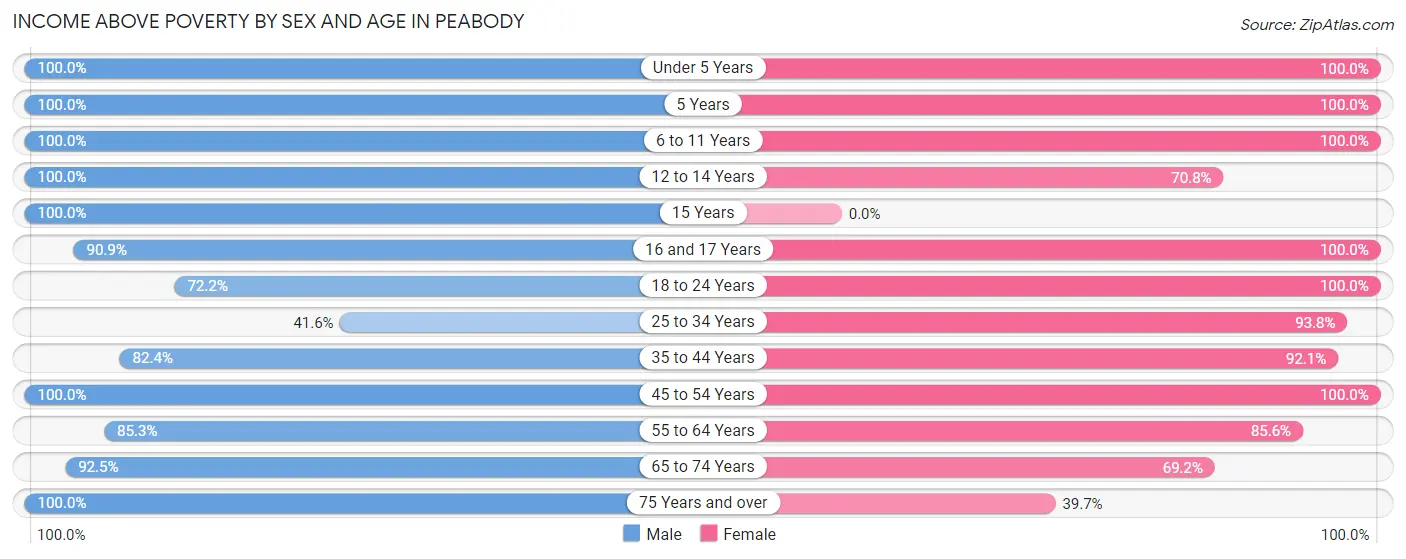
| Age Bracket | Male | Female |
| Under 5 Years | 22 (100.0%) | 69 (100.0%) |
| 5 Years | 4 (100.0%) | 3 (100.0%) |
| 6 to 11 Years | 15 (100.0%) | 38 (100.0%) |
| 12 to 14 Years | 20 (100.0%) | 17 (70.8%) |
| 15 Years | 10 (100.0%) | 0 (0.0%) |
| 16 and 17 Years | 20 (90.9%) | 4 (100.0%) |
| 18 to 24 Years | 83 (72.2%) | 40 (100.0%) |
| 25 to 34 Years | 32 (41.6%) | 76 (93.8%) |
| 35 to 44 Years | 28 (82.4%) | 35 (92.1%) |
| 45 to 54 Years | 51 (100.0%) | 35 (100.0%) |
| 55 to 64 Years | 52 (85.3%) | 101 (85.6%) |
| 65 to 74 Years | 49 (92.4%) | 45 (69.2%) |
| 75 Years and over | 75 (100.0%) | 23 (39.7%) |
| Total | 461 (82.5%) | 486 (84.8%) |
Income Below Poverty Among Married-Couple Families in Peabody
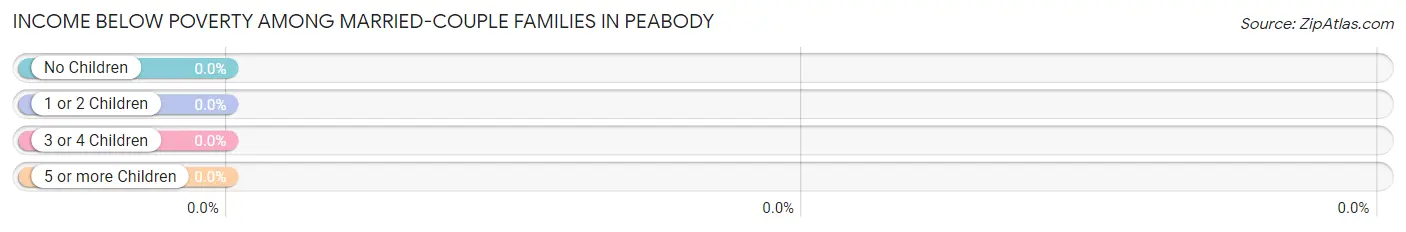
| Children | Above Poverty | Below Poverty |
| No Children | 120 (100.0%) | 0 (0.0%) |
| 1 or 2 Children | 51 (100.0%) | 0 (0.0%) |
| 3 or 4 Children | 7 (100.0%) | 0 (0.0%) |
| 5 or more Children | 0 (0.0%) | 0 (0.0%) |
| Total | 178 (100.0%) | 0 (0.0%) |
Income Below Poverty Among Single-Parent Households in Peabody
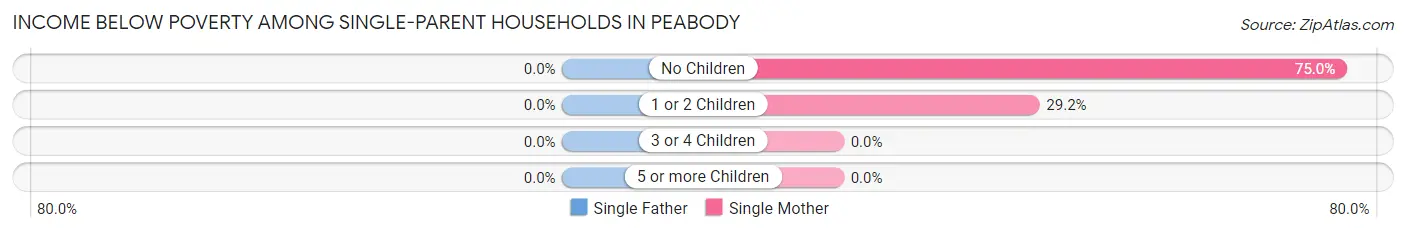
| Children | Single Father | Single Mother |
| No Children | 0 (0.0%) | 12 (75.0%) |
| 1 or 2 Children | 0 (0.0%) | 7 (29.2%) |
| 3 or 4 Children | 0 (0.0%) | 0 (0.0%) |
| 5 or more Children | 0 (0.0%) | 0 (0.0%) |
| Total | 0 (0.0%) | 19 (30.2%) |
Income Below Poverty Among Married-Couple vs Single-Parent Households in Peabody
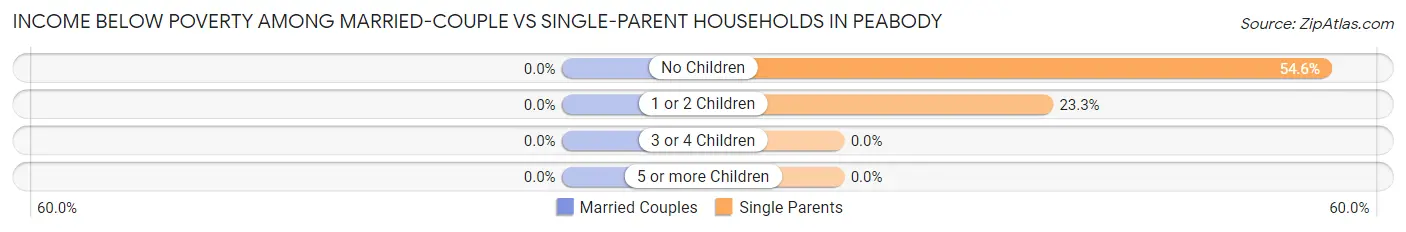
| Children | Married-Couple Families | Single-Parent Households |
| No Children | 0 (0.0%) | 12 (54.5%) |
| 1 or 2 Children | 0 (0.0%) | 7 (23.3%) |
| 3 or 4 Children | 0 (0.0%) | 0 (0.0%) |
| 5 or more Children | 0 (0.0%) | 0 (0.0%) |
| Total | 0 (0.0%) | 19 (25.3%) |
Race in Peabody
The most populous races in Peabody are White / Caucasian (1,218 | 96.7%), Hispanic or Latino (100 | 7.9%), and Two or more Races (23 | 1.8%).
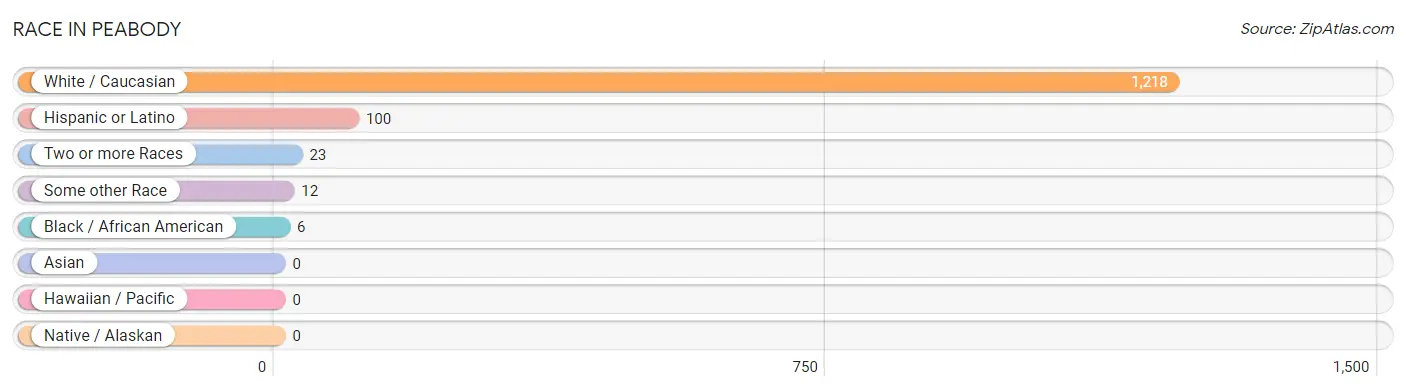
| Race | # Population | % Population |
| Asian | 0 | 0.0% |
| Black / African American | 6 | 0.5% |
| Hawaiian / Pacific | 0 | 0.0% |
| Hispanic or Latino | 100 | 7.9% |
| Native / Alaskan | 0 | 0.0% |
| White / Caucasian | 1,218 | 96.7% |
| Two or more Races | 23 | 1.8% |
| Some other Race | 12 | 0.9% |
| Total | 1,259 | 100.0% |
Ancestry in Peabody
The most populous ancestries reported in Peabody are German (287 | 22.8%), Irish (199 | 15.8%), American (185 | 14.7%), English (132 | 10.5%), and Mexican (89 | 7.1%), together accounting for 70.9% of all Peabody residents.
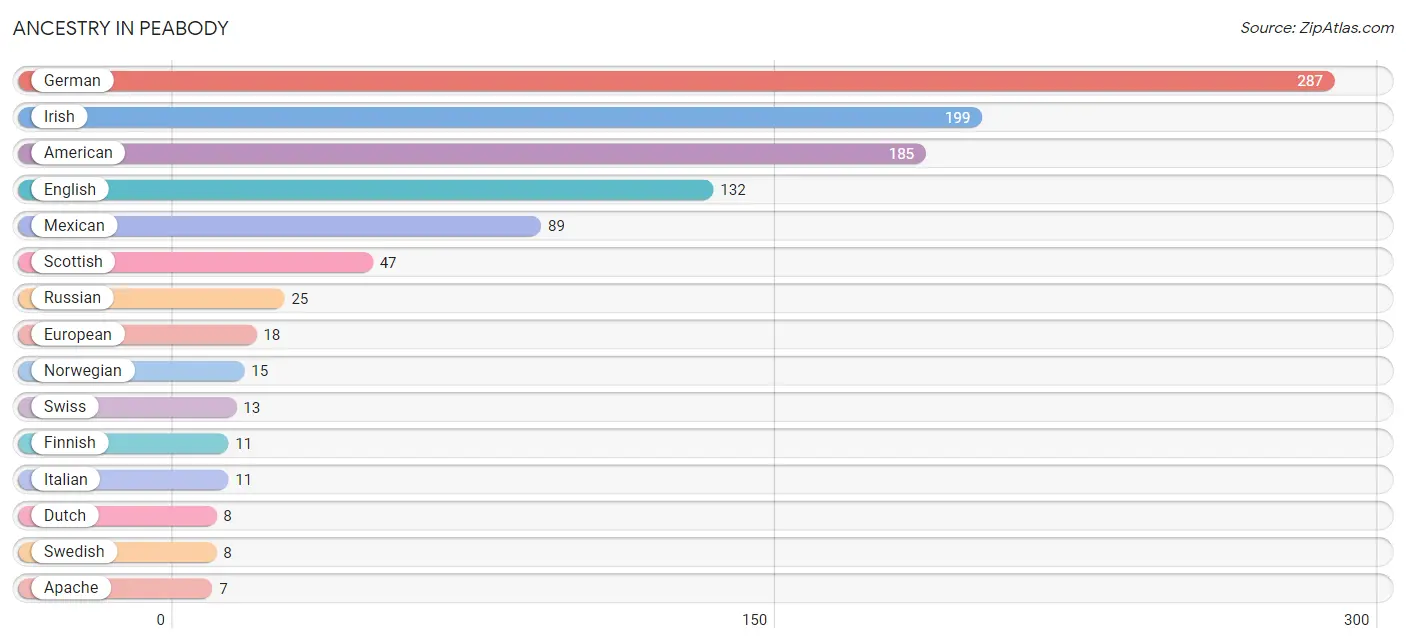
| Ancestry | # Population | % Population |
| American | 185 | 14.7% |
| Apache | 7 | 0.6% |
| British | 6 | 0.5% |
| Central American | 6 | 0.5% |
| Cherokee | 5 | 0.4% |
| Danish | 2 | 0.2% |
| Dutch | 8 | 0.6% |
| English | 132 | 10.5% |
| European | 18 | 1.4% |
| Finnish | 11 | 0.9% |
| French | 4 | 0.3% |
| German | 287 | 22.8% |
| Irish | 199 | 15.8% |
| Italian | 11 | 0.9% |
| Mexican | 89 | 7.1% |
| Norwegian | 15 | 1.2% |
| Russian | 25 | 2.0% |
| Salvadoran | 6 | 0.5% |
| Scottish | 47 | 3.7% |
| Spanish | 5 | 0.4% |
| Swedish | 8 | 0.6% |
| Swiss | 13 | 1.0% | View All 22 Rows |
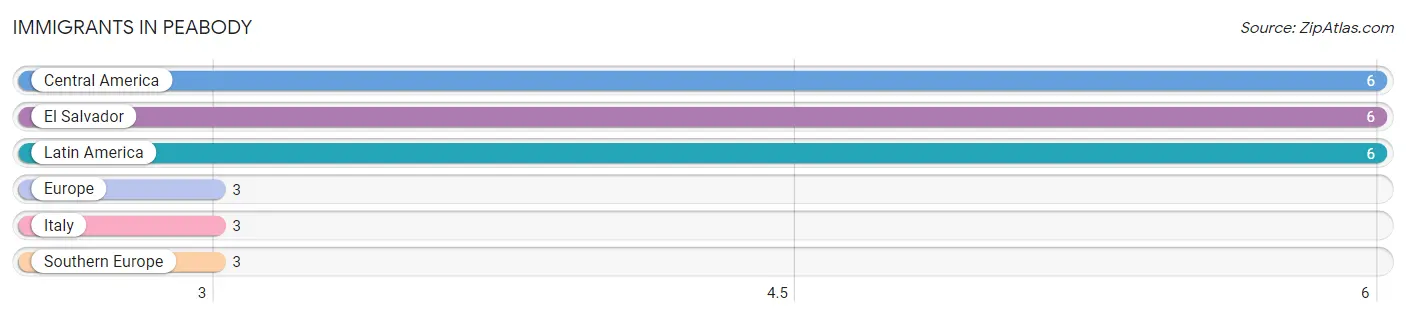
Immigrants in Peabody
The most numerous immigrant groups reported in Peabody came from Central America (6 | 0.5%), El Salvador (6 | 0.5%), Latin America (6 | 0.5%), Europe (3 | 0.2%), and Italy (3 | 0.2%), together accounting for 1.9% of all Peabody residents.
| Immigration Origin | # Population | % Population |
| Central America | 6 | 0.5% |
| El Salvador | 6 | 0.5% |
| Europe | 3 | 0.2% |
| Italy | 3 | 0.2% |
| Latin America | 6 | 0.5% |
| Southern Europe | 3 | 0.2% | View All 6 Rows |
Sex and Age in Peabody
Sex and Age in Peabody
The most populous age groups in Peabody are 15 to 19 Years (123 | 20.5%) for men and Under 5 Years (69 | 10.4%) for women.
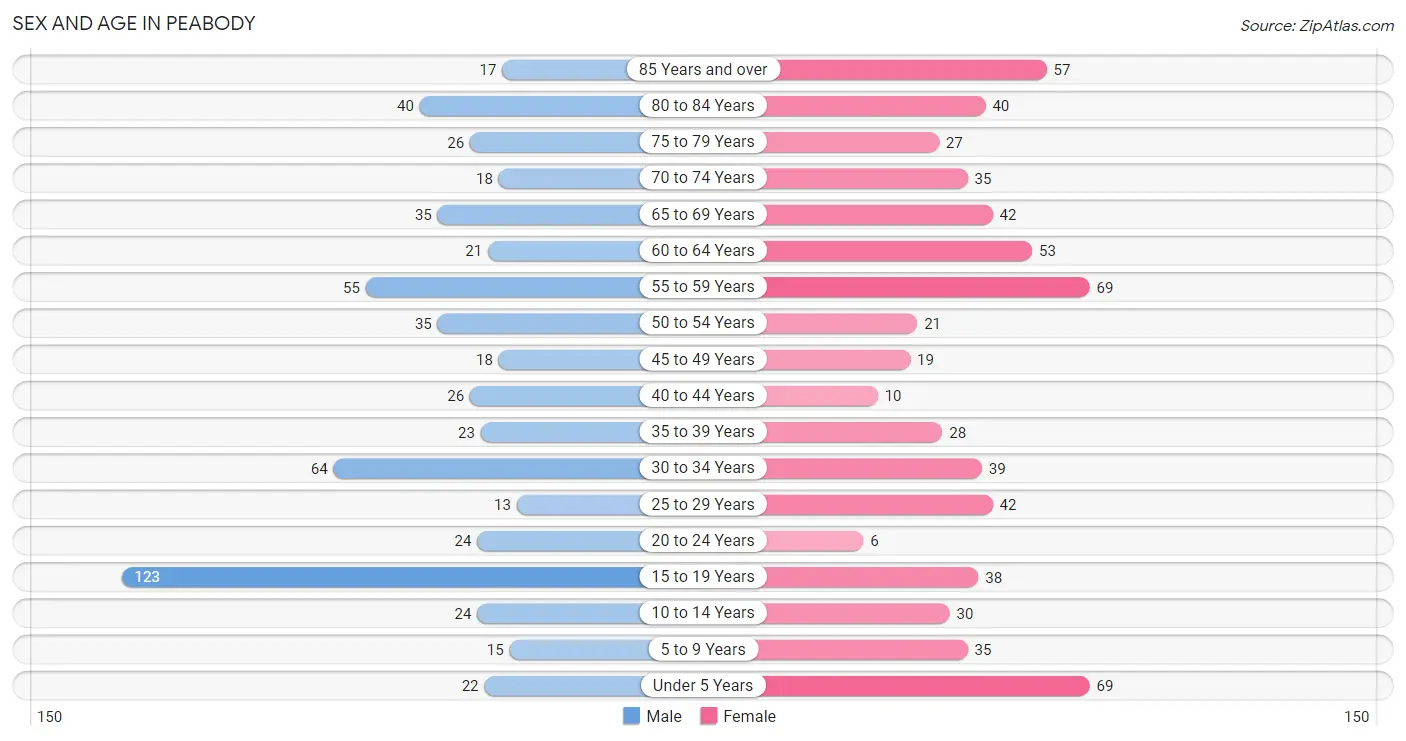
| Age Bracket | Male | Female |
| Under 5 Years | 22 (3.7%) | 69 (10.4%) |
| 5 to 9 Years | 15 (2.5%) | 35 (5.3%) |
| 10 to 14 Years | 24 (4.0%) | 30 (4.5%) |
| 15 to 19 Years | 123 (20.5%) | 38 (5.8%) |
| 20 to 24 Years | 24 (4.0%) | 6 (0.9%) |
| 25 to 29 Years | 13 (2.2%) | 42 (6.4%) |
| 30 to 34 Years | 64 (10.7%) | 39 (5.9%) |
| 35 to 39 Years | 23 (3.8%) | 28 (4.2%) |
| 40 to 44 Years | 26 (4.3%) | 10 (1.5%) |
| 45 to 49 Years | 18 (3.0%) | 19 (2.9%) |
| 50 to 54 Years | 35 (5.8%) | 21 (3.2%) |
| 55 to 59 Years | 55 (9.2%) | 69 (10.4%) |
| 60 to 64 Years | 21 (3.5%) | 53 (8.0%) |
| 65 to 69 Years | 35 (5.8%) | 42 (6.4%) |
| 70 to 74 Years | 18 (3.0%) | 35 (5.3%) |
| 75 to 79 Years | 26 (4.3%) | 27 (4.1%) |
| 80 to 84 Years | 40 (6.7%) | 40 (6.1%) |
| 85 Years and over | 17 (2.8%) | 57 (8.6%) |
| Total | 599 (100.0%) | 660 (100.0%) |
Families and Households in Peabody
Median Family Size in Peabody
The median family size in Peabody is 3.46 persons per family, with single female/mother families (63 | 24.9%) accounting for the largest median family size of 3.79 persons per family. On the other hand, single male/father families (12 | 4.7%) represent the smallest median family size with 2.67 persons per family.
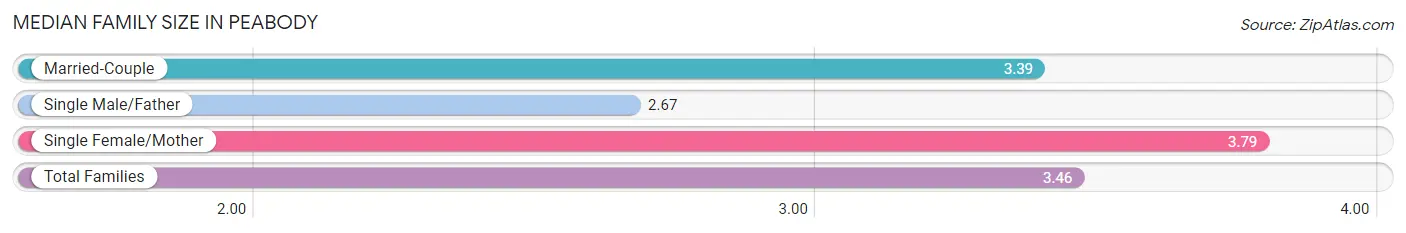
| Family Type | # Families | Family Size |
| Married-Couple | 178 (70.4%) | 3.39 |
| Single Male/Father | 12 (4.7%) | 2.67 |
| Single Female/Mother | 63 (24.9%) | 3.79 |
| Total Families | 253 (100.0%) | 3.46 |
Median Household Size in Peabody
The median household size in Peabody is 2.68 persons per household, with single female/mother households (63 | 14.9%) accounting for the largest median household size of 4.46 persons per household. non-family households (170 | 40.2%) represent the smallest median household size with 1.13 persons per household.
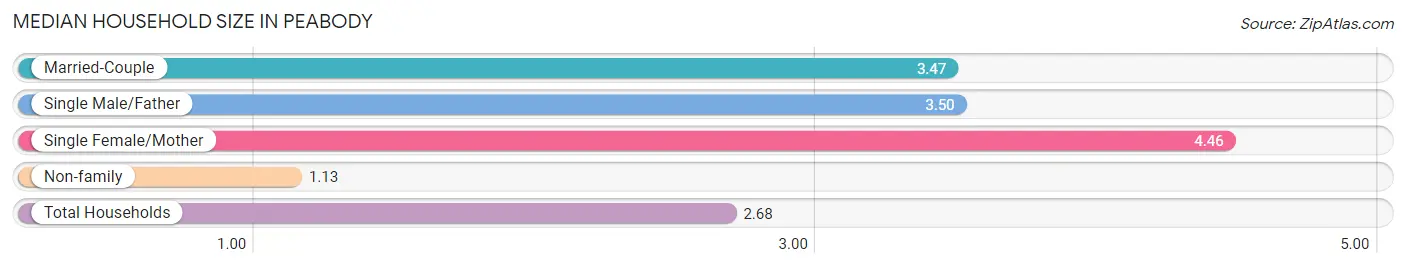
| Household Type | # Households | Household Size |
| Married-Couple | 178 (42.1%) | 3.47 |
| Single Male/Father | 12 (2.8%) | 3.50 |
| Single Female/Mother | 63 (14.9%) | 4.46 |
| Non-family | 170 (40.2%) | 1.13 |
| Total Households | 423 (100.0%) | 2.68 |
Household Size by Marriage Status in Peabody
Out of a total of 423 households in Peabody, 253 (59.8%) are family households, while 170 (40.2%) are nonfamily households. The most numerous type of family households are 2-person households, comprising 138, and the most common type of nonfamily households are 1-person households, comprising 158.
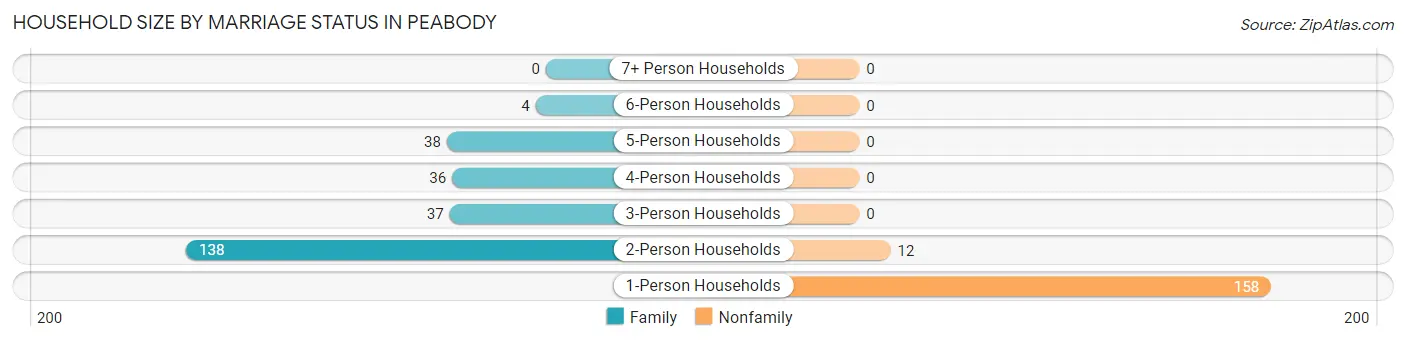
| Household Size | Family Households | Nonfamily Households |
| 1-Person Households | - | 158 (37.3%) |
| 2-Person Households | 138 (32.6%) | 12 (2.8%) |
| 3-Person Households | 37 (8.7%) | 0 (0.0%) |
| 4-Person Households | 36 (8.5%) | 0 (0.0%) |
| 5-Person Households | 38 (9.0%) | 0 (0.0%) |
| 6-Person Households | 4 (0.9%) | 0 (0.0%) |
| 7+ Person Households | 0 (0.0%) | 0 (0.0%) |
| Total | 253 (59.8%) | 170 (40.2%) |
Female Fertility in Peabody
Fertility by Age in Peabody
| Age Bracket | Women with Births | Births / 1,000 Women |
| 15 to 19 years | 0 (0.0%) | 0.0 |
| 20 to 34 years | 0 (0.0%) | 0.0 |
| 35 to 50 years | 0 (0.0%) | 0.0 |
| Total | 0 (0.0%) | 0.0 |
Fertility by Age by Marriage Status in Peabody
| Age Bracket | Married | Unmarried |
| 15 to 19 years | 0 (0.0%) | 0 (0.0%) |
| 20 to 34 years | 0 (0.0%) | 0 (0.0%) |
| 35 to 50 years | 0 (0.0%) | 0 (0.0%) |
| Total | 0 (0.0%) | 0 (0.0%) |
Fertility by Education in Peabody
| Educational Attainment | Women with Births | Births / 1,000 Women |
| Less than High School | 0 (0.0%) | 0.0 |
| High School Diploma | 0 (0.0%) | 0.0 |
| College or Associate's Degree | 0 (0.0%) | 0.0 |
| Bachelor's Degree | 0 (0.0%) | 0.0 |
| Graduate Degree | 0 (0.0%) | 0.0 |
| Total | 0 (0.0%) | 0.0 |
Fertility by Education by Marriage Status in Peabody
| Educational Attainment | Married | Unmarried |
| Less than High School | 0 (0.0%) | 0 (0.0%) |
| High School Diploma | 0 (0.0%) | 0 (0.0%) |
| College or Associate's Degree | 0 (0.0%) | 0 (0.0%) |
| Bachelor's Degree | 0 (0.0%) | 0 (0.0%) |
| Graduate Degree | 0 (0.0%) | 0 (0.0%) |
| Total | 0 (0.0%) | 0 (0.0%) |
Employment Characteristics in Peabody
Employment by Class of Employer in Peabody
Among the 469 employed individuals in Peabody, private company employees (323 | 68.9%), self-employed (not incorporated) (48 | 10.2%), and not-for-profit organizations (35 | 7.5%) make up the most common classes of employment.
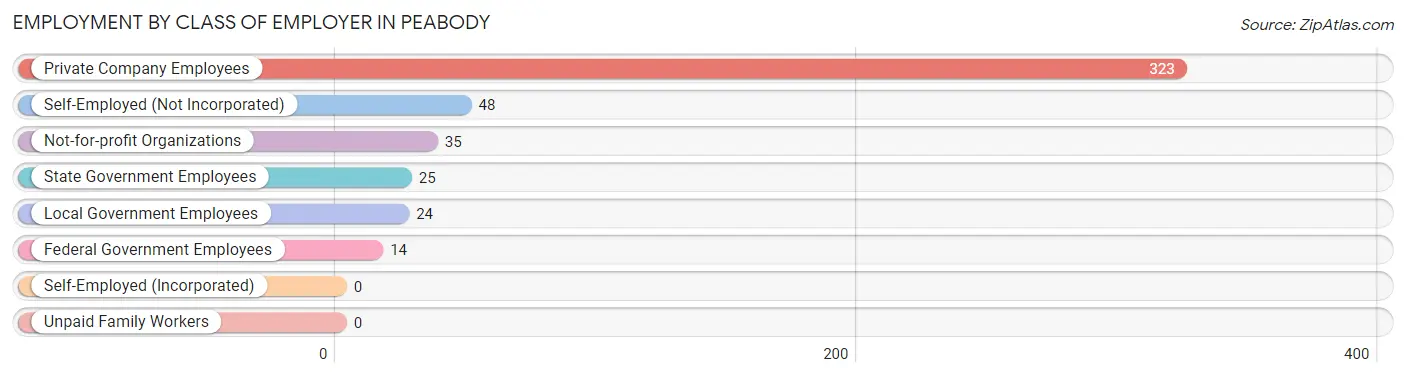
| Employer Class | # Employees | % Employees |
| Private Company Employees | 323 | 68.9% |
| Self-Employed (Incorporated) | 0 | 0.0% |
| Self-Employed (Not Incorporated) | 48 | 10.2% |
| Not-for-profit Organizations | 35 | 7.5% |
| Local Government Employees | 24 | 5.1% |
| State Government Employees | 25 | 5.3% |
| Federal Government Employees | 14 | 3.0% |
| Unpaid Family Workers | 0 | 0.0% |
| Total | 469 | 100.0% |
Employment Status by Age in Peabody
According to the labor force statistics for Peabody, out of the total population over 16 years of age (1,054), 51.3% or 541 individuals are in the labor force, with 12.2% or 66 of them unemployed. The age group with the highest labor force participation rate is 20 to 24 years, with 86.7% or 26 individuals in the labor force. Within the labor force, the 16 to 19 years age range has the highest percentage of unemployed individuals, with 53.6% or 59 of them being unemployed.
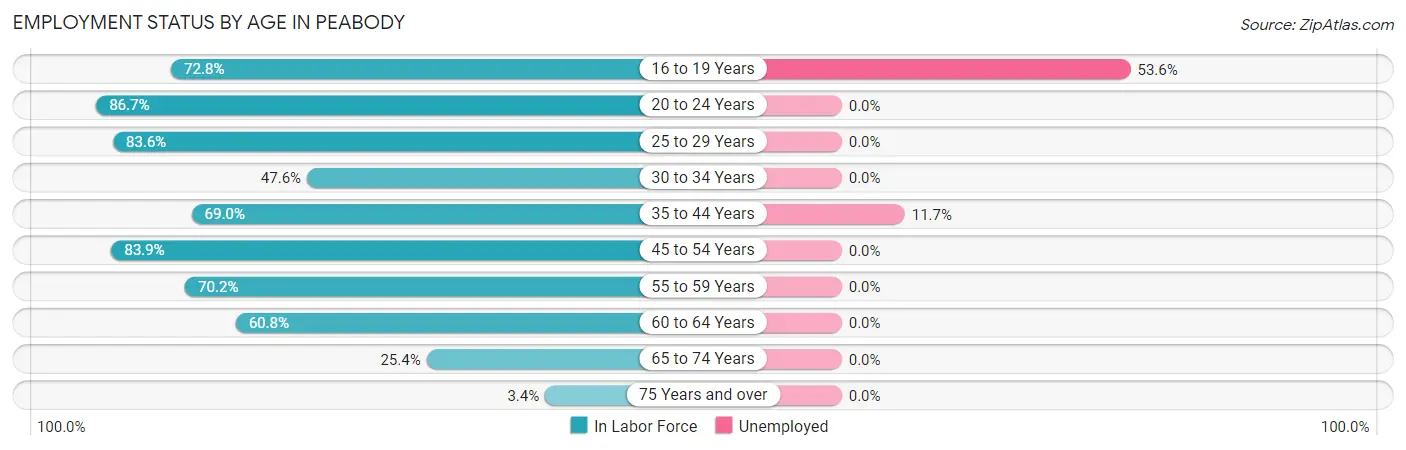
| Age Bracket | In Labor Force | Unemployed |
| 16 to 19 Years | 110 (72.8%) | 59 (53.6%) |
| 20 to 24 Years | 26 (86.7%) | 0 (0.0%) |
| 25 to 29 Years | 46 (83.6%) | 0 (0.0%) |
| 30 to 34 Years | 49 (47.6%) | 0 (0.0%) |
| 35 to 44 Years | 60 (69.0%) | 7 (11.7%) |
| 45 to 54 Years | 78 (83.9%) | 0 (0.0%) |
| 55 to 59 Years | 87 (70.2%) | 0 (0.0%) |
| 60 to 64 Years | 45 (60.8%) | 0 (0.0%) |
| 65 to 74 Years | 33 (25.4%) | 0 (0.0%) |
| 75 Years and over | 7 (3.4%) | 0 (0.0%) |
| Total | 541 (51.3%) | 66 (12.2%) |
Employment Status by Educational Attainment in Peabody
According to labor force statistics for Peabody, 68.1% of individuals (365) out of the total population between 25 and 64 years of age (536) are in the labor force, with 1.9% or 7 of them being unemployed. The group with the highest labor force participation rate are those with the educational attainment of college / associate degree, with 81.2% or 138 individuals in the labor force. Within the labor force, individuals with high school diploma education have the highest percentage of unemployment, with 4.7% or 7 of them being unemployed.
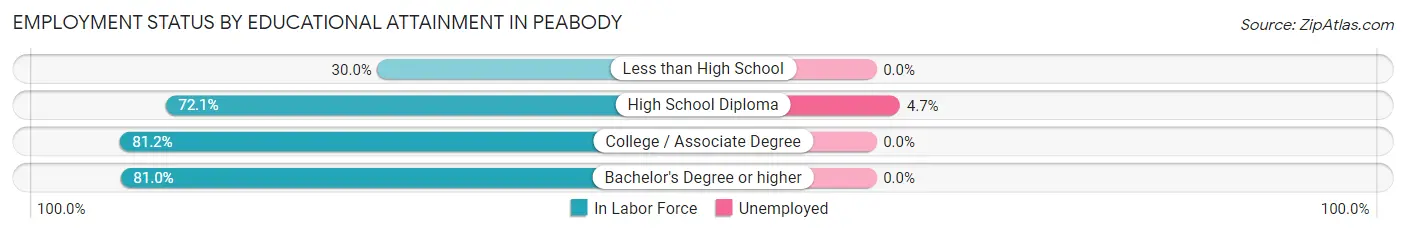
| Educational Attainment | In Labor Force | Unemployed |
| Less than High School | 30 (30.0%) | 0 (0.0%) |
| High School Diploma | 150 (72.1%) | 10 (4.7%) |
| College / Associate Degree | 138 (81.2%) | 0 (0.0%) |
| Bachelor's Degree or higher | 47 (81.0%) | 0 (0.0%) |
| Total | 365 (68.1%) | 10 (1.9%) |
Employment Occupations by Sex in Peabody
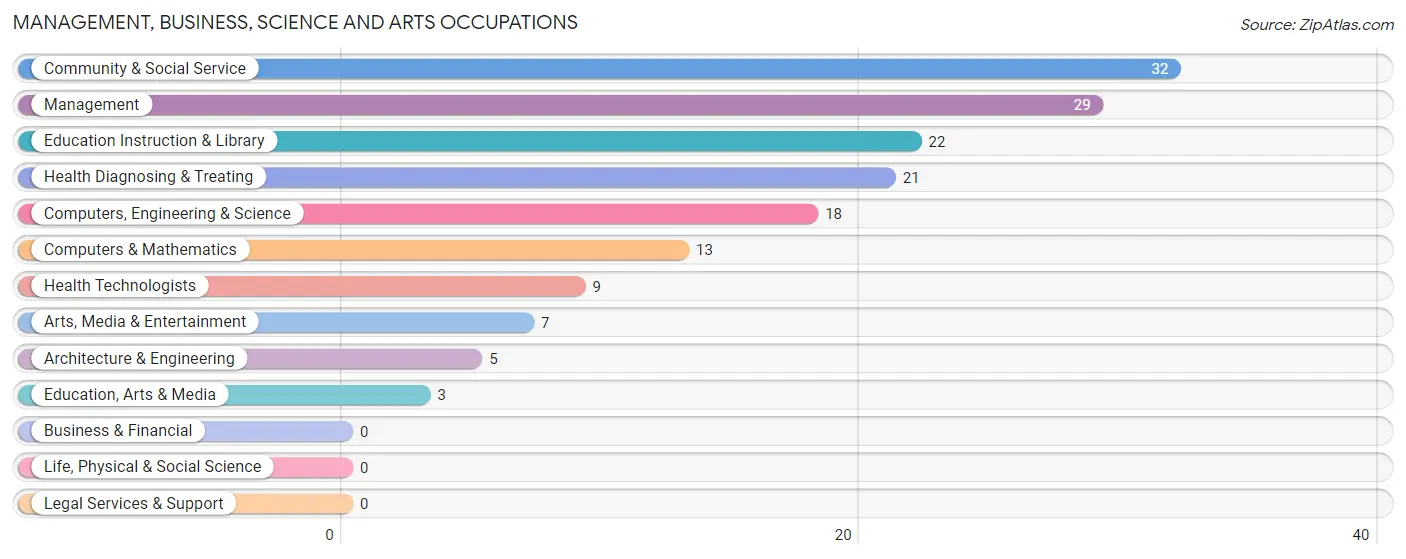
Management, Business, Science and Arts Occupations
The most common Management, Business, Science and Arts occupations in Peabody are Community & Social Service (32 | 6.7%), Management (29 | 6.1%), Education Instruction & Library (22 | 4.6%), Health Diagnosing & Treating (21 | 4.4%), and Computers, Engineering & Science (18 | 3.8%).
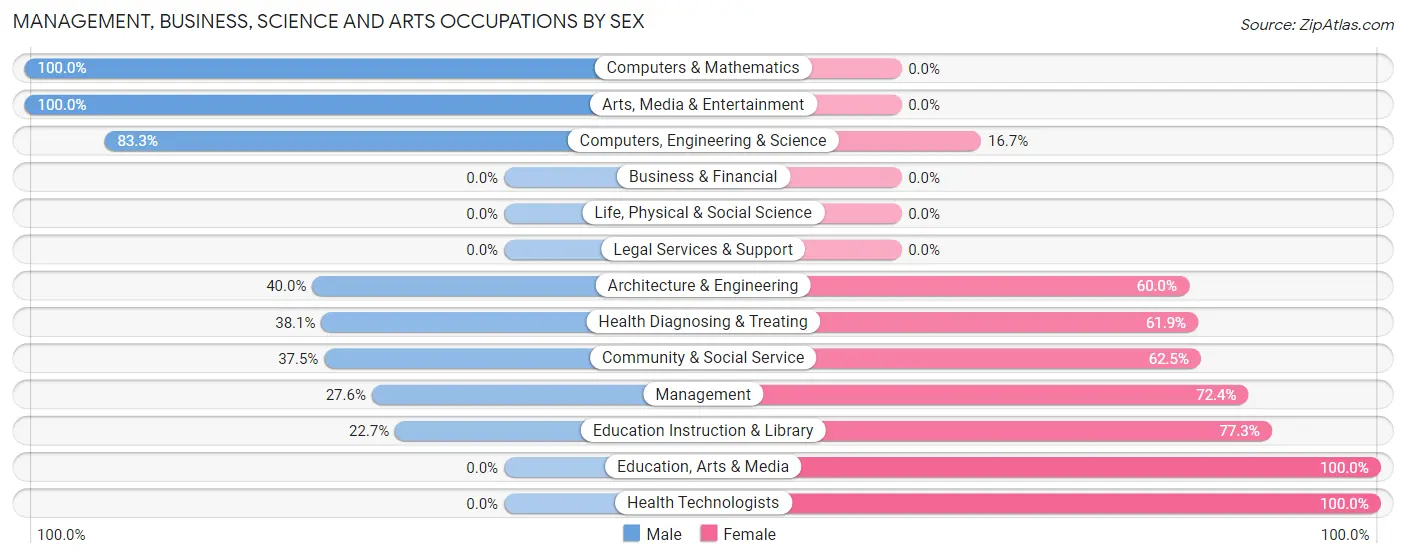
Management, Business, Science and Arts Occupations by Sex
Within the Management, Business, Science and Arts occupations in Peabody, the most male-oriented occupations are Computers & Mathematics (100.0%), Arts, Media & Entertainment (100.0%), and Computers, Engineering & Science (83.3%), while the most female-oriented occupations are Education, Arts & Media (100.0%), Health Technologists (100.0%), and Education Instruction & Library (77.3%).
| Occupation | Male | Female |
| Management | 8 (27.6%) | 21 (72.4%) |
| Business & Financial | 0 (0.0%) | 0 (0.0%) |
| Computers, Engineering & Science | 15 (83.3%) | 3 (16.7%) |
| Computers & Mathematics | 13 (100.0%) | 0 (0.0%) |
| Architecture & Engineering | 2 (40.0%) | 3 (60.0%) |
| Life, Physical & Social Science | 0 (0.0%) | 0 (0.0%) |
| Community & Social Service | 12 (37.5%) | 20 (62.5%) |
| Education, Arts & Media | 0 (0.0%) | 3 (100.0%) |
| Legal Services & Support | 0 (0.0%) | 0 (0.0%) |
| Education Instruction & Library | 5 (22.7%) | 17 (77.3%) |
| Arts, Media & Entertainment | 7 (100.0%) | 0 (0.0%) |
| Health Diagnosing & Treating | 8 (38.1%) | 13 (61.9%) |
| Health Technologists | 0 (0.0%) | 9 (100.0%) |
| Total (Category) | 43 (43.0%) | 57 (57.0%) |
| Total (Overall) | 199 (41.9%) | 276 (58.1%) |
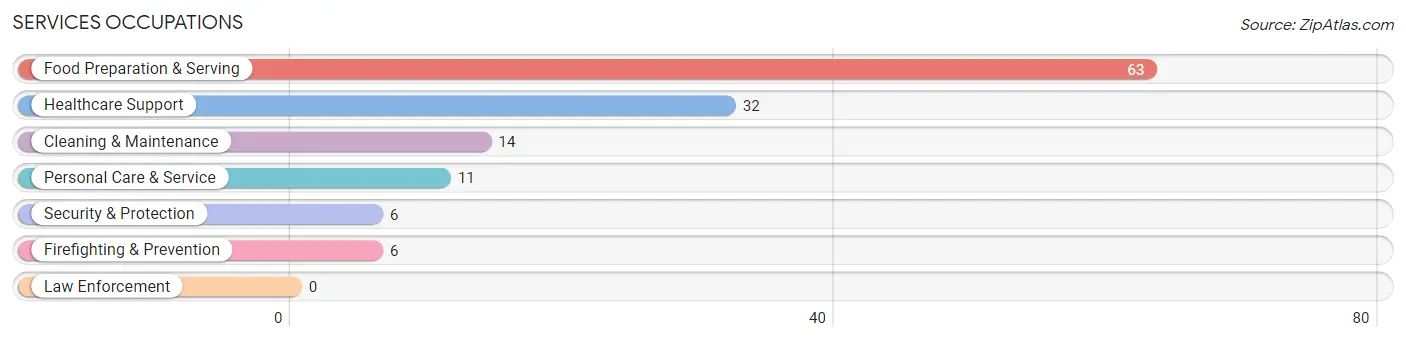
Services Occupations
The most common Services occupations in Peabody are Food Preparation & Serving (63 | 13.3%), Healthcare Support (32 | 6.7%), Cleaning & Maintenance (14 | 2.9%), Personal Care & Service (11 | 2.3%), and Security & Protection (6 | 1.3%).
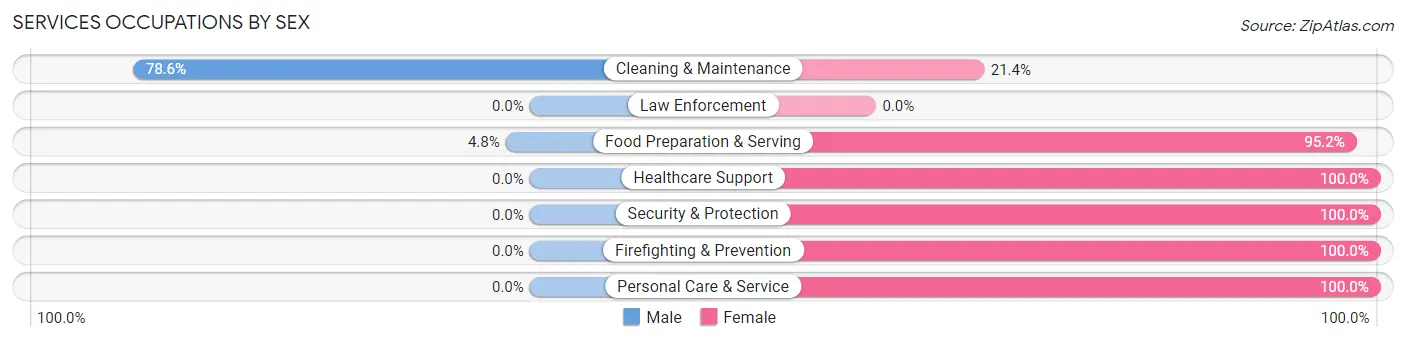
Services Occupations by Sex
Within the Services occupations in Peabody, the most male-oriented occupations are Cleaning & Maintenance (78.6%), and Food Preparation & Serving (4.8%), while the most female-oriented occupations are Healthcare Support (100.0%), Security & Protection (100.0%), and Firefighting & Prevention (100.0%).
| Occupation | Male | Female |
| Healthcare Support | 0 (0.0%) | 32 (100.0%) |
| Security & Protection | 0 (0.0%) | 6 (100.0%) |
| Firefighting & Prevention | 0 (0.0%) | 6 (100.0%) |
| Law Enforcement | 0 (0.0%) | 0 (0.0%) |
| Food Preparation & Serving | 3 (4.8%) | 60 (95.2%) |
| Cleaning & Maintenance | 11 (78.6%) | 3 (21.4%) |
| Personal Care & Service | 0 (0.0%) | 11 (100.0%) |
| Total (Category) | 14 (11.1%) | 112 (88.9%) |
| Total (Overall) | 199 (41.9%) | 276 (58.1%) |
Sales and Office Occupations
The most common Sales and Office occupations in Peabody are Office & Administration (67 | 14.1%), and Sales & Related (41 | 8.6%).
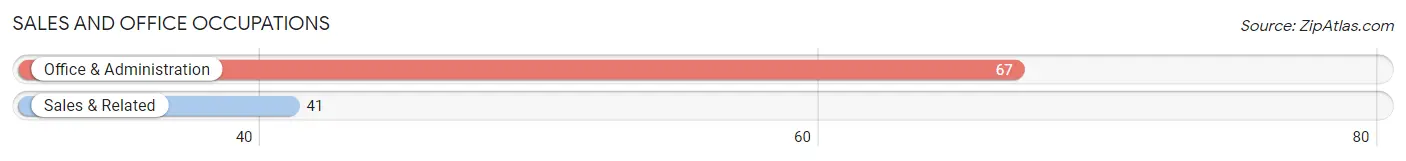
Sales and Office Occupations by Sex
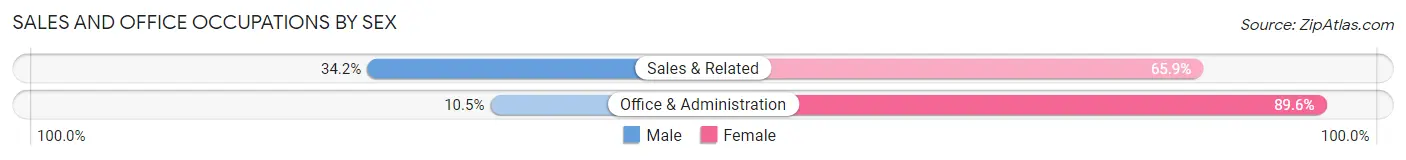
| Occupation | Male | Female |
| Sales & Related | 14 (34.2%) | 27 (65.8%) |
| Office & Administration | 7 (10.4%) | 60 (89.5%) |
| Total (Category) | 21 (19.4%) | 87 (80.6%) |
| Total (Overall) | 199 (41.9%) | 276 (58.1%) |
Natural Resources, Construction and Maintenance Occupations
The most common Natural Resources, Construction and Maintenance occupations in Peabody are Construction & Extraction (32 | 6.7%), and Installation, Maintenance & Repair (9 | 1.9%).
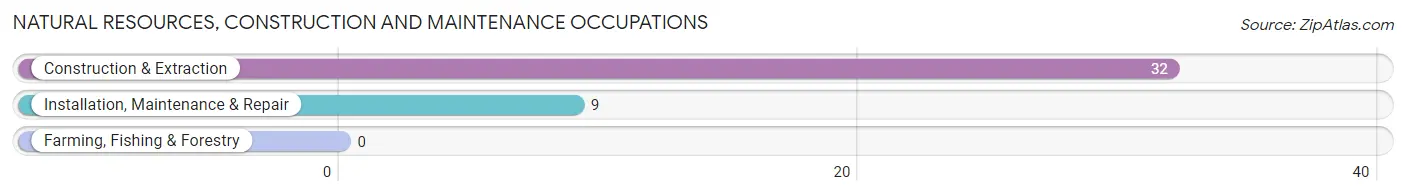
Natural Resources, Construction and Maintenance Occupations by Sex
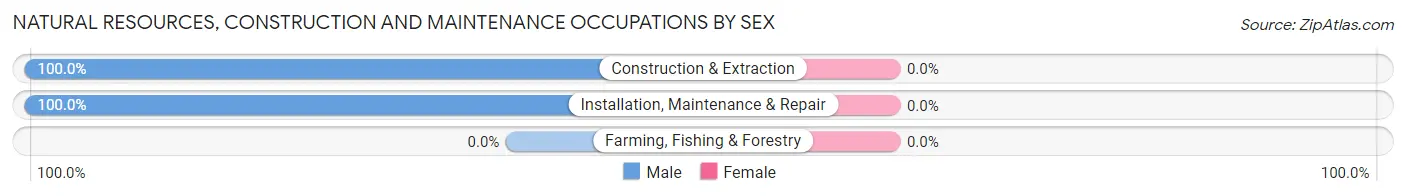
| Occupation | Male | Female |
| Farming, Fishing & Forestry | 0 (0.0%) | 0 (0.0%) |
| Construction & Extraction | 32 (100.0%) | 0 (0.0%) |
| Installation, Maintenance & Repair | 9 (100.0%) | 0 (0.0%) |
| Total (Category) | 41 (100.0%) | 0 (0.0%) |
| Total (Overall) | 199 (41.9%) | 276 (58.1%) |
Production, Transportation and Moving Occupations
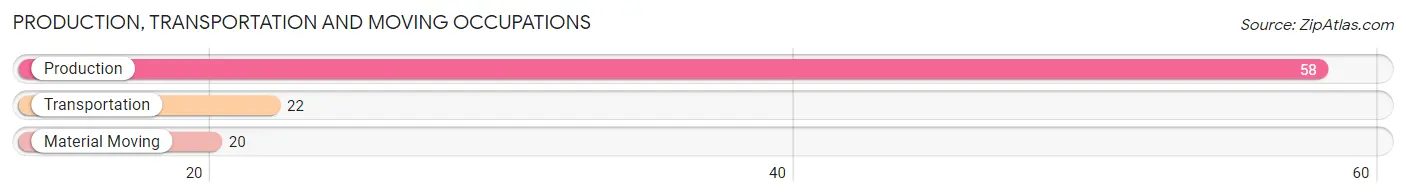
The most common Production, Transportation and Moving occupations in Peabody are Production (58 | 12.2%), Transportation (22 | 4.6%), and Material Moving (20 | 4.2%).
Production, Transportation and Moving Occupations by Sex
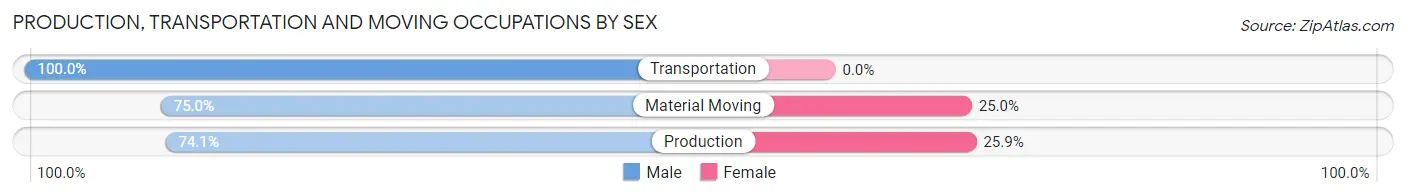
| Occupation | Male | Female |
| Production | 43 (74.1%) | 15 (25.9%) |
| Transportation | 22 (100.0%) | 0 (0.0%) |
| Material Moving | 15 (75.0%) | 5 (25.0%) |
| Total (Category) | 80 (80.0%) | 20 (20.0%) |
| Total (Overall) | 199 (41.9%) | 276 (58.1%) |
Employment Industries by Sex in Peabody
Employment Industries in Peabody
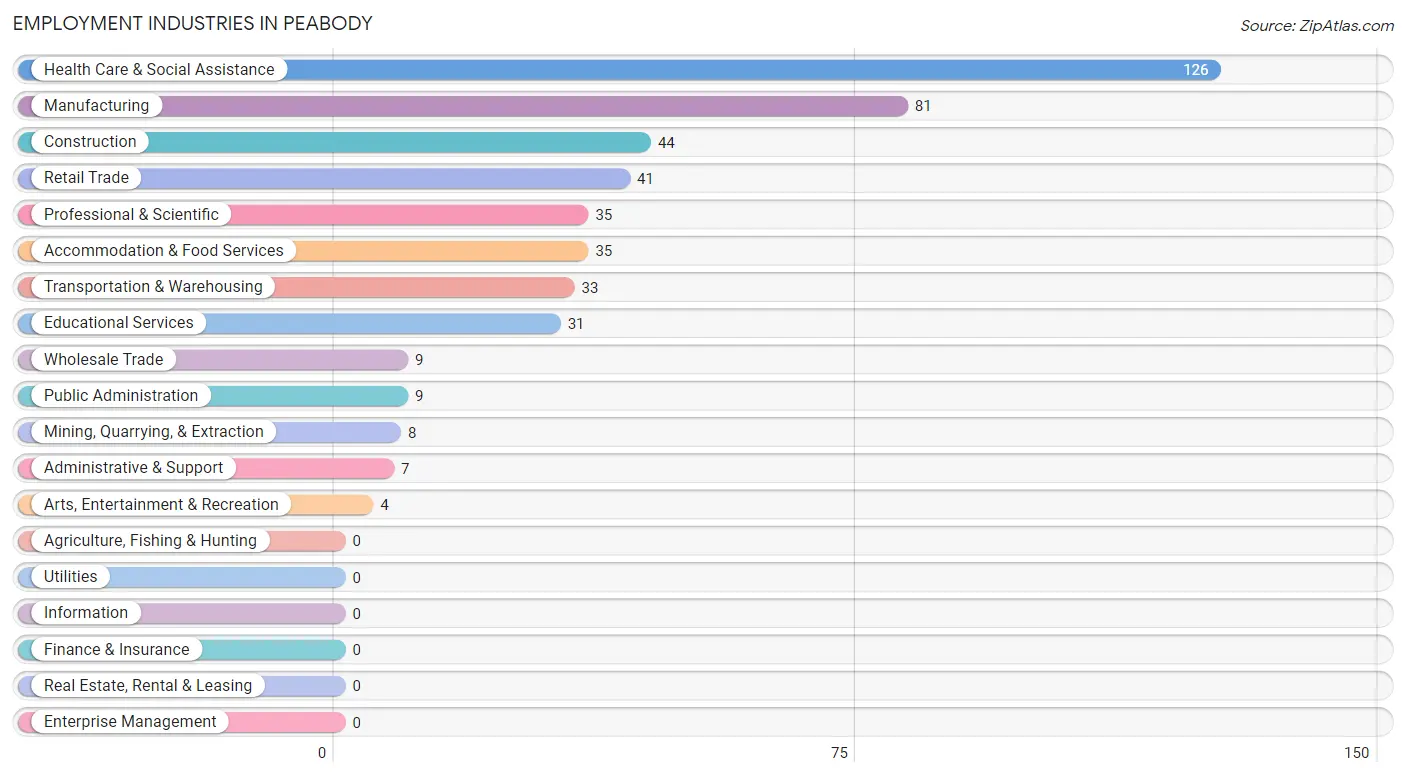
The major employment industries in Peabody include Health Care & Social Assistance (126 | 26.5%), Manufacturing (81 | 17.1%), Construction (44 | 9.3%), Retail Trade (41 | 8.6%), and Professional & Scientific (35 | 7.4%).
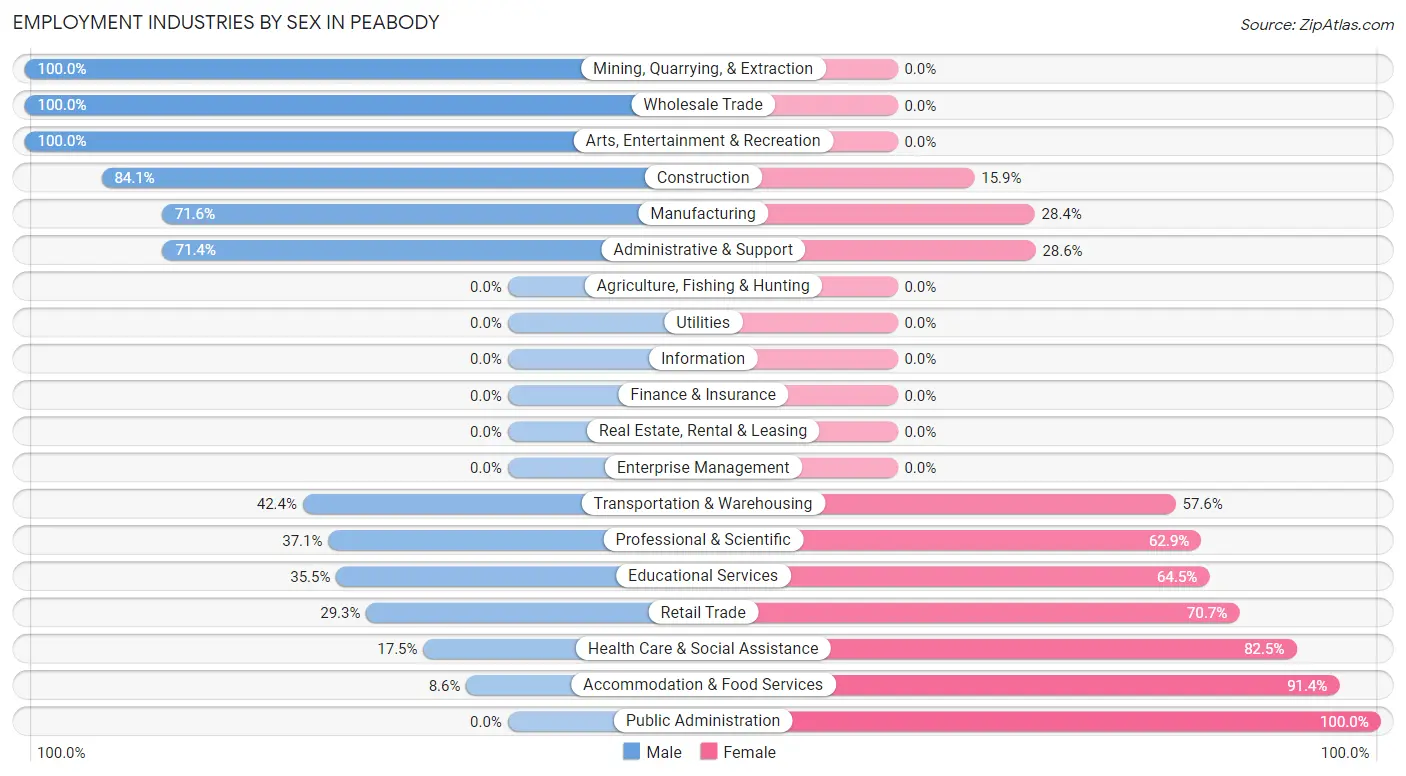
Employment Industries by Sex in Peabody
The Peabody industries that see more men than women are Mining, Quarrying, & Extraction (100.0%), Wholesale Trade (100.0%), and Arts, Entertainment & Recreation (100.0%), whereas the industries that tend to have a higher number of women are Public Administration (100.0%), Accommodation & Food Services (91.4%), and Health Care & Social Assistance (82.5%).
| Industry | Male | Female |
| Agriculture, Fishing & Hunting | 0 (0.0%) | 0 (0.0%) |
| Mining, Quarrying, & Extraction | 8 (100.0%) | 0 (0.0%) |
| Construction | 37 (84.1%) | 7 (15.9%) |
| Manufacturing | 58 (71.6%) | 23 (28.4%) |
| Wholesale Trade | 9 (100.0%) | 0 (0.0%) |
| Retail Trade | 12 (29.3%) | 29 (70.7%) |
| Transportation & Warehousing | 14 (42.4%) | 19 (57.6%) |
| Utilities | 0 (0.0%) | 0 (0.0%) |
| Information | 0 (0.0%) | 0 (0.0%) |
| Finance & Insurance | 0 (0.0%) | 0 (0.0%) |
| Real Estate, Rental & Leasing | 0 (0.0%) | 0 (0.0%) |
| Professional & Scientific | 13 (37.1%) | 22 (62.9%) |
| Enterprise Management | 0 (0.0%) | 0 (0.0%) |
| Administrative & Support | 5 (71.4%) | 2 (28.6%) |
| Educational Services | 11 (35.5%) | 20 (64.5%) |
| Health Care & Social Assistance | 22 (17.5%) | 104 (82.5%) |
| Arts, Entertainment & Recreation | 4 (100.0%) | 0 (0.0%) |
| Accommodation & Food Services | 3 (8.6%) | 32 (91.4%) |
| Public Administration | 0 (0.0%) | 9 (100.0%) |
| Total | 199 (41.9%) | 276 (58.1%) |
Education in Peabody
School Enrollment in Peabody
The most common levels of schooling among the 211 students in Peabody are high school (66 | 31.3%), elementary school (46 | 21.8%), and middle school (33 | 15.6%).
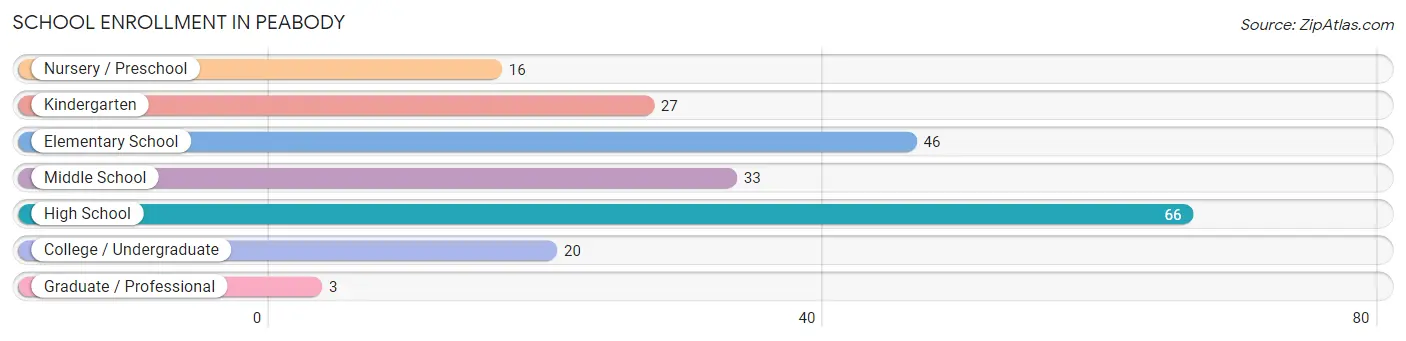
| School Level | # Students | % Students |
| Nursery / Preschool | 16 | 7.6% |
| Kindergarten | 27 | 12.8% |
| Elementary School | 46 | 21.8% |
| Middle School | 33 | 15.6% |
| High School | 66 | 31.3% |
| College / Undergraduate | 20 | 9.5% |
| Graduate / Professional | 3 | 1.4% |
| Total | 211 | 100.0% |
School Enrollment by Age by Funding Source in Peabody
Out of a total of 211 students who are enrolled in schools in Peabody, 8 (3.8%) attend a private institution, while the remaining 203 (96.2%) are enrolled in public schools. The age group of 20 to 24 year olds has the highest likelihood of being enrolled in private schools, with 2 (22.2% in the age bracket) enrolled. Conversely, the age group of 10 to 14 year olds has the lowest likelihood of being enrolled in a private school, with 54 (100.0% in the age bracket) attending a public institution.
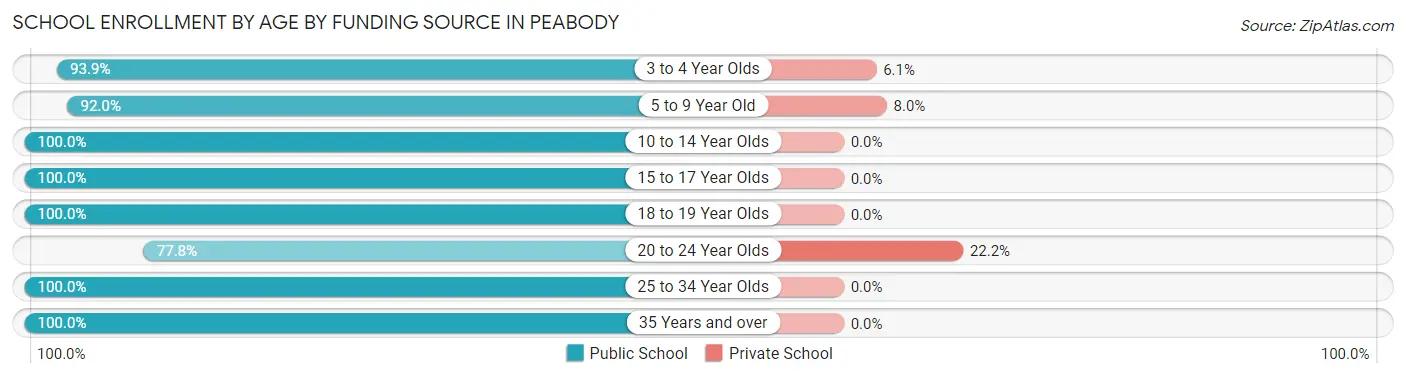
| Age Bracket | Public School | Private School |
| 3 to 4 Year Olds | 31 (93.9%) | 2 (6.1%) |
| 5 to 9 Year Old | 46 (92.0%) | 4 (8.0%) |
| 10 to 14 Year Olds | 54 (100.0%) | 0 (0.0%) |
| 15 to 17 Year Olds | 36 (100.0%) | 0 (0.0%) |
| 18 to 19 Year Olds | 15 (100.0%) | 0 (0.0%) |
| 20 to 24 Year Olds | 7 (77.8%) | 2 (22.2%) |
| 25 to 34 Year Olds | 11 (100.0%) | 0 (0.0%) |
| 35 Years and over | 3 (100.0%) | 0 (0.0%) |
| Total | 203 (96.2%) | 8 (3.8%) |
Educational Attainment by Field of Study in Peabody
Education (33 | 32.7%), arts & humanities (18 | 17.8%), science & technology (12 | 11.9%), business (12 | 11.9%), and literature & languages (8 | 7.9%) are the most common fields of study among 101 individuals in Peabody who have obtained a bachelor's degree or higher.
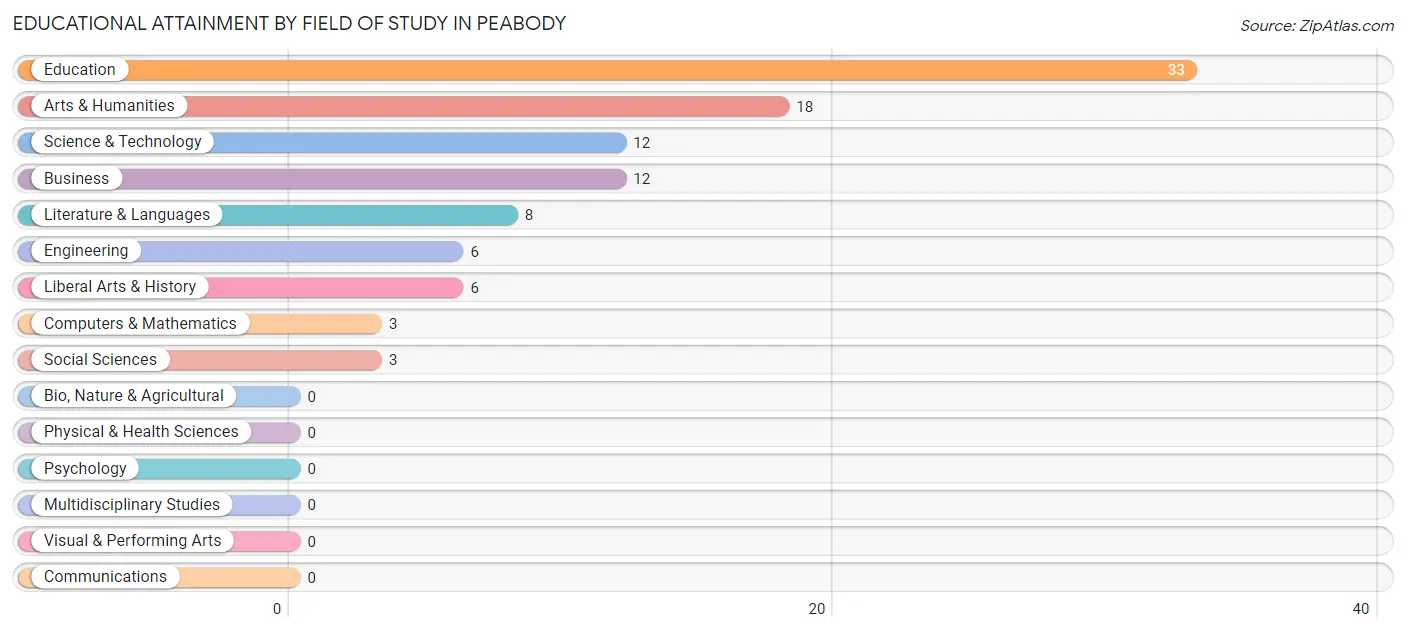
| Field of Study | # Graduates | % Graduates |
| Computers & Mathematics | 3 | 3.0% |
| Bio, Nature & Agricultural | 0 | 0.0% |
| Physical & Health Sciences | 0 | 0.0% |
| Psychology | 0 | 0.0% |
| Social Sciences | 3 | 3.0% |
| Engineering | 6 | 5.9% |
| Multidisciplinary Studies | 0 | 0.0% |
| Science & Technology | 12 | 11.9% |
| Business | 12 | 11.9% |
| Education | 33 | 32.7% |
| Literature & Languages | 8 | 7.9% |
| Liberal Arts & History | 6 | 5.9% |
| Visual & Performing Arts | 0 | 0.0% |
| Communications | 0 | 0.0% |
| Arts & Humanities | 18 | 17.8% |
| Total | 101 | 100.0% |
Transportation & Commute in Peabody
Vehicle Availability by Sex in Peabody
The most prevalent vehicle ownership categories in Peabody are males with 2 vehicles (63, accounting for 32.6%) and females with 2 vehicles (98, making up 22.8%).
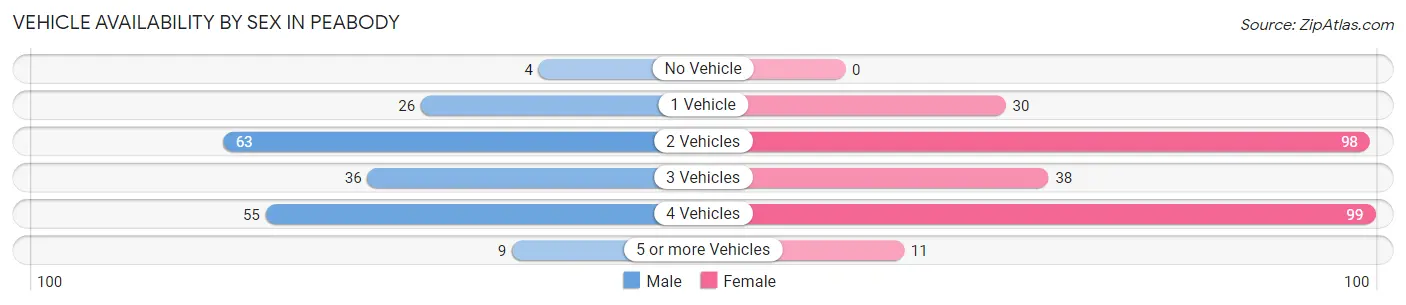
| Vehicles Available | Male | Female |
| No Vehicle | 4 (2.1%) | 0 (0.0%) |
| 1 Vehicle | 26 (13.5%) | 30 (10.9%) |
| 2 Vehicles | 63 (32.6%) | 98 (35.5%) |
| 3 Vehicles | 36 (18.6%) | 38 (13.8%) |
| 4 Vehicles | 55 (28.5%) | 99 (35.9%) |
| 5 or more Vehicles | 9 (4.7%) | 11 (4.0%) |
| Total | 193 (100.0%) | 276 (100.0%) |
Commute Time in Peabody
The most frequently occuring commute durations in Peabody are 5 to 9 minutes (95 commuters, 21.6%), 20 to 24 minutes (84 commuters, 19.1%), and 25 to 29 minutes (49 commuters, 11.2%).
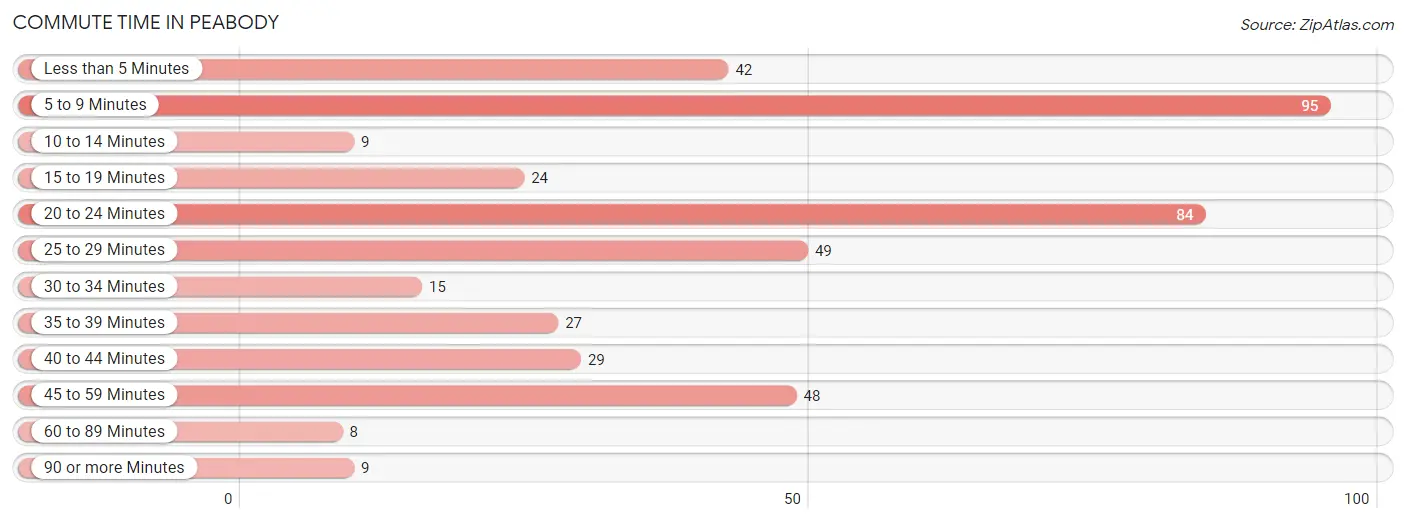
| Commute Time | # Commuters | % Commuters |
| Less than 5 Minutes | 42 | 9.6% |
| 5 to 9 Minutes | 95 | 21.6% |
| 10 to 14 Minutes | 9 | 2.1% |
| 15 to 19 Minutes | 24 | 5.5% |
| 20 to 24 Minutes | 84 | 19.1% |
| 25 to 29 Minutes | 49 | 11.2% |
| 30 to 34 Minutes | 15 | 3.4% |
| 35 to 39 Minutes | 27 | 6.1% |
| 40 to 44 Minutes | 29 | 6.6% |
| 45 to 59 Minutes | 48 | 10.9% |
| 60 to 89 Minutes | 8 | 1.8% |
| 90 or more Minutes | 9 | 2.1% |
Commute Time by Sex in Peabody
The most common commute times in Peabody are 45 to 59 minutes (40 commuters, 23.7%) for males and 5 to 9 minutes (82 commuters, 30.4%) for females.
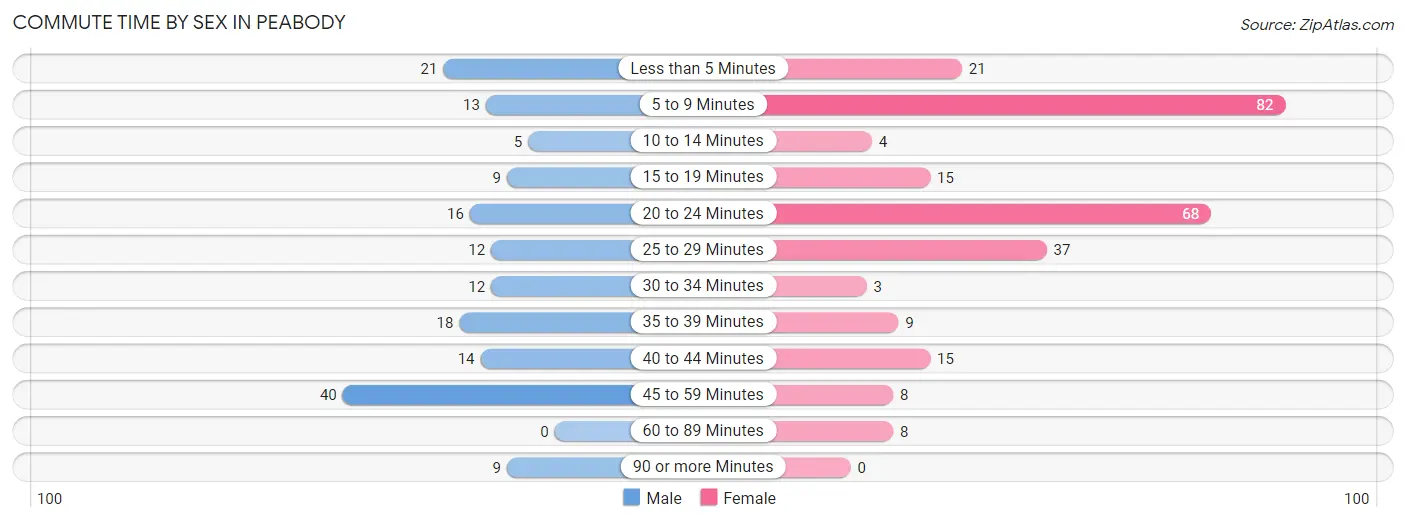
| Commute Time | Male | Female |
| Less than 5 Minutes | 21 (12.4%) | 21 (7.8%) |
| 5 to 9 Minutes | 13 (7.7%) | 82 (30.4%) |
| 10 to 14 Minutes | 5 (3.0%) | 4 (1.5%) |
| 15 to 19 Minutes | 9 (5.3%) | 15 (5.6%) |
| 20 to 24 Minutes | 16 (9.5%) | 68 (25.2%) |
| 25 to 29 Minutes | 12 (7.1%) | 37 (13.7%) |
| 30 to 34 Minutes | 12 (7.1%) | 3 (1.1%) |
| 35 to 39 Minutes | 18 (10.6%) | 9 (3.3%) |
| 40 to 44 Minutes | 14 (8.3%) | 15 (5.6%) |
| 45 to 59 Minutes | 40 (23.7%) | 8 (3.0%) |
| 60 to 89 Minutes | 0 (0.0%) | 8 (3.0%) |
| 90 or more Minutes | 9 (5.3%) | 0 (0.0%) |
Time of Departure to Work by Sex in Peabody
The most frequent times of departure to work in Peabody are 12:00 AM to 4:59 AM (43, 25.4%) for males and 12:00 AM to 4:59 AM (53, 19.6%) for females.
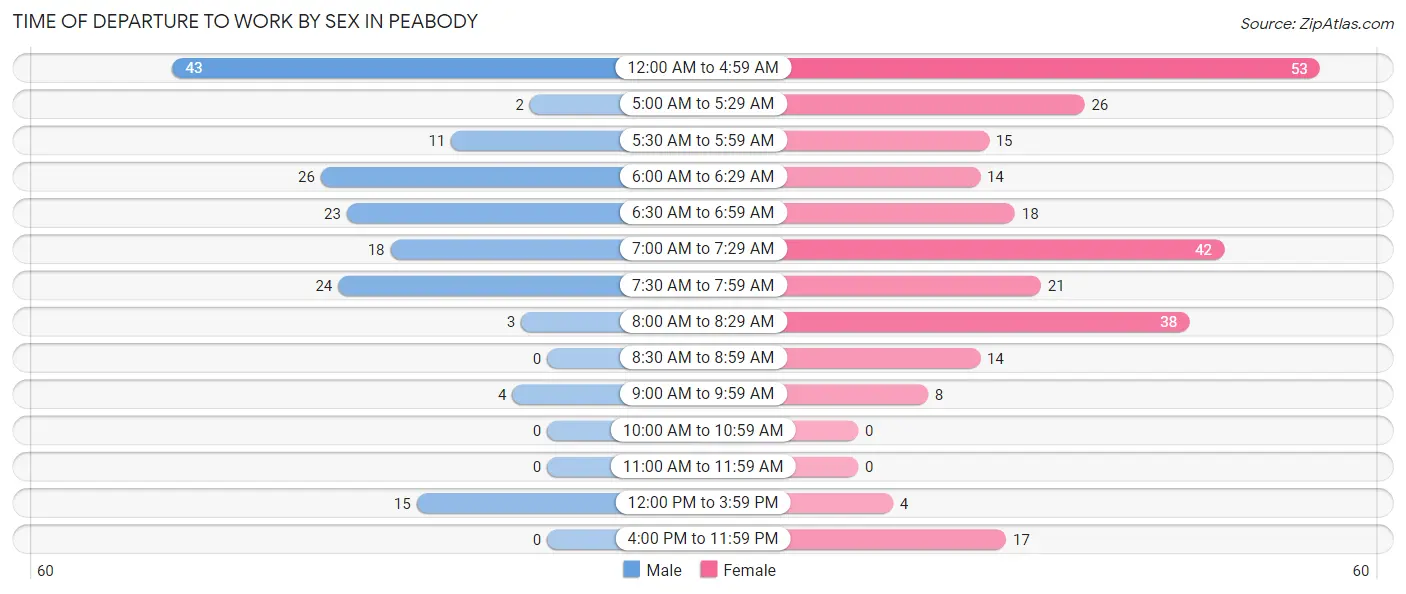
| Time of Departure | Male | Female |
| 12:00 AM to 4:59 AM | 43 (25.4%) | 53 (19.6%) |
| 5:00 AM to 5:29 AM | 2 (1.2%) | 26 (9.6%) |
| 5:30 AM to 5:59 AM | 11 (6.5%) | 15 (5.6%) |
| 6:00 AM to 6:29 AM | 26 (15.4%) | 14 (5.2%) |
| 6:30 AM to 6:59 AM | 23 (13.6%) | 18 (6.7%) |
| 7:00 AM to 7:29 AM | 18 (10.6%) | 42 (15.6%) |
| 7:30 AM to 7:59 AM | 24 (14.2%) | 21 (7.8%) |
| 8:00 AM to 8:29 AM | 3 (1.8%) | 38 (14.1%) |
| 8:30 AM to 8:59 AM | 0 (0.0%) | 14 (5.2%) |
| 9:00 AM to 9:59 AM | 4 (2.4%) | 8 (3.0%) |
| 10:00 AM to 10:59 AM | 0 (0.0%) | 0 (0.0%) |
| 11:00 AM to 11:59 AM | 0 (0.0%) | 0 (0.0%) |
| 12:00 PM to 3:59 PM | 15 (8.9%) | 4 (1.5%) |
| 4:00 PM to 11:59 PM | 0 (0.0%) | 17 (6.3%) |
| Total | 169 (100.0%) | 270 (100.0%) |
Housing Occupancy in Peabody
Occupancy by Ownership in Peabody
Of the total 423 dwellings in Peabody, owner-occupied units account for 345 (81.6%), while renter-occupied units make up 78 (18.4%).
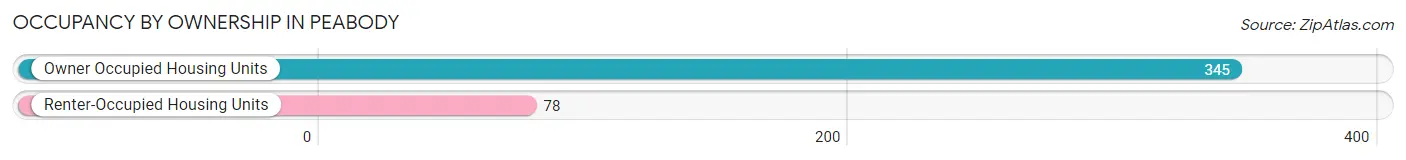
| Occupancy | # Housing Units | % Housing Units |
| Owner Occupied Housing Units | 345 | 81.6% |
| Renter-Occupied Housing Units | 78 | 18.4% |
| Total Occupied Housing Units | 423 | 100.0% |
Occupancy by Household Size in Peabody
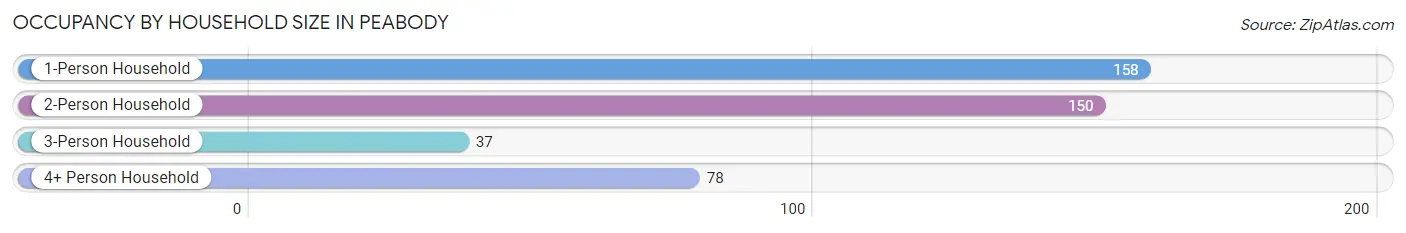
| Household Size | # Housing Units | % Housing Units |
| 1-Person Household | 158 | 37.3% |
| 2-Person Household | 150 | 35.5% |
| 3-Person Household | 37 | 8.7% |
| 4+ Person Household | 78 | 18.4% |
| Total Housing Units | 423 | 100.0% |
Occupancy by Ownership by Household Size in Peabody
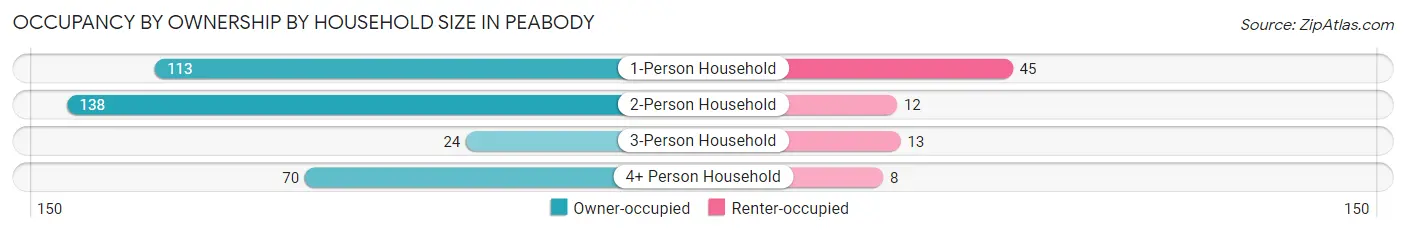
| Household Size | Owner-occupied | Renter-occupied |
| 1-Person Household | 113 (71.5%) | 45 (28.5%) |
| 2-Person Household | 138 (92.0%) | 12 (8.0%) |
| 3-Person Household | 24 (64.9%) | 13 (35.1%) |
| 4+ Person Household | 70 (89.7%) | 8 (10.3%) |
| Total Housing Units | 345 (81.6%) | 78 (18.4%) |
Occupancy by Educational Attainment in Peabody
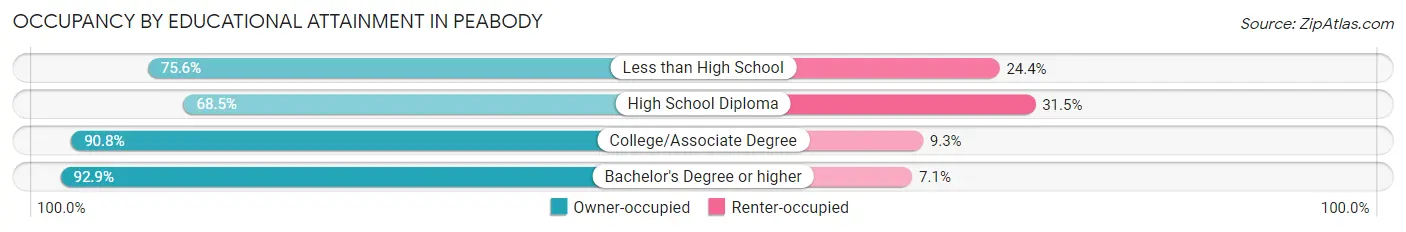
| Household Size | Owner-occupied | Renter-occupied |
| Less than High School | 34 (75.6%) | 11 (24.4%) |
| High School Diploma | 102 (68.5%) | 47 (31.5%) |
| College/Associate Degree | 157 (90.7%) | 16 (9.2%) |
| Bachelor's Degree or higher | 52 (92.9%) | 4 (7.1%) |
Occupancy by Age of Householder in Peabody
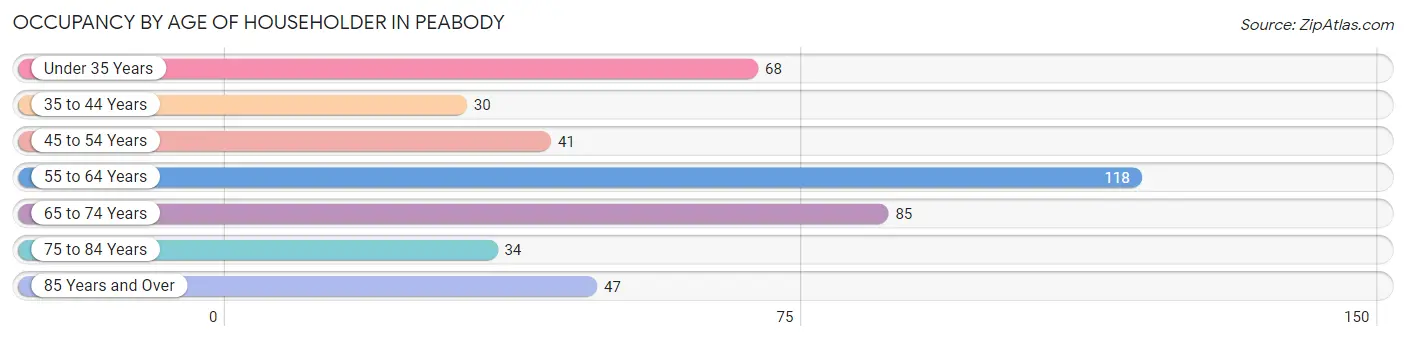
| Age Bracket | # Households | % Households |
| Under 35 Years | 68 | 16.1% |
| 35 to 44 Years | 30 | 7.1% |
| 45 to 54 Years | 41 | 9.7% |
| 55 to 64 Years | 118 | 27.9% |
| 65 to 74 Years | 85 | 20.1% |
| 75 to 84 Years | 34 | 8.0% |
| 85 Years and Over | 47 | 11.1% |
| Total | 423 | 100.0% |
Housing Finances in Peabody
Median Income by Occupancy in Peabody
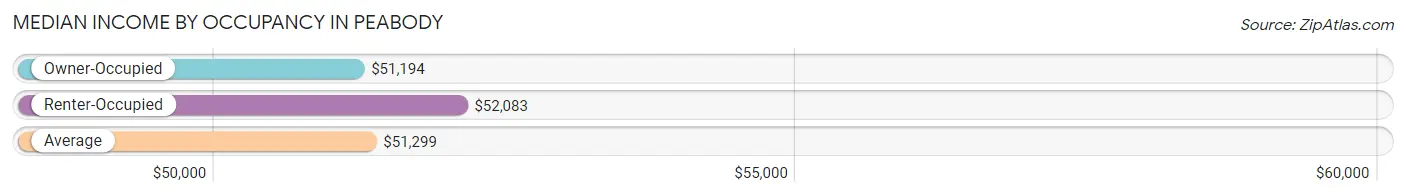
| Occupancy Type | # Households | Median Income |
| Owner-Occupied | 345 (81.6%) | $51,194 |
| Renter-Occupied | 78 (18.4%) | $52,083 |
| Average | 423 (100.0%) | $51,299 |
Occupancy by Householder Income Bracket in Peabody
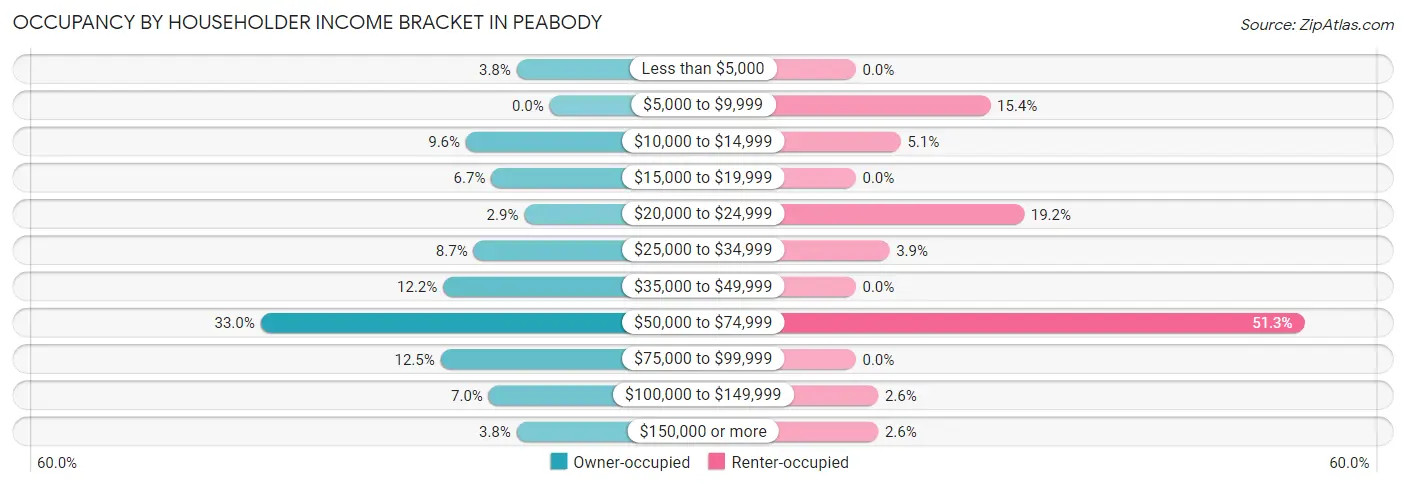
| Income Bracket | Owner-occupied | Renter-occupied |
| Less than $5,000 | 13 (3.8%) | 0 (0.0%) |
| $5,000 to $9,999 | 0 (0.0%) | 12 (15.4%) |
| $10,000 to $14,999 | 33 (9.6%) | 4 (5.1%) |
| $15,000 to $19,999 | 23 (6.7%) | 0 (0.0%) |
| $20,000 to $24,999 | 10 (2.9%) | 15 (19.2%) |
| $25,000 to $34,999 | 30 (8.7%) | 3 (3.8%) |
| $35,000 to $49,999 | 42 (12.2%) | 0 (0.0%) |
| $50,000 to $74,999 | 114 (33.0%) | 40 (51.3%) |
| $75,000 to $99,999 | 43 (12.5%) | 0 (0.0%) |
| $100,000 to $149,999 | 24 (7.0%) | 2 (2.6%) |
| $150,000 or more | 13 (3.8%) | 2 (2.6%) |
| Total | 345 (100.0%) | 78 (100.0%) |
Monthly Housing Cost Tiers in Peabody
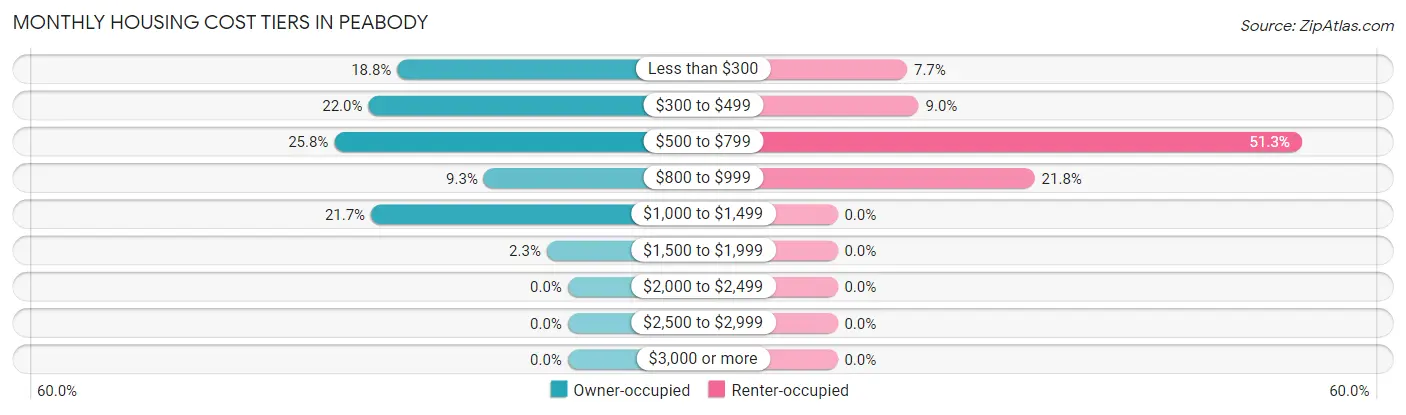
| Monthly Cost | Owner-occupied | Renter-occupied |
| Less than $300 | 65 (18.8%) | 6 (7.7%) |
| $300 to $499 | 76 (22.0%) | 7 (9.0%) |
| $500 to $799 | 89 (25.8%) | 40 (51.3%) |
| $800 to $999 | 32 (9.3%) | 17 (21.8%) |
| $1,000 to $1,499 | 75 (21.7%) | 0 (0.0%) |
| $1,500 to $1,999 | 8 (2.3%) | 0 (0.0%) |
| $2,000 to $2,499 | 0 (0.0%) | 0 (0.0%) |
| $2,500 to $2,999 | 0 (0.0%) | 0 (0.0%) |
| $3,000 or more | 0 (0.0%) | 0 (0.0%) |
| Total | 345 (100.0%) | 78 (100.0%) |
Physical Housing Characteristics in Peabody
Housing Structures in Peabody
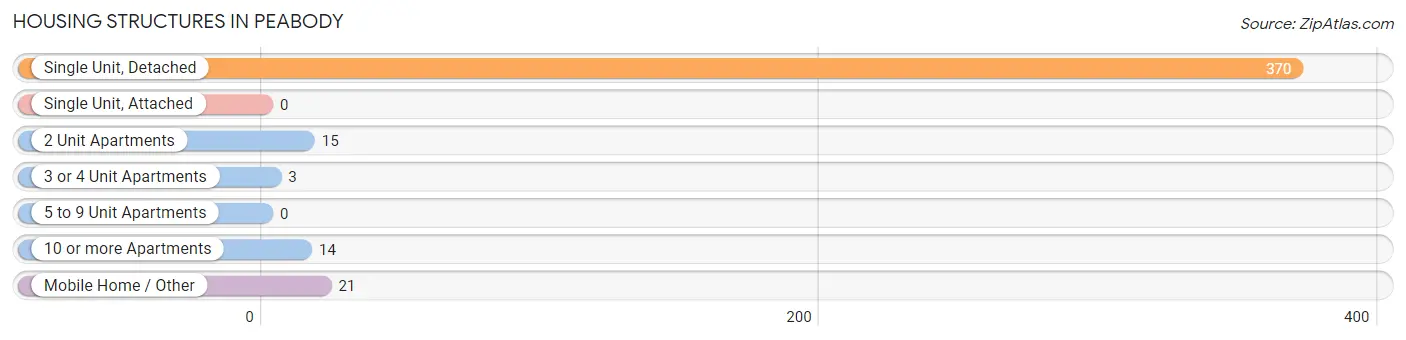
| Structure Type | # Housing Units | % Housing Units |
| Single Unit, Detached | 370 | 87.5% |
| Single Unit, Attached | 0 | 0.0% |
| 2 Unit Apartments | 15 | 3.5% |
| 3 or 4 Unit Apartments | 3 | 0.7% |
| 5 to 9 Unit Apartments | 0 | 0.0% |
| 10 or more Apartments | 14 | 3.3% |
| Mobile Home / Other | 21 | 5.0% |
| Total | 423 | 100.0% |
Housing Structures by Occupancy in Peabody
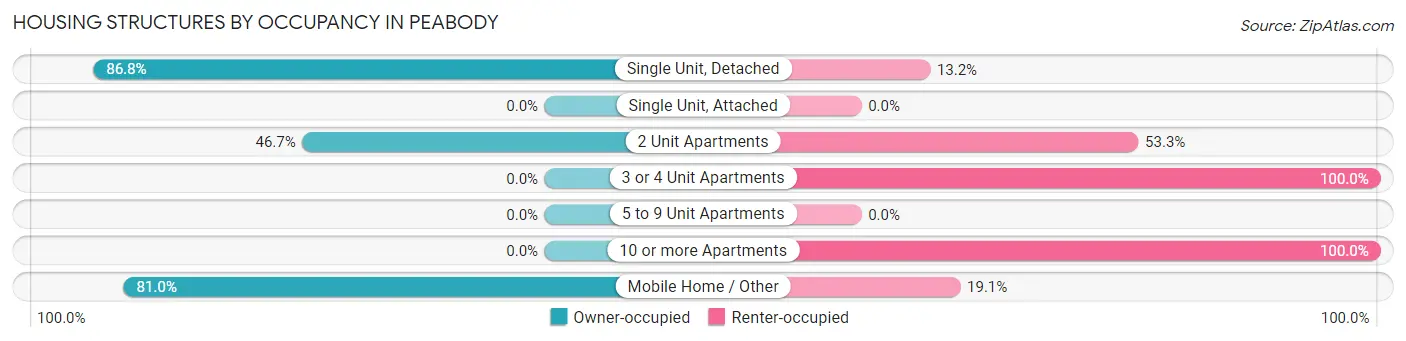
| Structure Type | Owner-occupied | Renter-occupied |
| Single Unit, Detached | 321 (86.8%) | 49 (13.2%) |
| Single Unit, Attached | 0 (0.0%) | 0 (0.0%) |
| 2 Unit Apartments | 7 (46.7%) | 8 (53.3%) |
| 3 or 4 Unit Apartments | 0 (0.0%) | 3 (100.0%) |
| 5 to 9 Unit Apartments | 0 (0.0%) | 0 (0.0%) |
| 10 or more Apartments | 0 (0.0%) | 14 (100.0%) |
| Mobile Home / Other | 17 (80.9%) | 4 (19.1%) |
| Total | 345 (81.6%) | 78 (18.4%) |
Housing Structures by Number of Rooms in Peabody
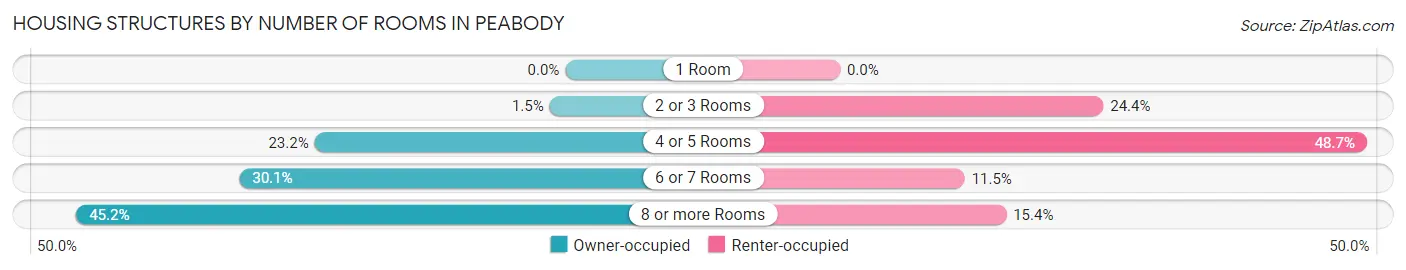
| Number of Rooms | Owner-occupied | Renter-occupied |
| 1 Room | 0 (0.0%) | 0 (0.0%) |
| 2 or 3 Rooms | 5 (1.5%) | 19 (24.4%) |
| 4 or 5 Rooms | 80 (23.2%) | 38 (48.7%) |
| 6 or 7 Rooms | 104 (30.1%) | 9 (11.5%) |
| 8 or more Rooms | 156 (45.2%) | 12 (15.4%) |
| Total | 345 (100.0%) | 78 (100.0%) |
Housing Structure by Heating Type in Peabody
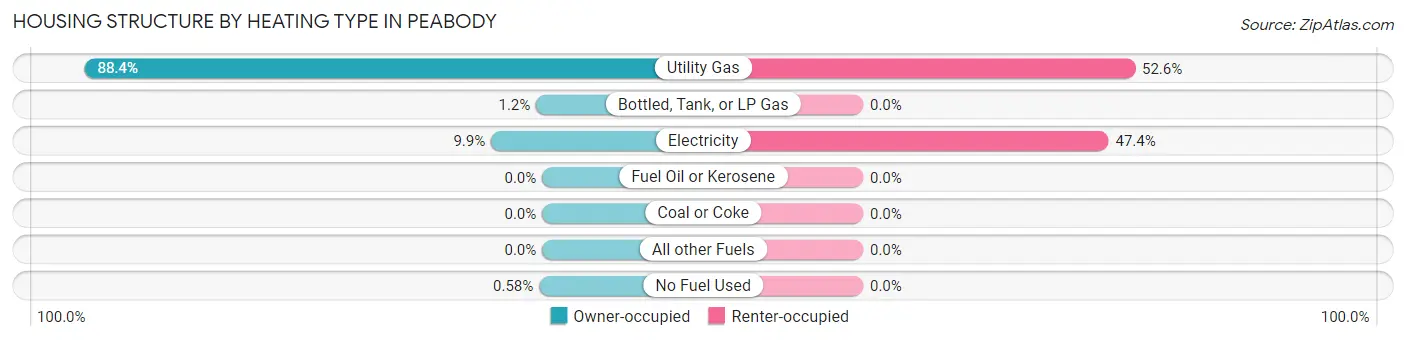
| Heating Type | Owner-occupied | Renter-occupied |
| Utility Gas | 305 (88.4%) | 41 (52.6%) |
| Bottled, Tank, or LP Gas | 4 (1.2%) | 0 (0.0%) |
| Electricity | 34 (9.9%) | 37 (47.4%) |
| Fuel Oil or Kerosene | 0 (0.0%) | 0 (0.0%) |
| Coal or Coke | 0 (0.0%) | 0 (0.0%) |
| All other Fuels | 0 (0.0%) | 0 (0.0%) |
| No Fuel Used | 2 (0.6%) | 0 (0.0%) |
| Total | 345 (100.0%) | 78 (100.0%) |
Household Vehicle Usage in Peabody
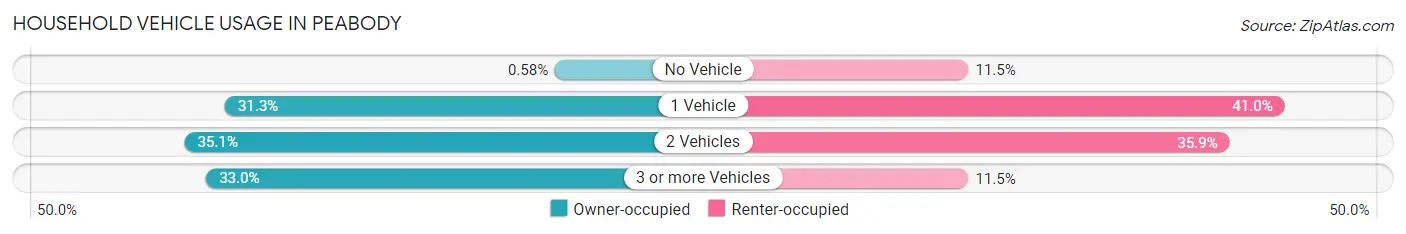
| Vehicles per Household | Owner-occupied | Renter-occupied |
| No Vehicle | 2 (0.6%) | 9 (11.5%) |
| 1 Vehicle | 108 (31.3%) | 32 (41.0%) |
| 2 Vehicles | 121 (35.1%) | 28 (35.9%) |
| 3 or more Vehicles | 114 (33.0%) | 9 (11.5%) |
| Total | 345 (100.0%) | 78 (100.0%) |
Real Estate & Mortgages in Peabody
Real Estate and Mortgage Overview in Peabody
| Characteristic | Without Mortgage | With Mortgage |
| Housing Units | 200 | 145 |
| Median Property Value | $72,200 | $75,600 |
| Median Household Income | $42,000 | $13 |
| Monthly Housing Costs | $387 | $0 |
| Real Estate Taxes | $972 | $0 |
Property Value by Mortgage Status in Peabody
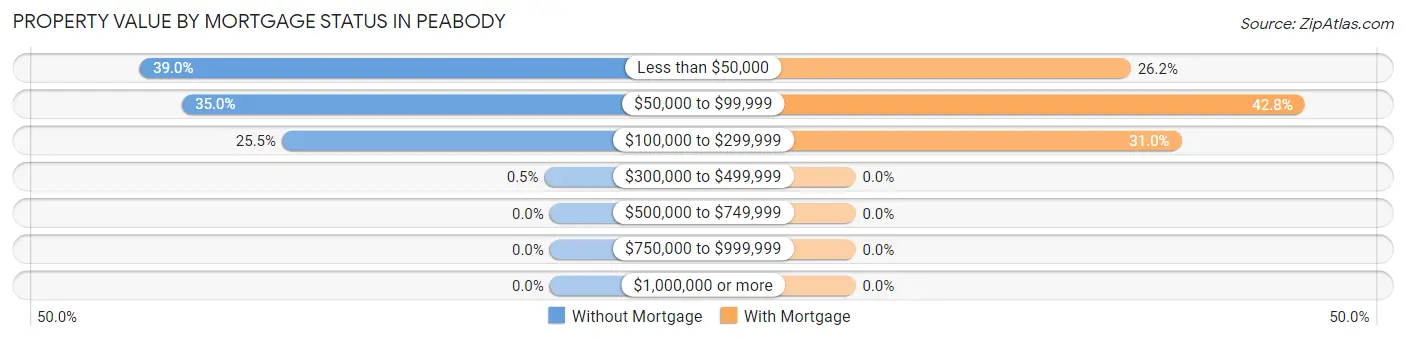
| Property Value | Without Mortgage | With Mortgage |
| Less than $50,000 | 78 (39.0%) | 38 (26.2%) |
| $50,000 to $99,999 | 70 (35.0%) | 62 (42.8%) |
| $100,000 to $299,999 | 51 (25.5%) | 45 (31.0%) |
| $300,000 to $499,999 | 1 (0.5%) | 0 (0.0%) |
| $500,000 to $749,999 | 0 (0.0%) | 0 (0.0%) |
| $750,000 to $999,999 | 0 (0.0%) | 0 (0.0%) |
| $1,000,000 or more | 0 (0.0%) | 0 (0.0%) |
| Total | 200 (100.0%) | 145 (100.0%) |
Household Income by Mortgage Status in Peabody
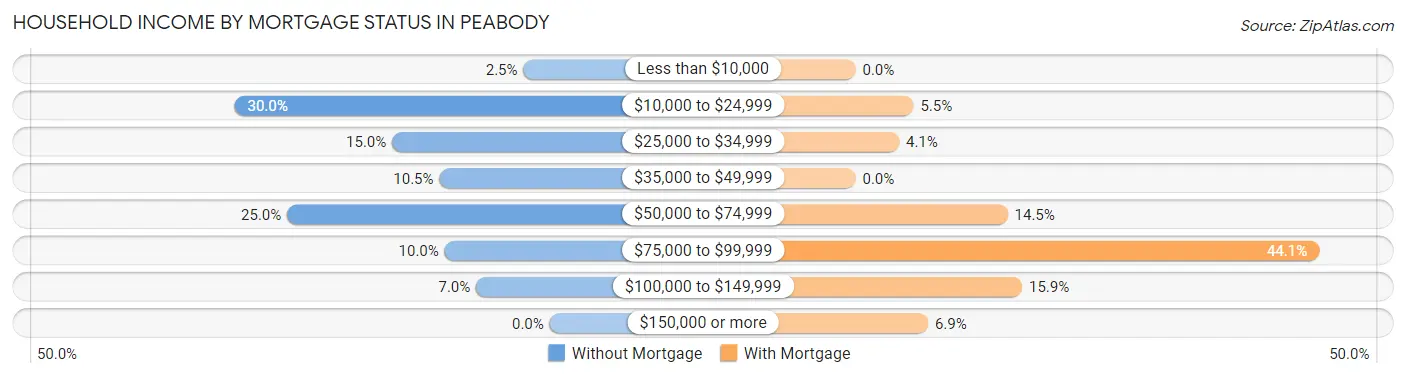
| Household Income | Without Mortgage | With Mortgage |
| Less than $10,000 | 5 (2.5%) | 0 (0.0%) |
| $10,000 to $24,999 | 60 (30.0%) | 8 (5.5%) |
| $25,000 to $34,999 | 30 (15.0%) | 6 (4.1%) |
| $35,000 to $49,999 | 21 (10.5%) | 0 (0.0%) |
| $50,000 to $74,999 | 50 (25.0%) | 21 (14.5%) |
| $75,000 to $99,999 | 20 (10.0%) | 64 (44.1%) |
| $100,000 to $149,999 | 14 (7.0%) | 23 (15.9%) |
| $150,000 or more | 0 (0.0%) | 10 (6.9%) |
| Total | 200 (100.0%) | 145 (100.0%) |
Property Value to Household Income Ratio in Peabody
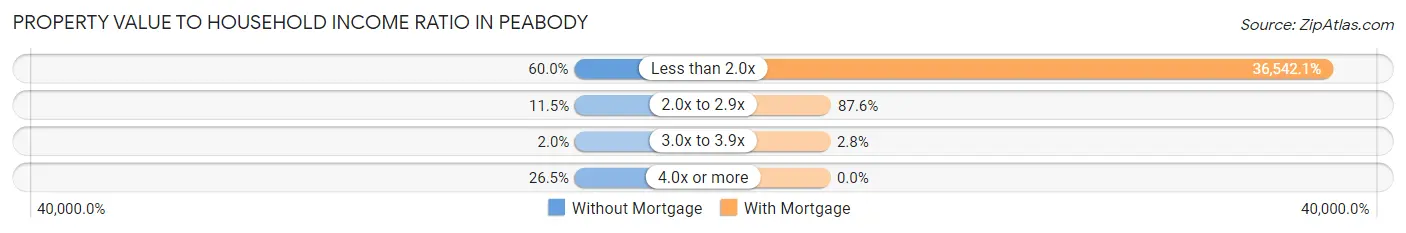
| Value-to-Income Ratio | Without Mortgage | With Mortgage |
| Less than 2.0x | 120 (60.0%) | 52,986 (36,542.1%) |
| 2.0x to 2.9x | 23 (11.5%) | 127 (87.6%) |
| 3.0x to 3.9x | 4 (2.0%) | 4 (2.8%) |
| 4.0x or more | 53 (26.5%) | 0 (0.0%) |
| Total | 200 (100.0%) | 145 (100.0%) |
Real Estate Taxes by Mortgage Status in Peabody
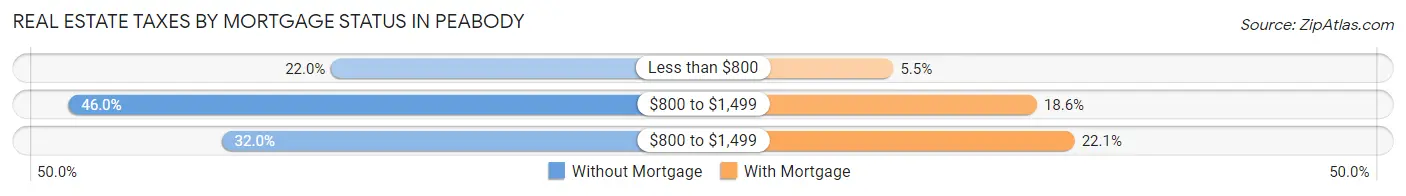
| Property Taxes | Without Mortgage | With Mortgage |
| Less than $800 | 44 (22.0%) | 8 (5.5%) |
| $800 to $1,499 | 92 (46.0%) | 27 (18.6%) |
| $800 to $1,499 | 64 (32.0%) | 32 (22.1%) |
| Total | 200 (100.0%) | 145 (100.0%) |
Health & Disability in Peabody
Health Insurance Coverage by Age in Peabody
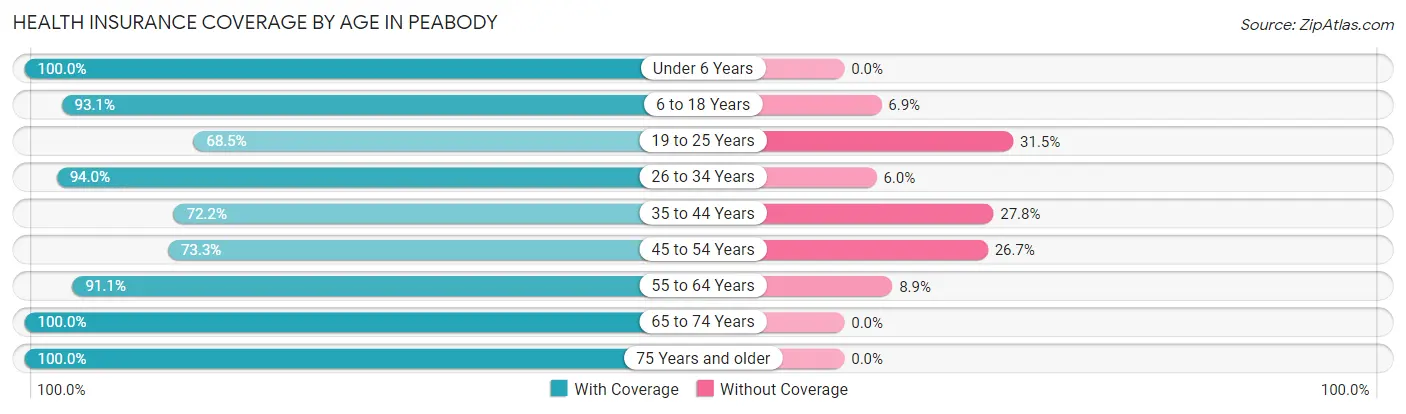
| Age Bracket | With Coverage | Without Coverage |
| Under 6 Years | 98 (100.0%) | 0 (0.0%) |
| 6 to 18 Years | 175 (93.1%) | 13 (6.9%) |
| 19 to 25 Years | 74 (68.5%) | 34 (31.5%) |
| 26 to 34 Years | 141 (94.0%) | 9 (6.0%) |
| 35 to 44 Years | 52 (72.2%) | 20 (27.8%) |
| 45 to 54 Years | 63 (73.3%) | 23 (26.7%) |
| 55 to 64 Years | 163 (91.1%) | 16 (8.9%) |
| 65 to 74 Years | 118 (100.0%) | 0 (0.0%) |
| 75 Years and older | 133 (100.0%) | 0 (0.0%) |
| Total | 1,017 (89.8%) | 115 (10.2%) |
Health Insurance Coverage by Citizenship Status in Peabody
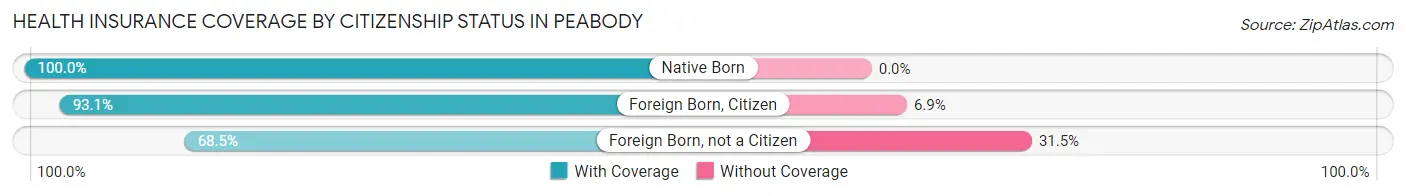
| Citizenship Status | With Coverage | Without Coverage |
| Native Born | 98 (100.0%) | 0 (0.0%) |
| Foreign Born, Citizen | 175 (93.1%) | 13 (6.9%) |
| Foreign Born, not a Citizen | 74 (68.5%) | 34 (31.5%) |
Health Insurance Coverage by Household Income in Peabody
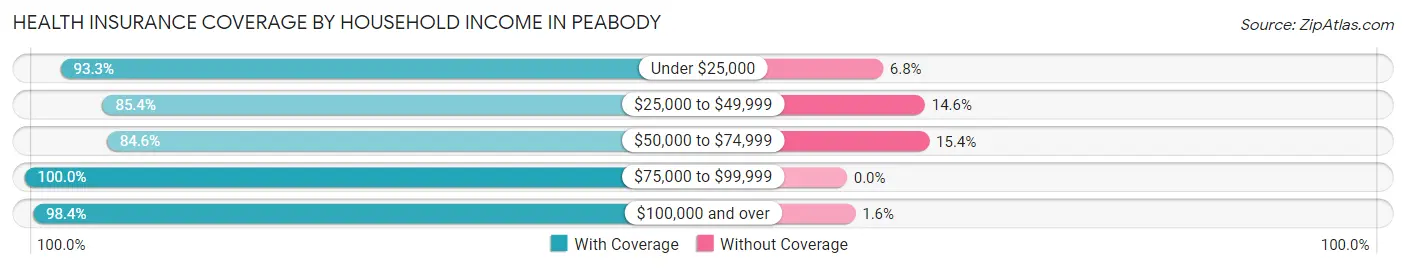
| Household Income | With Coverage | Without Coverage |
| Under $25,000 | 152 (93.2%) | 11 (6.8%) |
| $25,000 to $49,999 | 152 (85.4%) | 26 (14.6%) |
| $50,000 to $74,999 | 417 (84.6%) | 76 (15.4%) |
| $75,000 to $99,999 | 172 (100.0%) | 0 (0.0%) |
| $100,000 and over | 124 (98.4%) | 2 (1.6%) |
Public vs Private Health Insurance Coverage by Age in Peabody
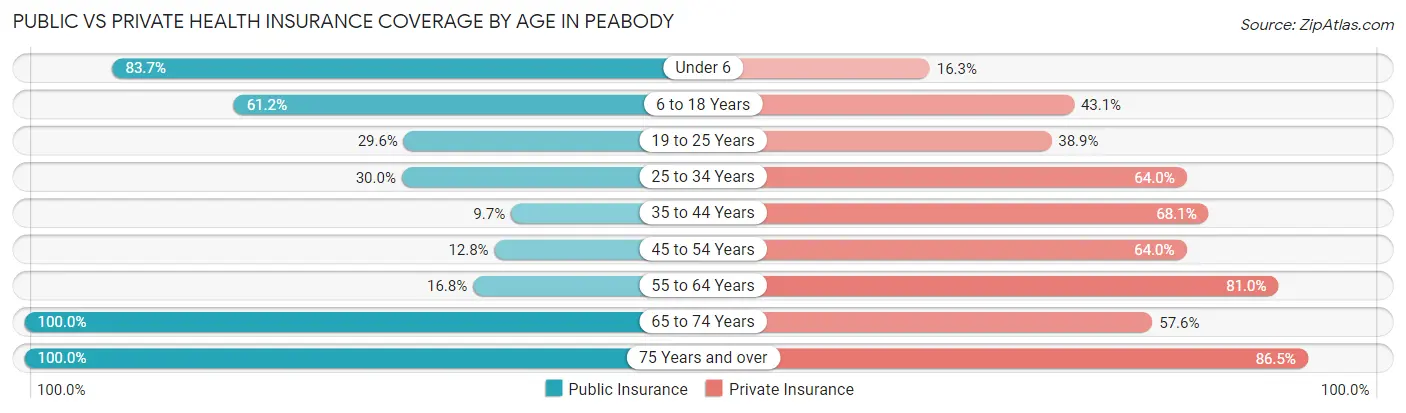
| Age Bracket | Public Insurance | Private Insurance |
| Under 6 | 82 (83.7%) | 16 (16.3%) |
| 6 to 18 Years | 115 (61.2%) | 81 (43.1%) |
| 19 to 25 Years | 32 (29.6%) | 42 (38.9%) |
| 25 to 34 Years | 45 (30.0%) | 96 (64.0%) |
| 35 to 44 Years | 7 (9.7%) | 49 (68.1%) |
| 45 to 54 Years | 11 (12.8%) | 55 (63.9%) |
| 55 to 64 Years | 30 (16.8%) | 145 (81.0%) |
| 65 to 74 Years | 118 (100.0%) | 68 (57.6%) |
| 75 Years and over | 133 (100.0%) | 115 (86.5%) |
| Total | 573 (50.6%) | 667 (58.9%) |
Disability Status by Sex by Age in Peabody
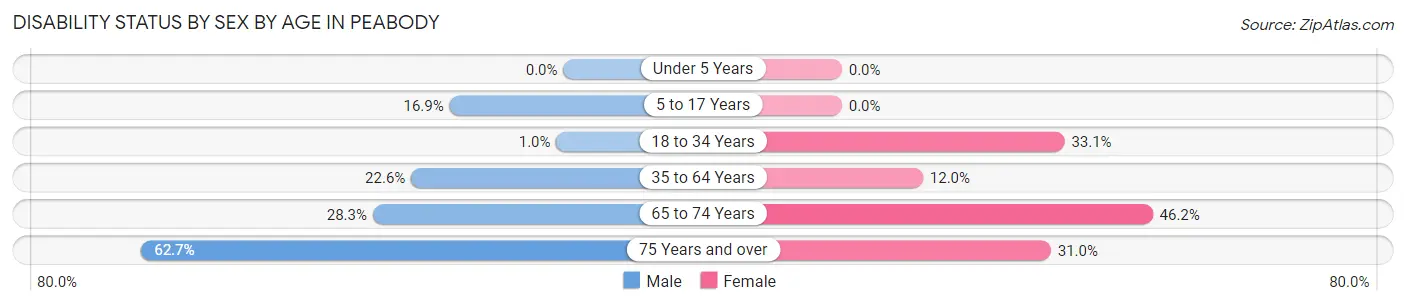
| Age Bracket | Male | Female |
| Under 5 Years | 0 (0.0%) | 0 (0.0%) |
| 5 to 17 Years | 12 (16.9%) | 0 (0.0%) |
| 18 to 34 Years | 2 (1.0%) | 40 (33.1%) |
| 35 to 64 Years | 33 (22.6%) | 23 (12.0%) |
| 65 to 74 Years | 15 (28.3%) | 30 (46.2%) |
| 75 Years and over | 47 (62.7%) | 18 (31.0%) |
Disability Class by Sex by Age in Peabody
Disability Class: Hearing Difficulty
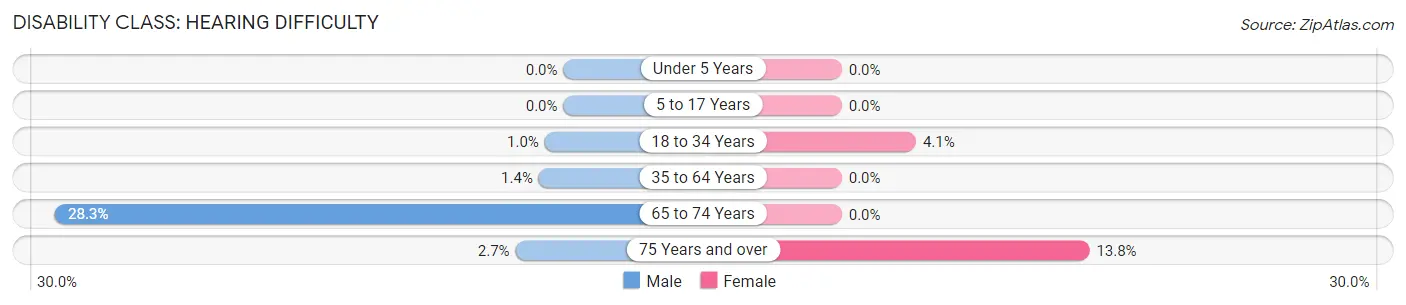
| Age Bracket | Male | Female |
| Under 5 Years | 0 (0.0%) | 0 (0.0%) |
| 5 to 17 Years | 0 (0.0%) | 0 (0.0%) |
| 18 to 34 Years | 2 (1.0%) | 5 (4.1%) |
| 35 to 64 Years | 2 (1.4%) | 0 (0.0%) |
| 65 to 74 Years | 15 (28.3%) | 0 (0.0%) |
| 75 Years and over | 2 (2.7%) | 8 (13.8%) |
Disability Class: Vision Difficulty
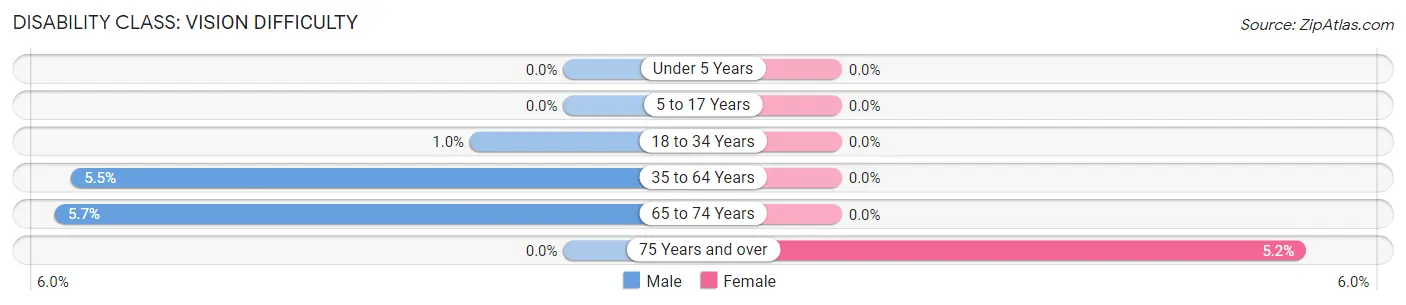
| Age Bracket | Male | Female |
| Under 5 Years | 0 (0.0%) | 0 (0.0%) |
| 5 to 17 Years | 0 (0.0%) | 0 (0.0%) |
| 18 to 34 Years | 2 (1.0%) | 0 (0.0%) |
| 35 to 64 Years | 8 (5.5%) | 0 (0.0%) |
| 65 to 74 Years | 3 (5.7%) | 0 (0.0%) |
| 75 Years and over | 0 (0.0%) | 3 (5.2%) |
Disability Class: Cognitive Difficulty
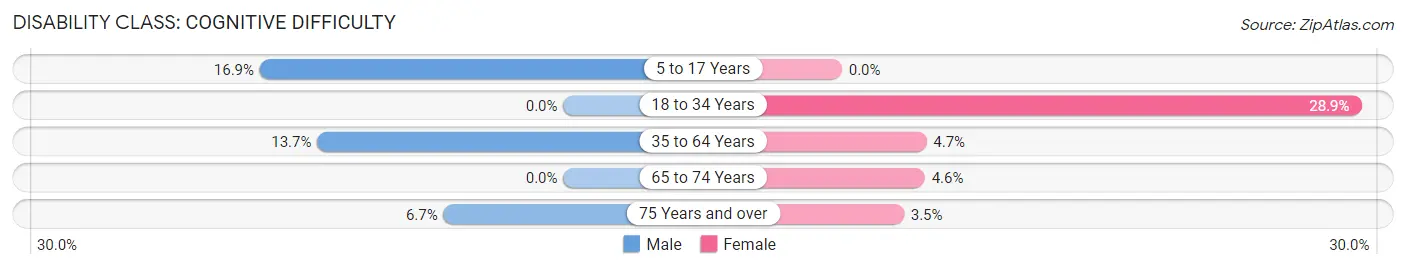
| Age Bracket | Male | Female |
| 5 to 17 Years | 12 (16.9%) | 0 (0.0%) |
| 18 to 34 Years | 0 (0.0%) | 35 (28.9%) |
| 35 to 64 Years | 20 (13.7%) | 9 (4.7%) |
| 65 to 74 Years | 0 (0.0%) | 3 (4.6%) |
| 75 Years and over | 5 (6.7%) | 2 (3.5%) |
Disability Class: Ambulatory Difficulty
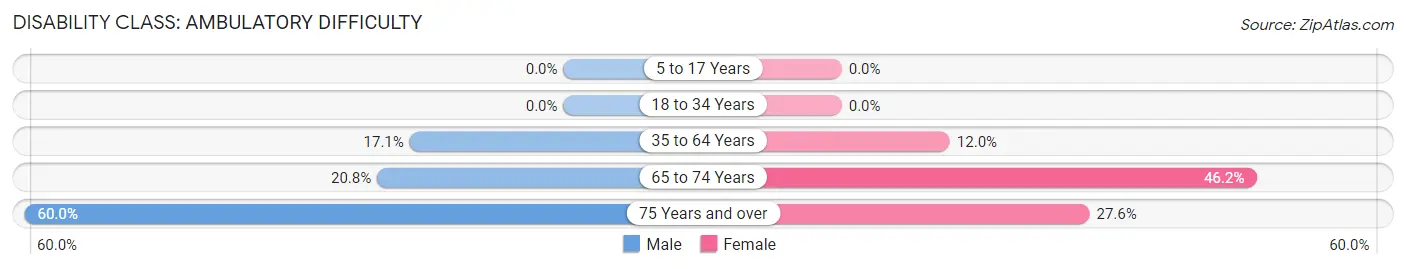
| Age Bracket | Male | Female |
| 5 to 17 Years | 0 (0.0%) | 0 (0.0%) |
| 18 to 34 Years | 0 (0.0%) | 0 (0.0%) |
| 35 to 64 Years | 25 (17.1%) | 23 (12.0%) |
| 65 to 74 Years | 11 (20.7%) | 30 (46.2%) |
| 75 Years and over | 45 (60.0%) | 16 (27.6%) |
Disability Class: Self-Care Difficulty
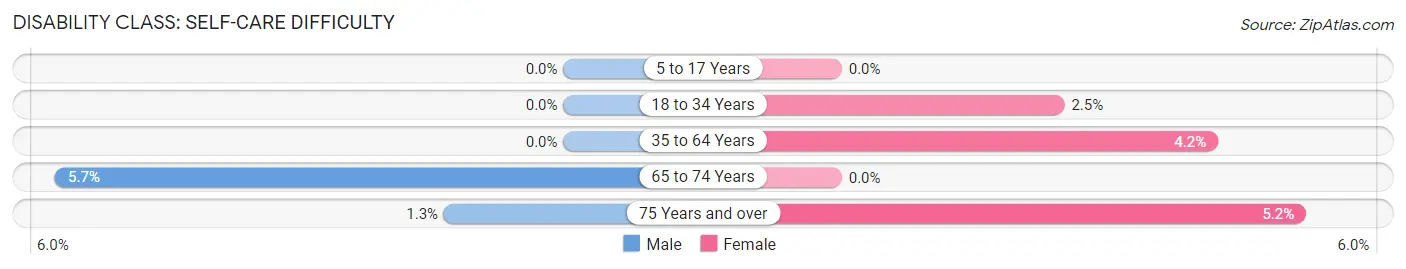
| Age Bracket | Male | Female |
| 5 to 17 Years | 0 (0.0%) | 0 (0.0%) |
| 18 to 34 Years | 0 (0.0%) | 3 (2.5%) |
| 35 to 64 Years | 0 (0.0%) | 8 (4.2%) |
| 65 to 74 Years | 3 (5.7%) | 0 (0.0%) |
| 75 Years and over | 1 (1.3%) | 3 (5.2%) |
Technology Access in Peabody
Computing Device Access in Peabody
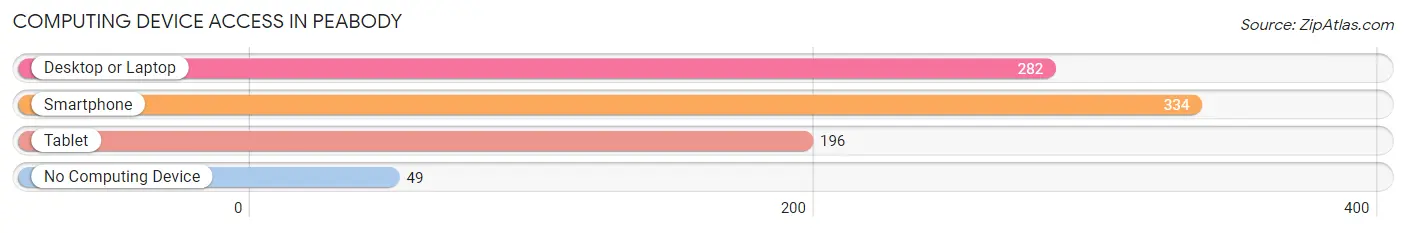
| Device Type | # Households | % Households |
| Desktop or Laptop | 282 | 66.7% |
| Smartphone | 334 | 79.0% |
| Tablet | 196 | 46.3% |
| No Computing Device | 49 | 11.6% |
| Total | 423 | 100.0% |
Internet Access in Peabody
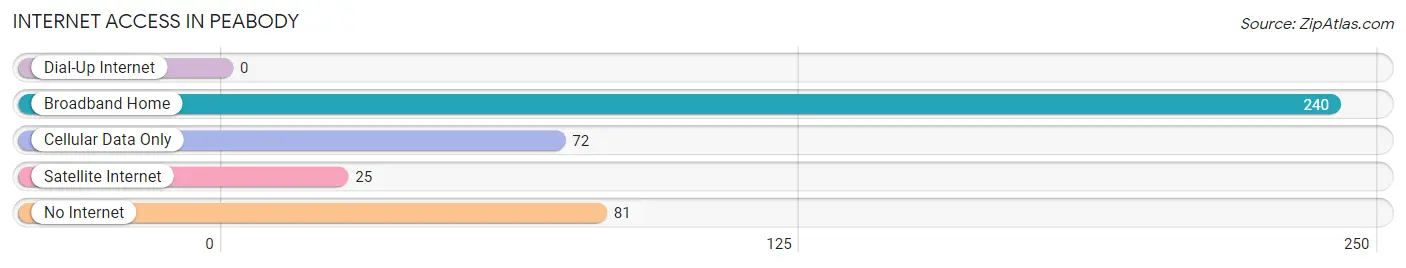
| Internet Type | # Households | % Households |
| Dial-Up Internet | 0 | 0.0% |
| Broadband Home | 240 | 56.7% |
| Cellular Data Only | 72 | 17.0% |
| Satellite Internet | 25 | 5.9% |
| No Internet | 81 | 19.2% |
| Total | 423 | 100.0% |
Peabody Summary
Peabody, Kansas is a small town located in Marion County, Kansas. It is situated in the Flint Hills region of the state, and is home to a population of 1,719 people as of the 2010 census. The town was founded in 1871 and was named after the Peabody Coal Company, which was a major employer in the area at the time.
History
Peabody was founded in 1871 by a group of settlers from Ohio. The town was named after the Peabody Coal Company, which was a major employer in the area at the time. The town was incorporated in 1887 and was home to a variety of businesses, including a flour mill, a creamery, a bank, and a hotel.
In the early 1900s, the town experienced a period of growth and prosperity. The population increased from 545 in 1900 to 1,072 in 1910. The town was home to a variety of businesses, including a newspaper, a bank, a hotel, a creamery, a flour mill, and a variety of other stores.
The town experienced a period of decline in the mid-1900s, as the coal industry began to decline and the population began to decrease. The population dropped to 845 in 1960 and continued to decline until the 2010 census, when it was recorded at 1,719.
Geography
Peabody is located in Marion County, Kansas, in the Flint Hills region of the state. The town is situated at an elevation of 1,072 feet above sea level. The town is located at the intersection of U.S. Route 50 and Kansas Highway 99.
The town is located in a rural area, and is surrounded by rolling hills and farmland. The nearest major city is Wichita, which is located approximately 50 miles to the south.
Economy
The economy of Peabody is largely based on agriculture and tourism. The town is home to a variety of businesses, including a bank, a hotel, a newspaper, a variety of stores, and a variety of restaurants.
The town is also home to a variety of agricultural businesses, including a feed mill, a grain elevator, and a variety of other agricultural businesses. The town is also home to a variety of tourist attractions, including a museum, a golf course, and a variety of other attractions.
Demographics
As of the 2010 census, the population of Peabody was 1,719. The racial makeup of the town was 95.3% White, 0.7% African American, 0.3% Native American, 0.2% Asian, 0.1% Pacific Islander, 1.2% from other races, and 2.4% from two or more races. Hispanic or Latino of any race were 3.2% of the population.
The median household income in Peabody was $41,250, and the median family income was $48,750. The per capita income for the town was $19,945. About 11.2% of families and 13.2% of the population were below the poverty line, including 17.2% of those under age 18 and 8.2% of those age 65 or over.
Common Questions
What is Per Capita Income in Peabody?
Per Capita income in Peabody is $21,043.
What is the Median Family Income in Peabody?
Median Family Income in Peabody is $53,750.
What is the Median Household income in Peabody?
Median Household Income in Peabody is $51,299.
What is Income or Wage Gap in Peabody?
Income or Wage Gap in Peabody is 4.5%.
Women in Peabody earn 95.5 cents for every dollar earned by a man.
What is Family Income Deficit in Peabody?
Family Income Deficit in Peabody is $3,911.
Families that are below poverty line in Peabody earn $3,911 less on average than the poverty threshold level.
What is Inequality or Gini Index in Peabody?
Inequality or Gini Index in Peabody is 0.37.
What is the Total Population of Peabody?
Total Population of Peabody is 1,259.
What is the Total Male Population of Peabody?
Total Male Population of Peabody is 599.
What is the Total Female Population of Peabody?
Total Female Population of Peabody is 660.
What is the Ratio of Males per 100 Females in Peabody?
There are 90.76 Males per 100 Females in Peabody.
What is the Ratio of Females per 100 Males in Peabody?
There are 110.18 Females per 100 Males in Peabody.
What is the Median Population Age in Peabody?
Median Population Age in Peabody is 42.9 Years.
What is the Average Family Size in Peabody
Average Family Size in Peabody is 3.5 People.
What is the Average Household Size in Peabody
Average Household Size in Peabody is 2.7 People.
How Large is the Labor Force in Peabody?
There are 541 People in the Labor Forcein in Peabody.
What is the Percentage of People in the Labor Force in Peabody?
51.3% of People are in the Labor Force in Peabody.
What is the Unemployment Rate in Peabody?
Unemployment Rate in Peabody is 12.2%.