Oberlin, KS Map & Demographics
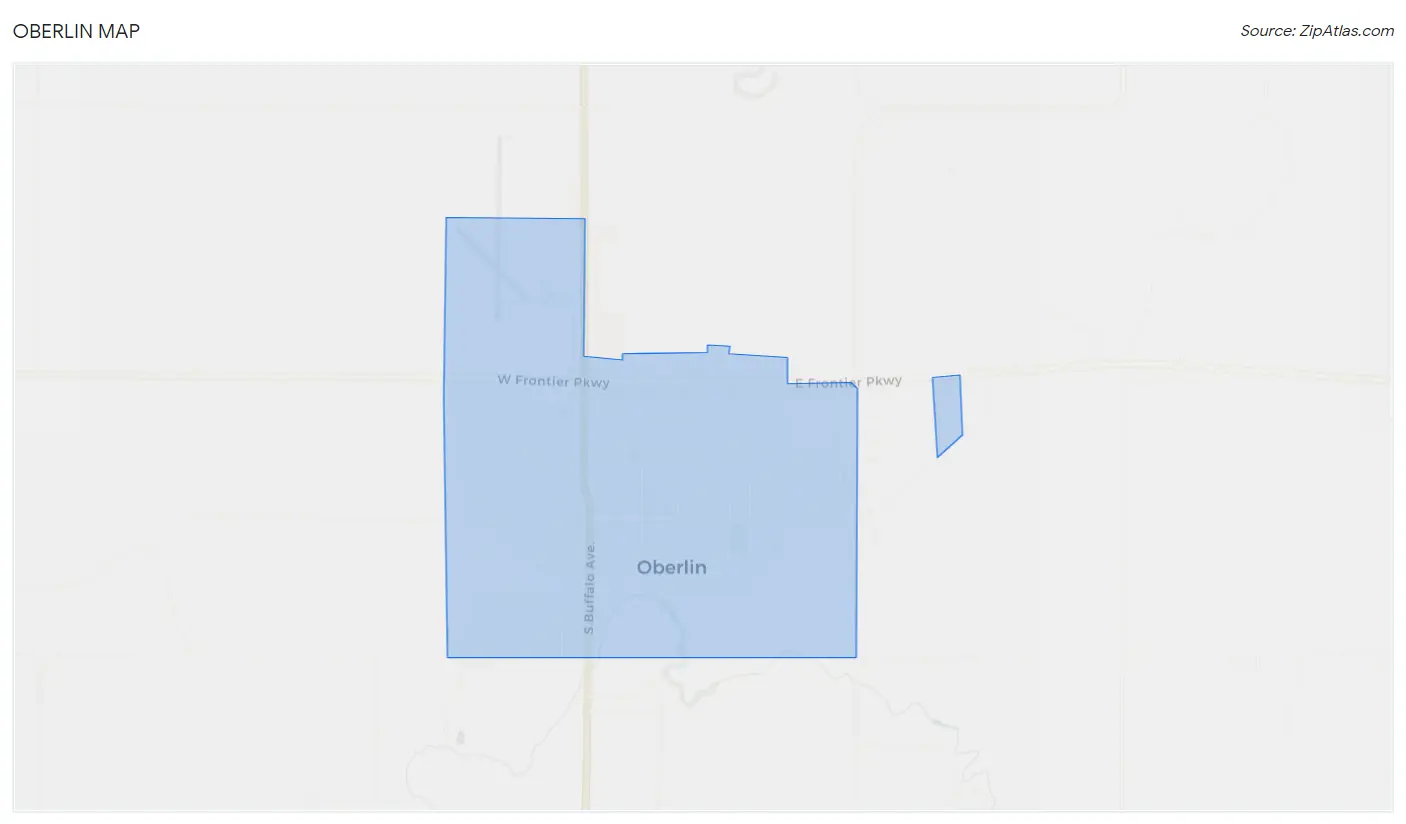
Oberlin Map
Oberlin Overview
$29,689
PER CAPITA INCOME
$53,571
AVG FAMILY INCOME
$40,735
AVG HOUSEHOLD INCOME
40.8%
WAGE / INCOME GAP [ % ]
59.2¢/ $1
WAGE / INCOME GAP [ $ ]
0.41
INEQUALITY / GINI INDEX
1,629
TOTAL POPULATION
809
MALE POPULATION
820
FEMALE POPULATION
98.66
MALES / 100 FEMALES
101.36
FEMALES / 100 MALES
53.1
MEDIAN AGE
2.9
AVG FAMILY SIZE
1.9
AVG HOUSEHOLD SIZE
750
LABOR FORCE [ PEOPLE ]
56.0%
PERCENT IN LABOR FORCE
5.5%
UNEMPLOYMENT RATE
Oberlin Zip Codes
Oberlin Area Codes
Income in Oberlin
Income Overview in Oberlin
Per Capita Income in Oberlin is $29,689, while median incomes of families and households are $53,571 and $40,735 respectively.
| Characteristic | Number | Measure |
| Per Capita Income | 1,629 | $29,689 |
| Median Family Income | 378 | $53,571 |
| Mean Family Income | 378 | $76,615 |
| Median Household Income | 814 | $40,735 |
| Mean Household Income | 814 | $56,107 |
| Income Deficit | 378 | $0 |
| Wage / Income Gap (%) | 1,629 | 40.81% |
| Wage / Income Gap ($) | 1,629 | 59.19¢ per $1 |
| Gini / Inequality Index | 1,629 | 0.41 |
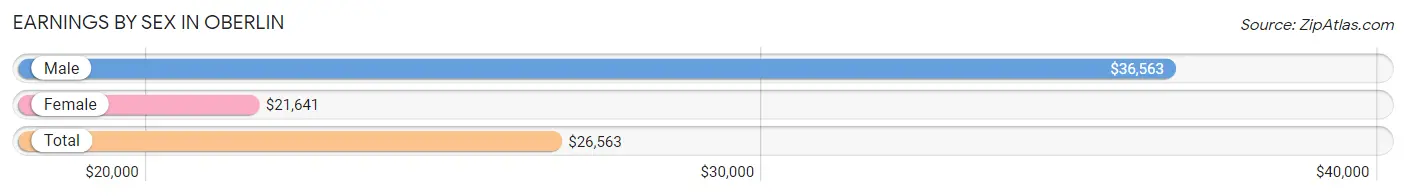
Earnings by Sex in Oberlin
Average Earnings in Oberlin are $26,563, $36,563 for men and $21,641 for women, a difference of 40.8%.
| Sex | Number | Average Earnings |
| Male | 415 (49.9%) | $36,563 |
| Female | 417 (50.1%) | $21,641 |
| Total | 832 (100.0%) | $26,563 |
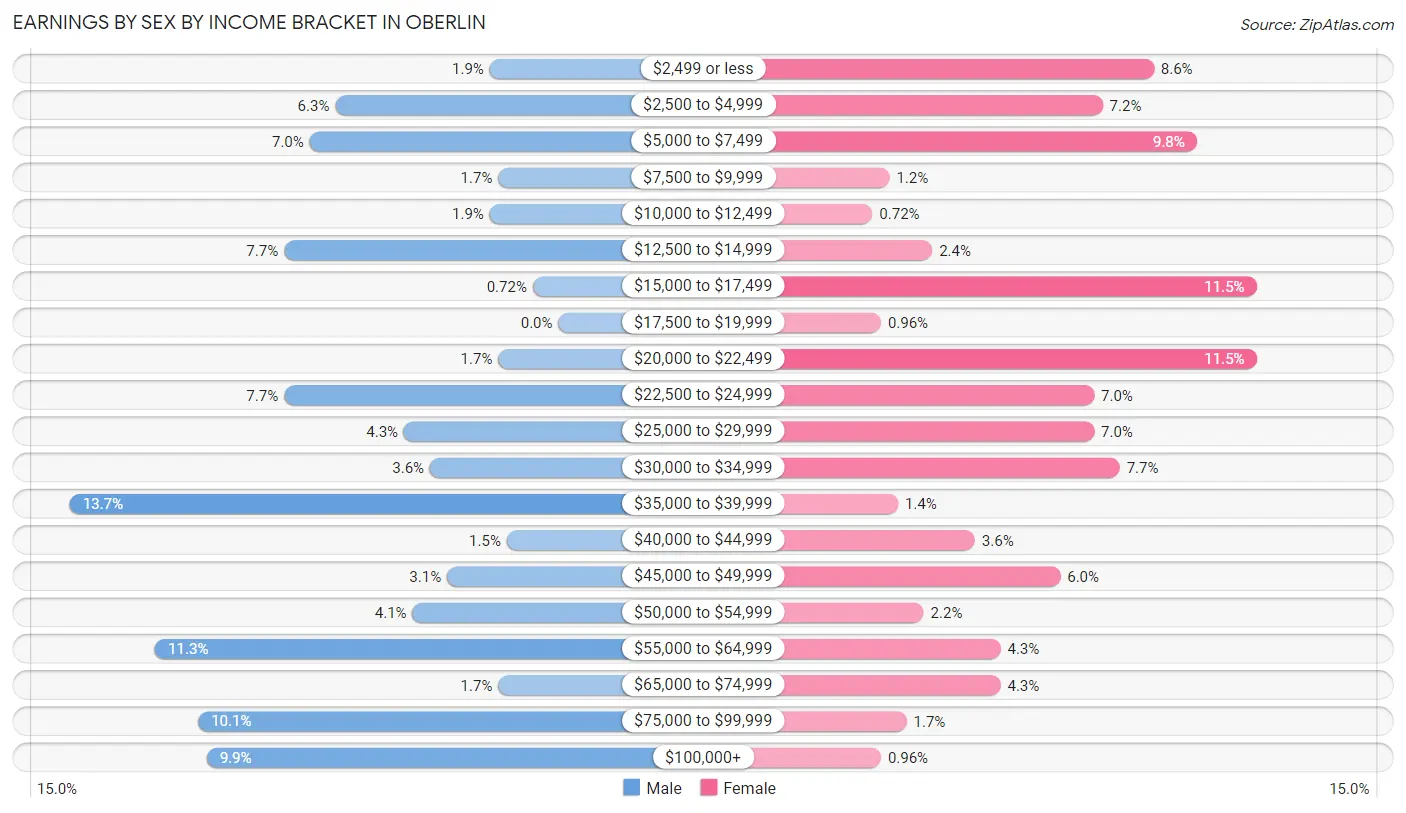
Earnings by Sex by Income Bracket in Oberlin
The most common earnings brackets in Oberlin are $35,000 to $39,999 for men (57 | 13.7%) and $15,000 to $17,499 for women (48 | 11.5%).
| Income | Male | Female |
| $2,499 or less | 8 (1.9%) | 36 (8.6%) |
| $2,500 to $4,999 | 26 (6.3%) | 30 (7.2%) |
| $5,000 to $7,499 | 29 (7.0%) | 41 (9.8%) |
| $7,500 to $9,999 | 7 (1.7%) | 5 (1.2%) |
| $10,000 to $12,499 | 8 (1.9%) | 3 (0.7%) |
| $12,500 to $14,999 | 32 (7.7%) | 10 (2.4%) |
| $15,000 to $17,499 | 3 (0.7%) | 48 (11.5%) |
| $17,500 to $19,999 | 0 (0.0%) | 4 (1.0%) |
| $20,000 to $22,499 | 7 (1.7%) | 48 (11.5%) |
| $22,500 to $24,999 | 32 (7.7%) | 29 (7.0%) |
| $25,000 to $29,999 | 18 (4.3%) | 29 (7.0%) |
| $30,000 to $34,999 | 15 (3.6%) | 32 (7.7%) |
| $35,000 to $39,999 | 57 (13.7%) | 6 (1.4%) |
| $40,000 to $44,999 | 6 (1.5%) | 15 (3.6%) |
| $45,000 to $49,999 | 13 (3.1%) | 25 (6.0%) |
| $50,000 to $54,999 | 17 (4.1%) | 9 (2.2%) |
| $55,000 to $64,999 | 47 (11.3%) | 18 (4.3%) |
| $65,000 to $74,999 | 7 (1.7%) | 18 (4.3%) |
| $75,000 to $99,999 | 42 (10.1%) | 7 (1.7%) |
| $100,000+ | 41 (9.9%) | 4 (1.0%) |
| Total | 415 (100.0%) | 417 (100.0%) |
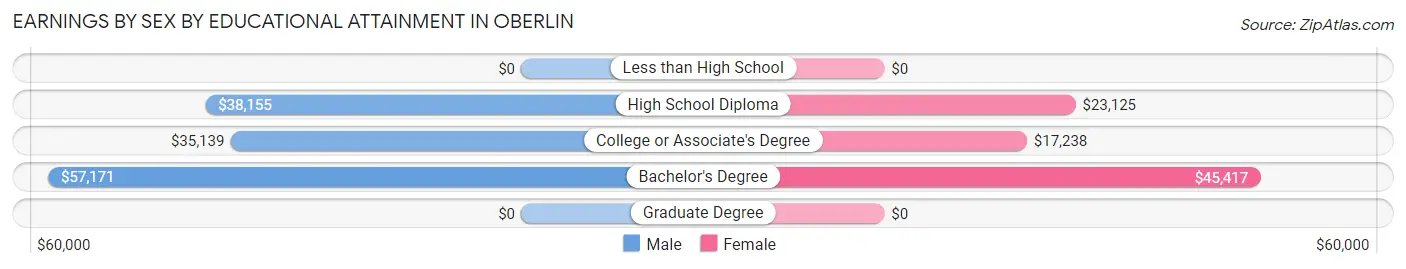
Earnings by Sex by Educational Attainment in Oberlin
Average earnings in Oberlin are $36,979 for men and $22,448 for women, a difference of 39.3%. Men with an educational attainment of bachelor's degree enjoy the highest average annual earnings of $57,171, while those with college or associate's degree education earn the least with $35,139. Women with an educational attainment of bachelor's degree earn the most with the average annual earnings of $45,417, while those with college or associate's degree education have the smallest earnings of $17,238.
| Educational Attainment | Male Income | Female Income |
| Less than High School | - | - |
| High School Diploma | $38,155 | $23,125 |
| College or Associate's Degree | $35,139 | $17,238 |
| Bachelor's Degree | $57,171 | $45,417 |
| Graduate Degree | - | - |
| Total | $36,979 | $22,448 |
Family Income in Oberlin
Family Income Brackets in Oberlin
According to the Oberlin family income data, there are 98 families falling into the $35,000 to $49,999 income range, which is the most common income bracket and makes up 25.9% of all families. Conversely, the $10,000 to $14,999 income bracket is the least frequent group with only 6 families (1.6%) belonging to this category.
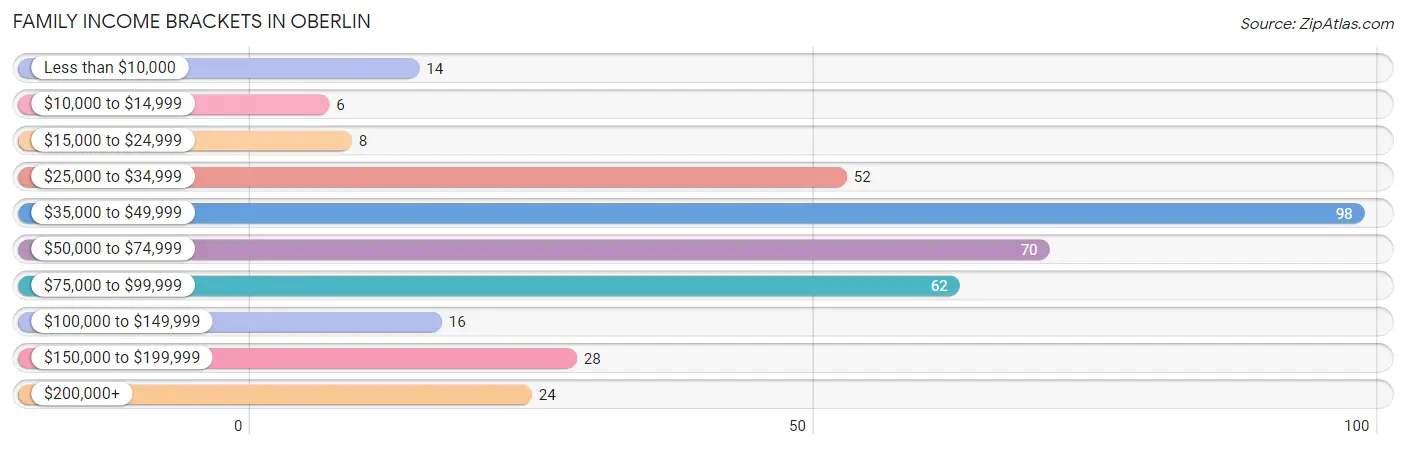
| Income Bracket | # Families | % Families |
| Less than $10,000 | 14 | 3.7% |
| $10,000 to $14,999 | 6 | 1.6% |
| $15,000 to $24,999 | 8 | 2.1% |
| $25,000 to $34,999 | 52 | 13.8% |
| $35,000 to $49,999 | 98 | 25.9% |
| $50,000 to $74,999 | 70 | 18.5% |
| $75,000 to $99,999 | 62 | 16.4% |
| $100,000 to $149,999 | 16 | 4.2% |
| $150,000 to $199,999 | 28 | 7.4% |
| $200,000+ | 24 | 6.3% |
Family Income by Famaliy Size in Oberlin
3-person families (60 | 15.9%) account for the highest median family income in Oberlin with $68,125 per family, while 2-person families (257 | 68.0%) have the highest median income of $25,860 per family member.
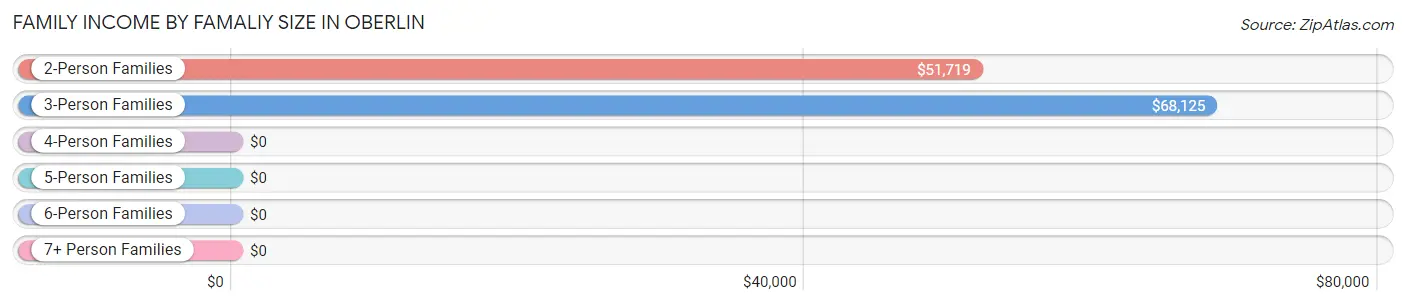
| Income Bracket | # Families | Median Income |
| 2-Person Families | 257 (68.0%) | $51,719 |
| 3-Person Families | 60 (15.9%) | $68,125 |
| 4-Person Families | 32 (8.5%) | $0 |
| 5-Person Families | 29 (7.7%) | $0 |
| 6-Person Families | 0 (0.0%) | $0 |
| 7+ Person Families | 0 (0.0%) | $0 |
| Total | 378 (100.0%) | $53,571 |
Family Income by Number of Earners in Oberlin
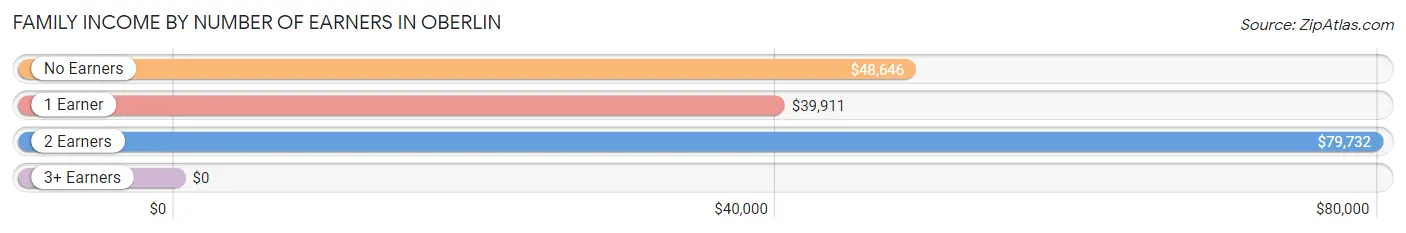
| Number of Earners | # Families | Median Income |
| No Earners | 61 (16.1%) | $48,646 |
| 1 Earner | 164 (43.4%) | $39,911 |
| 2 Earners | 143 (37.8%) | $79,732 |
| 3+ Earners | 10 (2.6%) | $0 |
| Total | 378 (100.0%) | $53,571 |
Household Income in Oberlin
Household Income Brackets in Oberlin
With 220 households falling in the category, the $35,000 to $49,999 income range is the most frequent in Oberlin, accounting for 27.0% of all households. In contrast, only 16 households (2.0%) fall into the $100,000 to $149,999 income bracket, making it the least populous group.
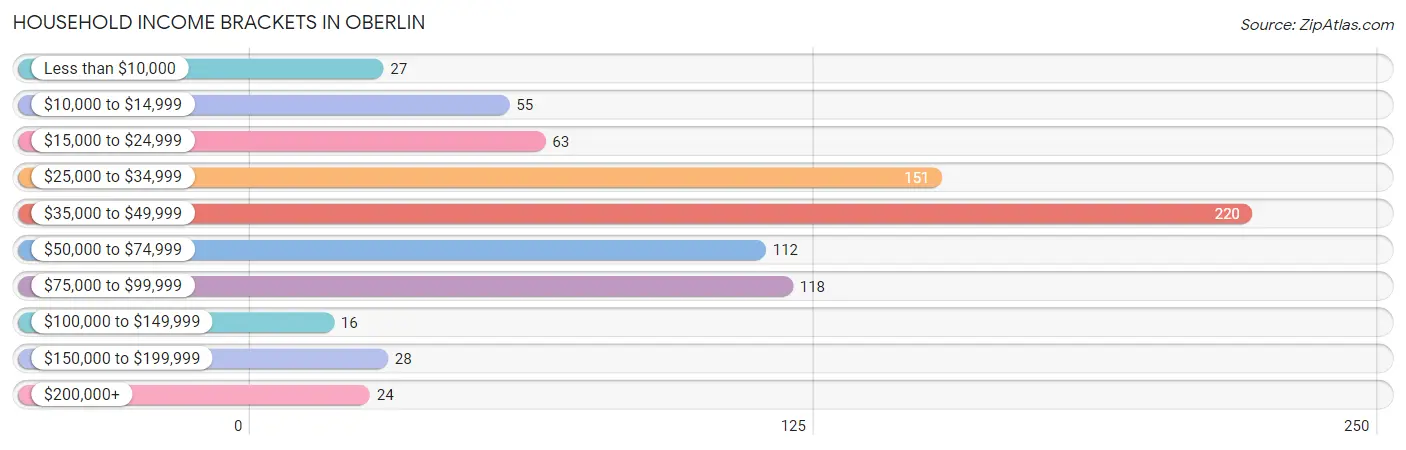
| Income Bracket | # Households | % Households |
| Less than $10,000 | 27 | 3.3% |
| $10,000 to $14,999 | 55 | 6.8% |
| $15,000 to $24,999 | 63 | 7.7% |
| $25,000 to $34,999 | 151 | 18.6% |
| $35,000 to $49,999 | 220 | 27.0% |
| $50,000 to $74,999 | 112 | 13.8% |
| $75,000 to $99,999 | 118 | 14.5% |
| $100,000 to $149,999 | 16 | 2.0% |
| $150,000 to $199,999 | 28 | 3.4% |
| $200,000+ | 24 | 2.9% |
Household Income by Householder Age in Oberlin
The median household income in Oberlin is $40,735, with the highest median household income of $52,500 found in the 25 to 44 years age bracket for the primary householder. A total of 204 households (25.1%) fall into this category. Meanwhile, the 15 to 24 years age bracket for the primary householder has the lowest median household income of $0, with 9 households (1.1%) in this group.
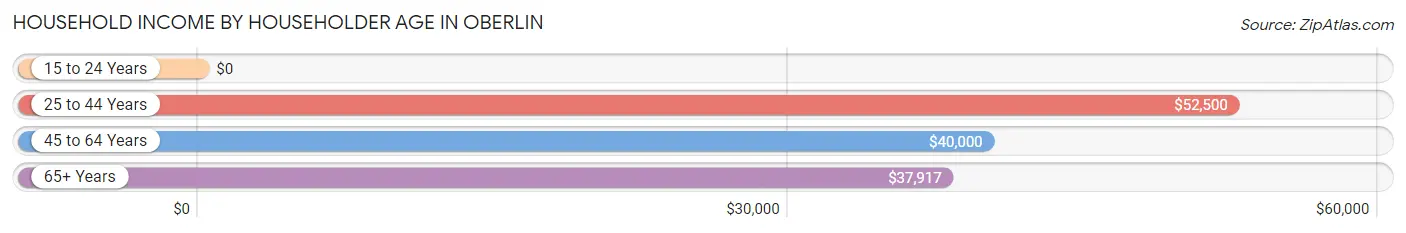
| Income Bracket | # Households | Median Income |
| 15 to 24 Years | 9 (1.1%) | $0 |
| 25 to 44 Years | 204 (25.1%) | $52,500 |
| 45 to 64 Years | 200 (24.6%) | $40,000 |
| 65+ Years | 401 (49.3%) | $37,917 |
| Total | 814 (100.0%) | $40,735 |
Poverty in Oberlin
Income Below Poverty by Sex and Age in Oberlin
With 6.0% poverty level for males and 14.6% for females among the residents of Oberlin, 18 to 24 year old males and 16 and 17 year old females are the most vulnerable to poverty, with 5 males (71.4%) and 26 females (74.3%) in their respective age groups living below the poverty level.
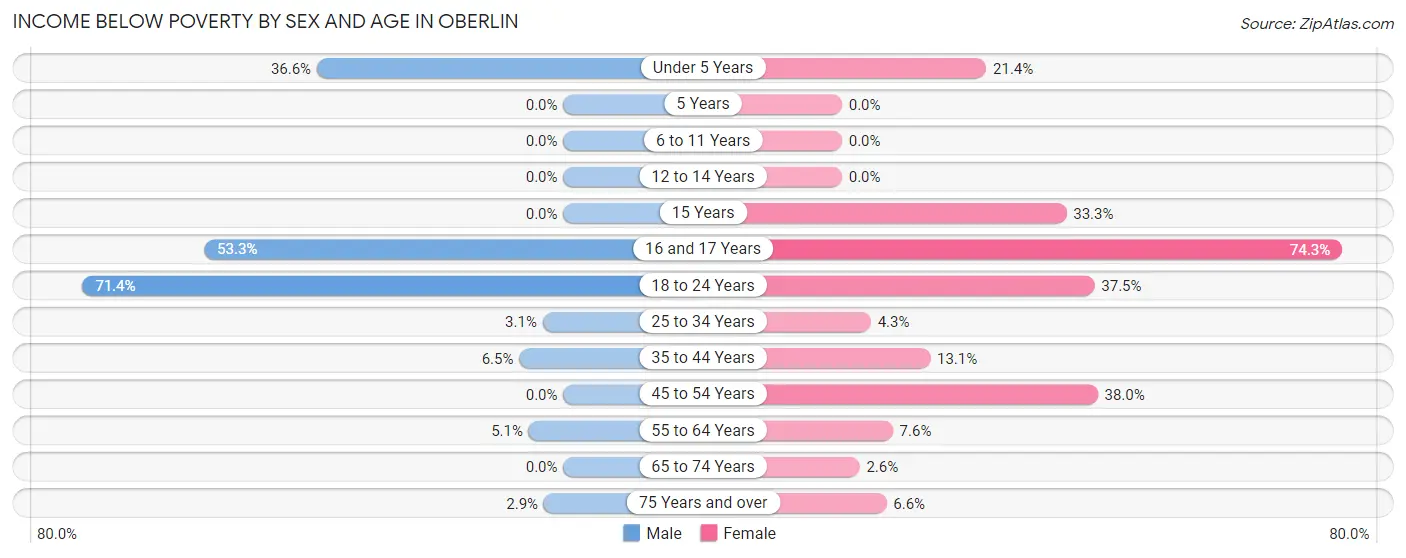
| Age Bracket | Male | Female |
| Under 5 Years | 15 (36.6%) | 6 (21.4%) |
| 5 Years | 0 (0.0%) | 0 (0.0%) |
| 6 to 11 Years | 0 (0.0%) | 0 (0.0%) |
| 12 to 14 Years | 0 (0.0%) | 0 (0.0%) |
| 15 Years | 0 (0.0%) | 8 (33.3%) |
| 16 and 17 Years | 8 (53.3%) | 26 (74.3%) |
| 18 to 24 Years | 5 (71.4%) | 9 (37.5%) |
| 25 to 34 Years | 3 (3.1%) | 3 (4.3%) |
| 35 to 44 Years | 7 (6.5%) | 11 (13.1%) |
| 45 to 54 Years | 0 (0.0%) | 30 (38.0%) |
| 55 to 64 Years | 6 (5.1%) | 8 (7.5%) |
| 65 to 74 Years | 0 (0.0%) | 4 (2.6%) |
| 75 Years and over | 3 (2.9%) | 8 (6.6%) |
| Total | 47 (6.0%) | 113 (14.6%) |
Income Above Poverty by Sex and Age in Oberlin
According to the poverty statistics in Oberlin, males aged 5 years and females aged 6 to 11 years are the age groups that are most secure financially, with 100.0% of males and 100.0% of females in these age groups living above the poverty line.
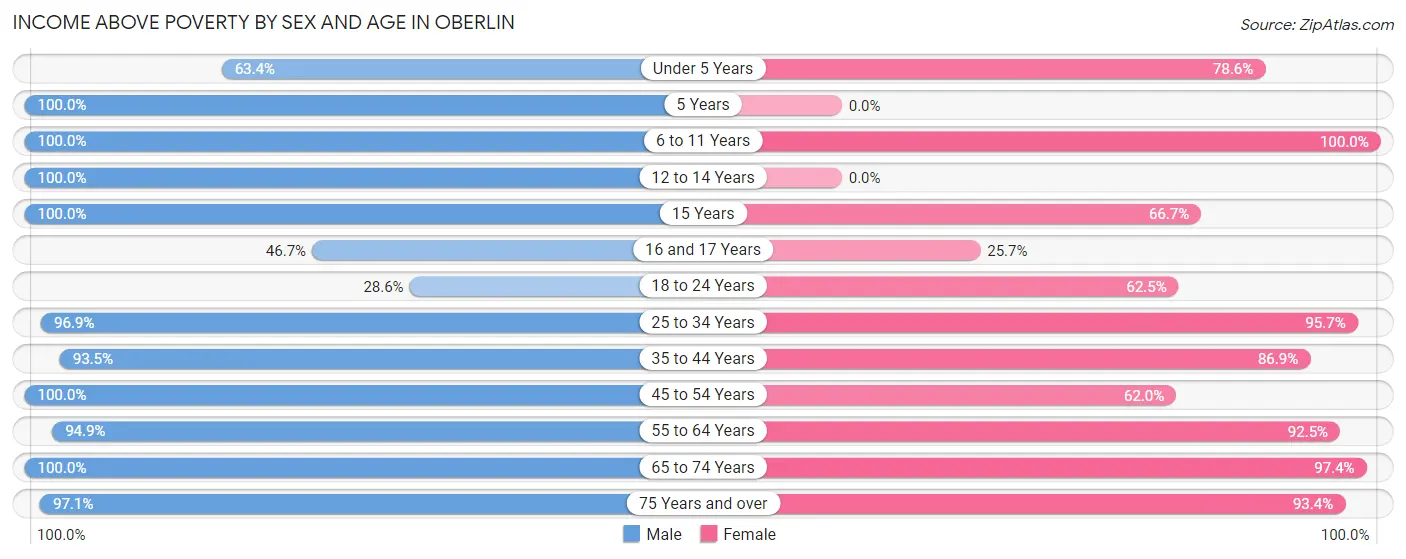
| Age Bracket | Male | Female |
| Under 5 Years | 26 (63.4%) | 22 (78.6%) |
| 5 Years | 13 (100.0%) | 0 (0.0%) |
| 6 to 11 Years | 36 (100.0%) | 51 (100.0%) |
| 12 to 14 Years | 63 (100.0%) | 0 (0.0%) |
| 15 Years | 10 (100.0%) | 16 (66.7%) |
| 16 and 17 Years | 7 (46.7%) | 9 (25.7%) |
| 18 to 24 Years | 2 (28.6%) | 15 (62.5%) |
| 25 to 34 Years | 95 (96.9%) | 67 (95.7%) |
| 35 to 44 Years | 100 (93.5%) | 73 (86.9%) |
| 45 to 54 Years | 37 (100.0%) | 49 (62.0%) |
| 55 to 64 Years | 111 (94.9%) | 98 (92.4%) |
| 65 to 74 Years | 134 (100.0%) | 148 (97.4%) |
| 75 Years and over | 101 (97.1%) | 113 (93.4%) |
| Total | 735 (94.0%) | 661 (85.4%) |
Income Below Poverty Among Married-Couple Families in Oberlin
The poverty statistics for married-couple families in Oberlin show that 2.6% or 8 of the total 309 families live below the poverty line. Families with 1 or 2 children have the highest poverty rate of 16.7%, comprising of 8 families. On the other hand, families with no children have the lowest poverty rate of 0.0%, which includes 0 families.
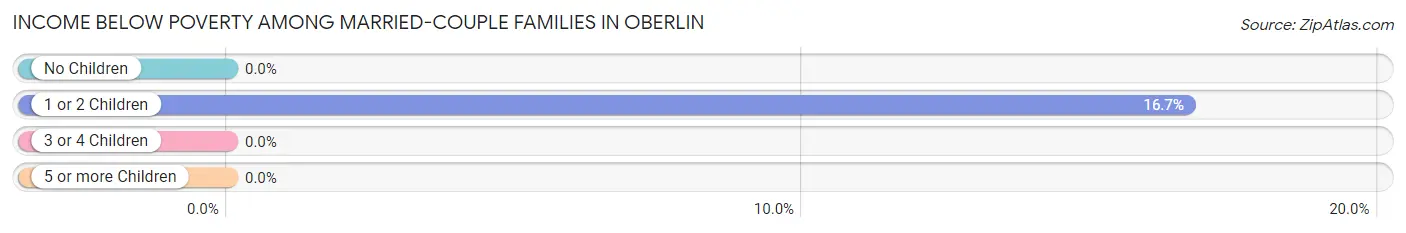
| Children | Above Poverty | Below Poverty |
| No Children | 232 (100.0%) | 0 (0.0%) |
| 1 or 2 Children | 40 (83.3%) | 8 (16.7%) |
| 3 or 4 Children | 29 (100.0%) | 0 (0.0%) |
| 5 or more Children | 0 (0.0%) | 0 (0.0%) |
| Total | 301 (97.4%) | 8 (2.6%) |
Income Below Poverty Among Single-Parent Households in Oberlin
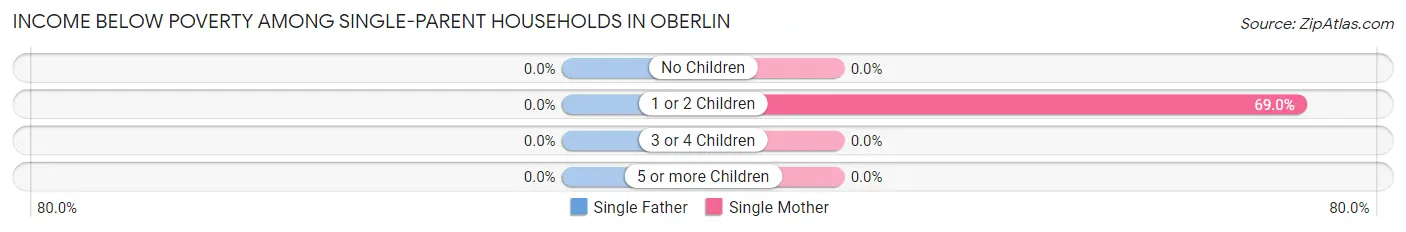
| Children | Single Father | Single Mother |
| No Children | 0 (0.0%) | 0 (0.0%) |
| 1 or 2 Children | 0 (0.0%) | 20 (69.0%) |
| 3 or 4 Children | 0 (0.0%) | 0 (0.0%) |
| 5 or more Children | 0 (0.0%) | 0 (0.0%) |
| Total | 0 (0.0%) | 20 (57.1%) |
Income Below Poverty Among Married-Couple vs Single-Parent Households in Oberlin
The poverty data for Oberlin shows that 8 of the married-couple family households (2.6%) and 20 of the single-parent households (29.0%) are living below the poverty level. Within the married-couple family households, those with 1 or 2 children have the highest poverty rate, with 8 households (16.7%) falling below the poverty line. Among the single-parent households, those with 1 or 2 children have the highest poverty rate, with 20 household (44.4%) living below poverty.
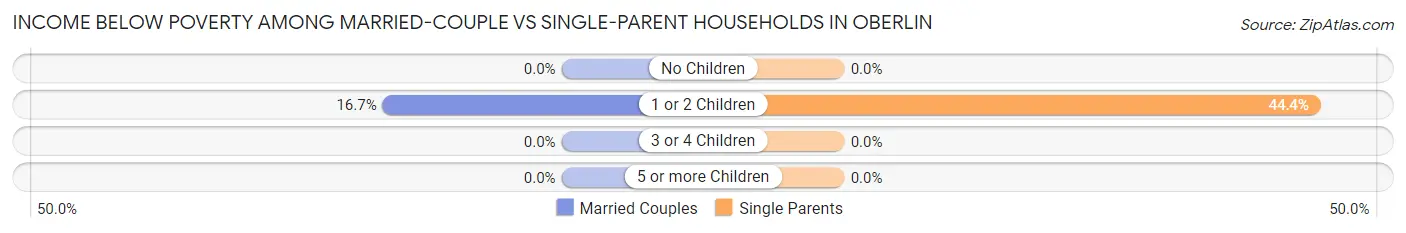
| Children | Married-Couple Families | Single-Parent Households |
| No Children | 0 (0.0%) | 0 (0.0%) |
| 1 or 2 Children | 8 (16.7%) | 20 (44.4%) |
| 3 or 4 Children | 0 (0.0%) | 0 (0.0%) |
| 5 or more Children | 0 (0.0%) | 0 (0.0%) |
| Total | 8 (2.6%) | 20 (29.0%) |
Race in Oberlin
The most populous races in Oberlin are White / Caucasian (1,521 | 93.4%), Two or more Races (45 | 2.8%), and Hispanic or Latino (37 | 2.3%).
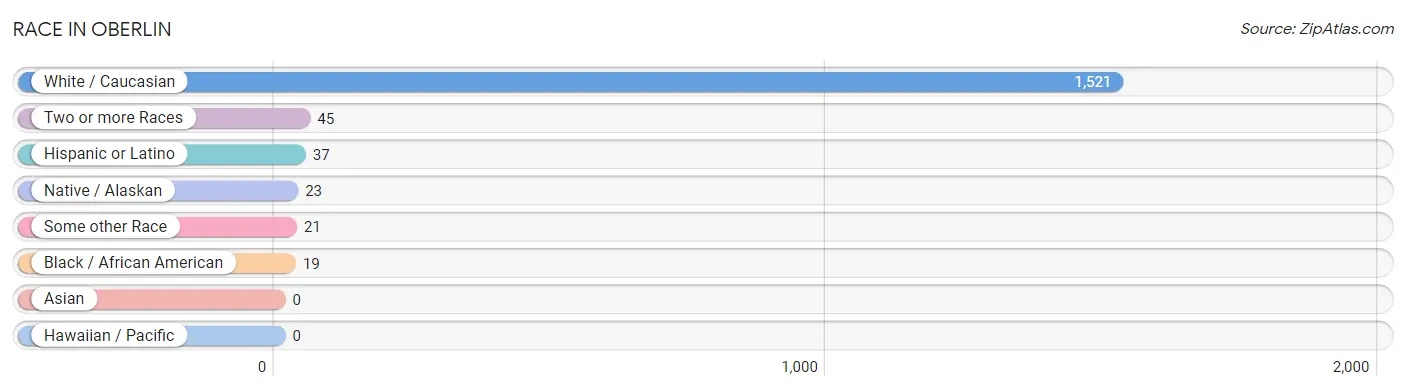
| Race | # Population | % Population |
| Asian | 0 | 0.0% |
| Black / African American | 19 | 1.2% |
| Hawaiian / Pacific | 0 | 0.0% |
| Hispanic or Latino | 37 | 2.3% |
| Native / Alaskan | 23 | 1.4% |
| White / Caucasian | 1,521 | 93.4% |
| Two or more Races | 45 | 2.8% |
| Some other Race | 21 | 1.3% |
| Total | 1,629 | 100.0% |
Ancestry in Oberlin
The most populous ancestries reported in Oberlin are German (629 | 38.6%), Irish (210 | 12.9%), English (189 | 11.6%), Swedish (184 | 11.3%), and American (97 | 5.9%), together accounting for 80.3% of all Oberlin residents.
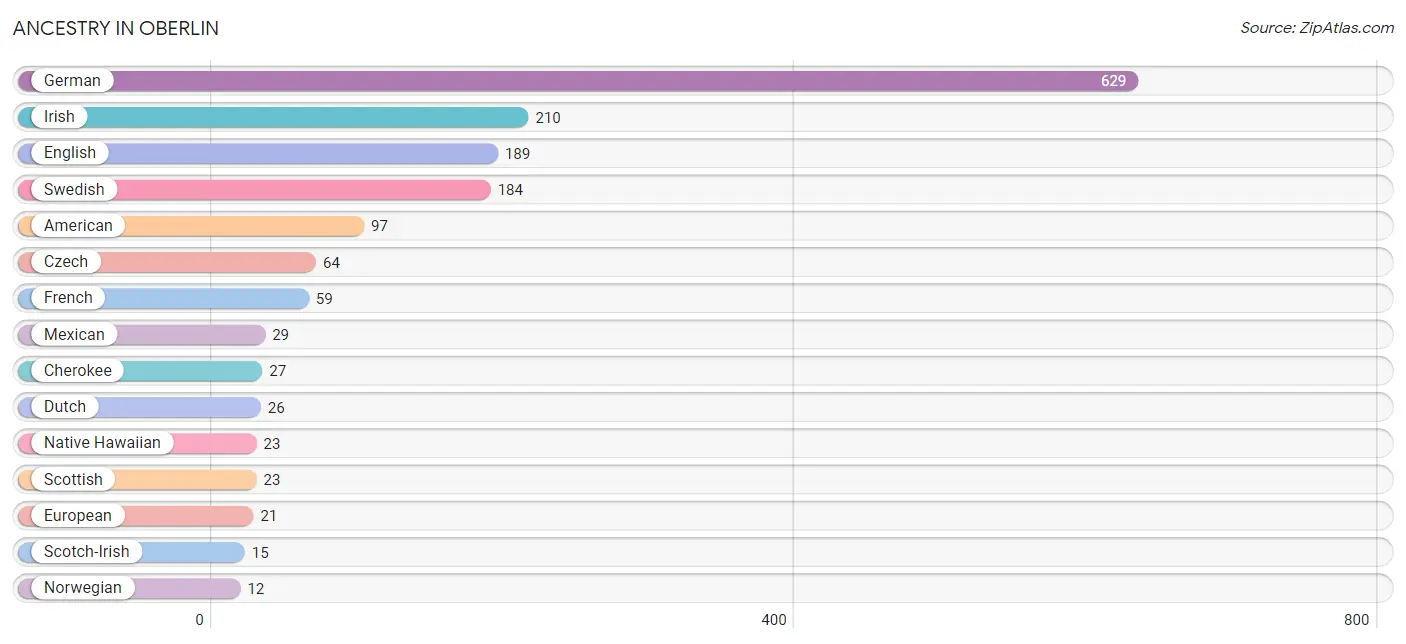
| Ancestry | # Population | % Population |
| American | 97 | 5.9% |
| Bhutanese | 8 | 0.5% |
| Central American | 3 | 0.2% |
| Cherokee | 27 | 1.7% |
| Czech | 64 | 3.9% |
| Czechoslovakian | 9 | 0.5% |
| Danish | 3 | 0.2% |
| Dutch | 26 | 1.6% |
| English | 189 | 11.6% |
| European | 21 | 1.3% |
| French | 59 | 3.6% |
| German | 629 | 38.6% |
| Irish | 210 | 12.9% |
| Korean | 6 | 0.4% |
| Mexican | 29 | 1.8% |
| Native Hawaiian | 23 | 1.4% |
| Norwegian | 12 | 0.7% |
| Paiute | 3 | 0.2% |
| Pennsylvania German | 5 | 0.3% |
| Russian | 6 | 0.4% |
| Salvadoran | 3 | 0.2% |
| Scotch-Irish | 15 | 0.9% |
| Scottish | 23 | 1.4% |
| Swedish | 184 | 11.3% |
| Swiss | 7 | 0.4% |
| Welsh | 1 | 0.1% | View All 26 Rows |
Immigrants in Oberlin
The most numerous immigrant groups reported in Oberlin came from Central America (6 | 0.4%), Latin America (6 | 0.4%), El Salvador (3 | 0.2%), and Mexico (3 | 0.2%), together accounting for 1.1% of all Oberlin residents.
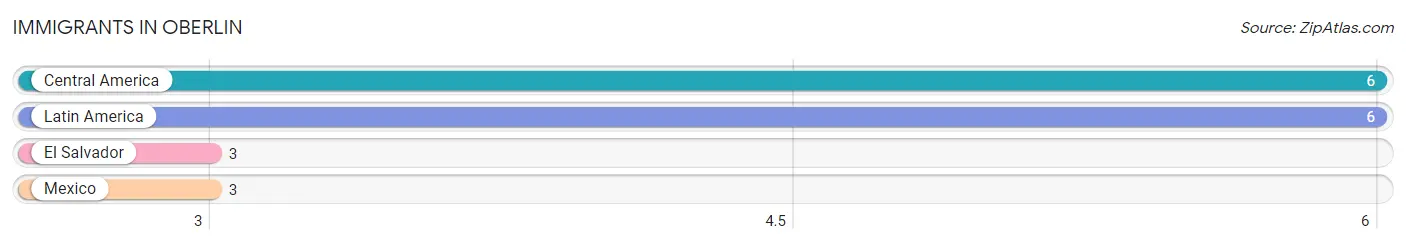
| Immigration Origin | # Population | % Population |
| Central America | 6 | 0.4% |
| El Salvador | 3 | 0.2% |
| Latin America | 6 | 0.4% |
| Mexico | 3 | 0.2% | View All 4 Rows |
Sex and Age in Oberlin
Sex and Age in Oberlin
The most populous age groups in Oberlin are 65 to 69 Years (108 | 13.4%) for men and 65 to 69 Years (92 | 11.2%) for women.
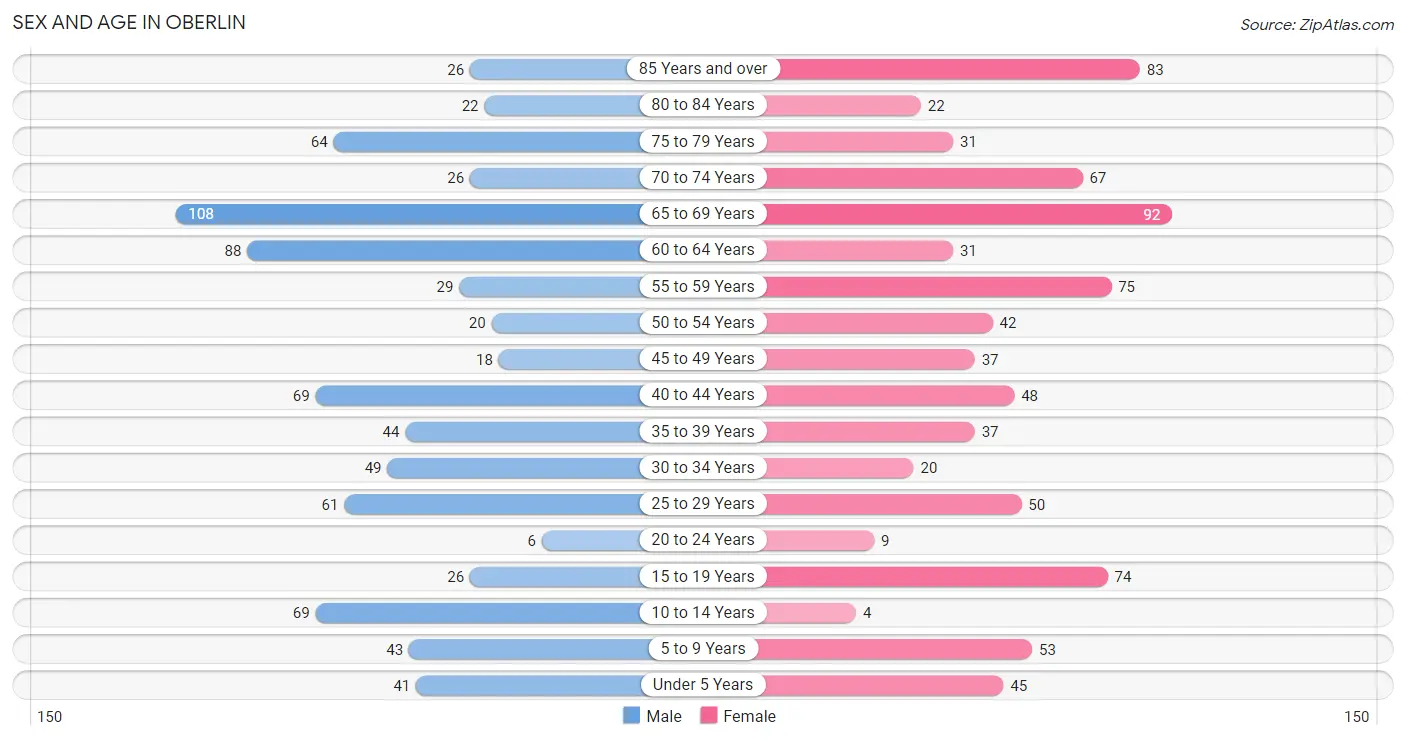
| Age Bracket | Male | Female |
| Under 5 Years | 41 (5.1%) | 45 (5.5%) |
| 5 to 9 Years | 43 (5.3%) | 53 (6.5%) |
| 10 to 14 Years | 69 (8.5%) | 4 (0.5%) |
| 15 to 19 Years | 26 (3.2%) | 74 (9.0%) |
| 20 to 24 Years | 6 (0.7%) | 9 (1.1%) |
| 25 to 29 Years | 61 (7.5%) | 50 (6.1%) |
| 30 to 34 Years | 49 (6.1%) | 20 (2.4%) |
| 35 to 39 Years | 44 (5.4%) | 37 (4.5%) |
| 40 to 44 Years | 69 (8.5%) | 48 (5.9%) |
| 45 to 49 Years | 18 (2.2%) | 37 (4.5%) |
| 50 to 54 Years | 20 (2.5%) | 42 (5.1%) |
| 55 to 59 Years | 29 (3.6%) | 75 (9.1%) |
| 60 to 64 Years | 88 (10.9%) | 31 (3.8%) |
| 65 to 69 Years | 108 (13.4%) | 92 (11.2%) |
| 70 to 74 Years | 26 (3.2%) | 67 (8.2%) |
| 75 to 79 Years | 64 (7.9%) | 31 (3.8%) |
| 80 to 84 Years | 22 (2.7%) | 22 (2.7%) |
| 85 Years and over | 26 (3.2%) | 83 (10.1%) |
| Total | 809 (100.0%) | 820 (100.0%) |
Families and Households in Oberlin
Median Family Size in Oberlin
The median family size in Oberlin is 2.88 persons per family, with married-couple families (309 | 81.8%) accounting for the largest median family size of 2.97 persons per family. On the other hand, single female/mother families (35 | 9.3%) represent the smallest median family size with 2.31 persons per family.
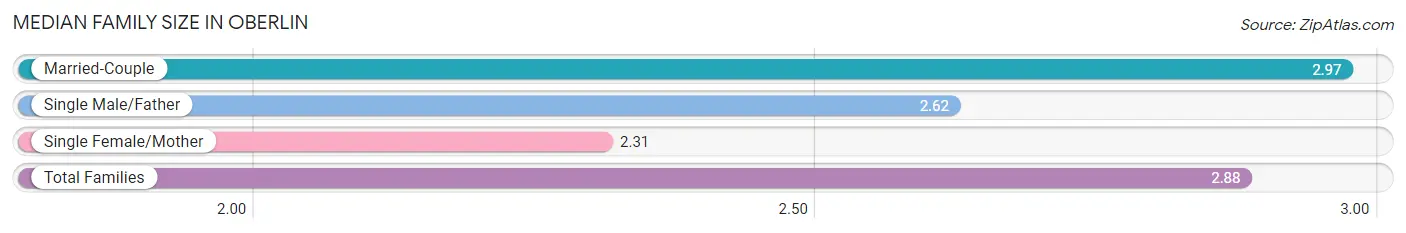
| Family Type | # Families | Family Size |
| Married-Couple | 309 (81.8%) | 2.97 |
| Single Male/Father | 34 (9.0%) | 2.62 |
| Single Female/Mother | 35 (9.3%) | 2.31 |
| Total Families | 378 (100.0%) | 2.88 |
Median Household Size in Oberlin
The median household size in Oberlin is 1.94 persons per household, with married-couple households (309 | 38.0%) accounting for the largest median household size of 3.07 persons per household. non-family households (436 | 53.6%) represent the smallest median household size with 1.04 persons per household.
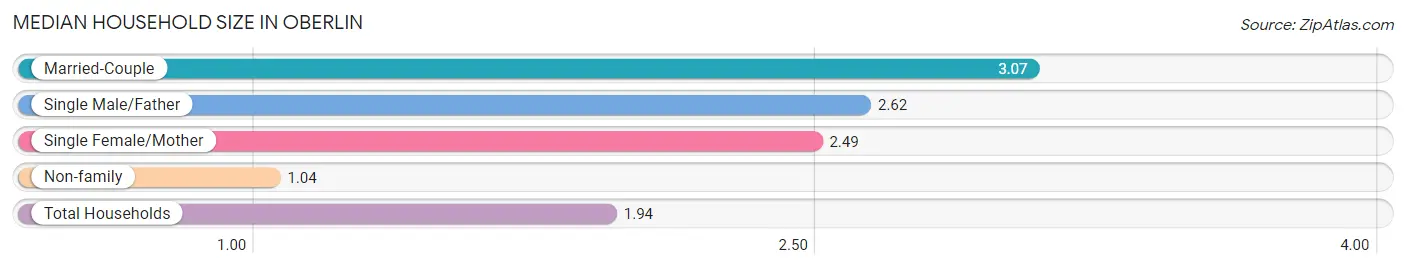
| Household Type | # Households | Household Size |
| Married-Couple | 309 (38.0%) | 3.07 |
| Single Male/Father | 34 (4.2%) | 2.62 |
| Single Female/Mother | 35 (4.3%) | 2.49 |
| Non-family | 436 (53.6%) | 1.04 |
| Total Households | 814 (100.0%) | 1.94 |
Household Size by Marriage Status in Oberlin
Out of a total of 814 households in Oberlin, 378 (46.4%) are family households, while 436 (53.6%) are nonfamily households. The most numerous type of family households are 2-person households, comprising 247, and the most common type of nonfamily households are 1-person households, comprising 401.
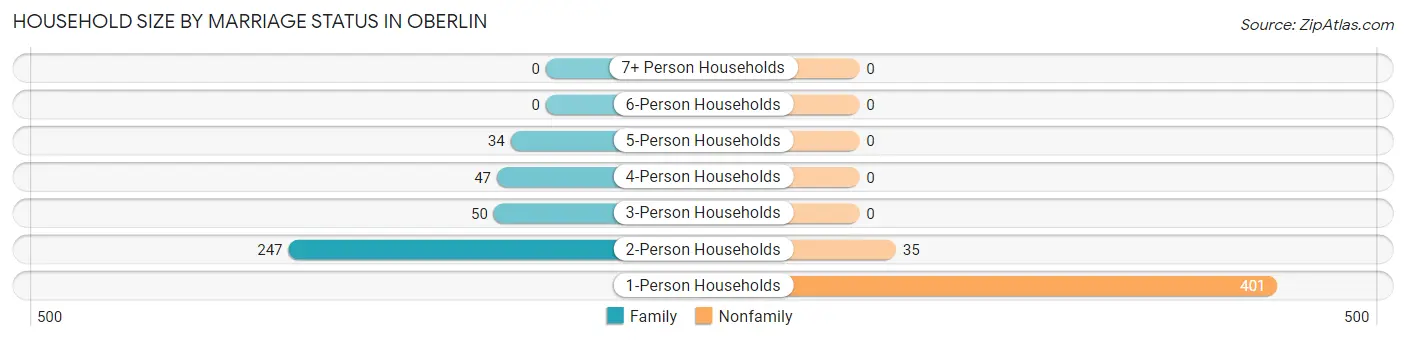
| Household Size | Family Households | Nonfamily Households |
| 1-Person Households | - | 401 (49.3%) |
| 2-Person Households | 247 (30.3%) | 35 (4.3%) |
| 3-Person Households | 50 (6.1%) | 0 (0.0%) |
| 4-Person Households | 47 (5.8%) | 0 (0.0%) |
| 5-Person Households | 34 (4.2%) | 0 (0.0%) |
| 6-Person Households | 0 (0.0%) | 0 (0.0%) |
| 7+ Person Households | 0 (0.0%) | 0 (0.0%) |
| Total | 378 (46.4%) | 436 (53.6%) |
Female Fertility in Oberlin
Fertility by Age in Oberlin
Average fertility rate in Oberlin is 7.0 births per 1,000 women. Women in the age bracket of 15 to 19 years have the highest fertility rate with 27.0 births per 1,000 women. Women in the age bracket of 15 to 19 years acount for 100.0% of all women with births.
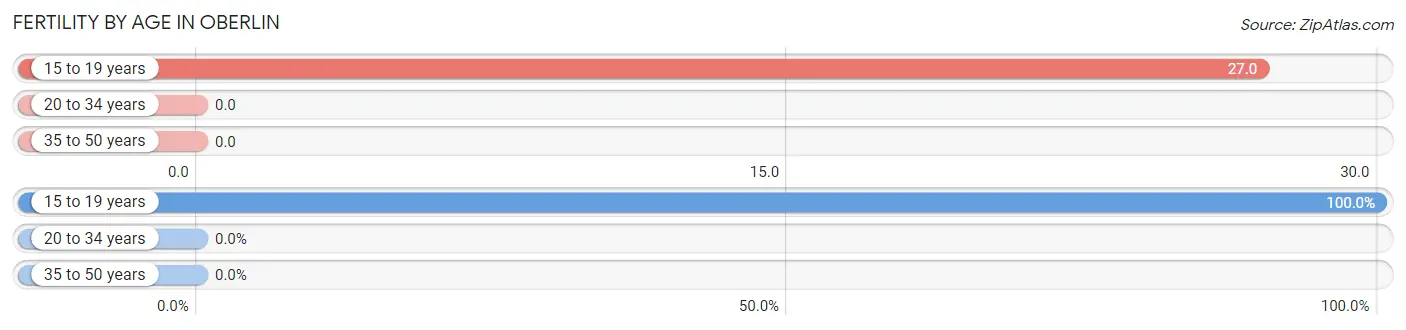
| Age Bracket | Women with Births | Births / 1,000 Women |
| 15 to 19 years | 2 (100.0%) | 27.0 |
| 20 to 34 years | 0 (0.0%) | 0.0 |
| 35 to 50 years | 0 (0.0%) | 0.0 |
| Total | 2 (100.0%) | 7.0 |
Fertility by Age by Marriage Status in Oberlin
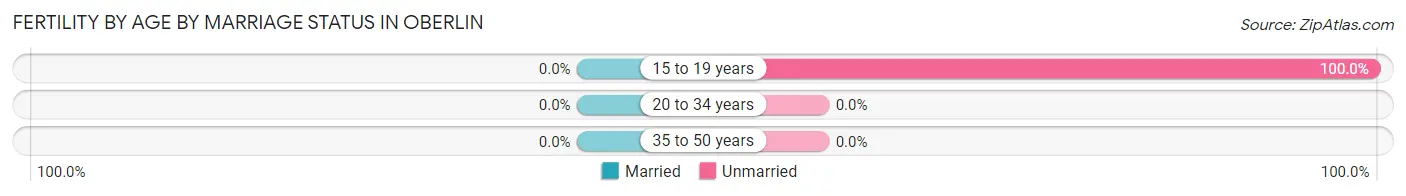
| Age Bracket | Married | Unmarried |
| 15 to 19 years | 0 (0.0%) | 2 (100.0%) |
| 20 to 34 years | 0 (0.0%) | 0 (0.0%) |
| 35 to 50 years | 0 (0.0%) | 0 (0.0%) |
| Total | 0 (0.0%) | 2 (100.0%) |
Fertility by Education in Oberlin
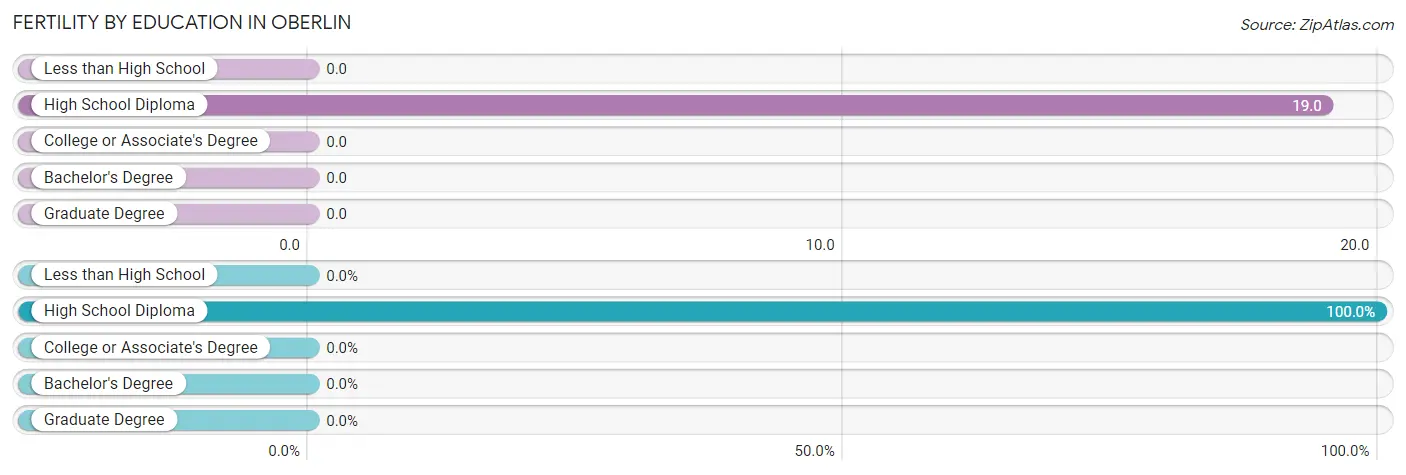
| Educational Attainment | Women with Births | Births / 1,000 Women |
| Less than High School | 0 (0.0%) | 0.0 |
| High School Diploma | 2 (100.0%) | 19.0 |
| College or Associate's Degree | 0 (0.0%) | 0.0 |
| Bachelor's Degree | 0 (0.0%) | 0.0 |
| Graduate Degree | 0 (0.0%) | 0.0 |
| Total | 2 (100.0%) | 7.0 |
Fertility by Education by Marriage Status in Oberlin
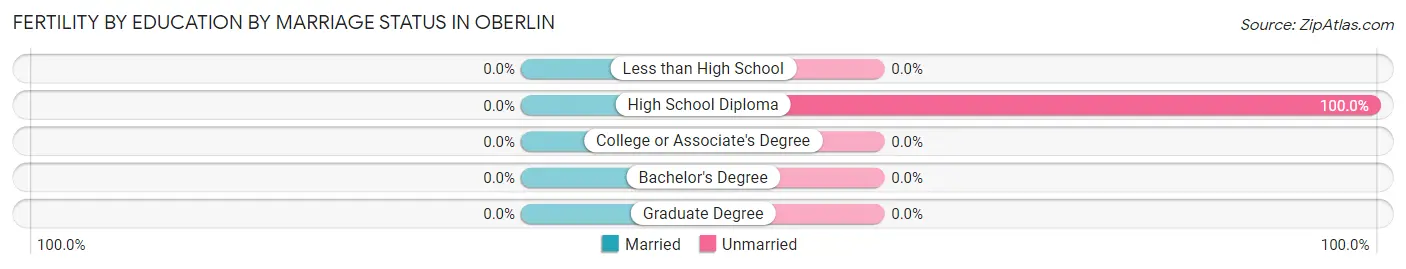
| Educational Attainment | Married | Unmarried |
| Less than High School | 0 (0.0%) | 0 (0.0%) |
| High School Diploma | 0 (0.0%) | 2 (100.0%) |
| College or Associate's Degree | 0 (0.0%) | 0 (0.0%) |
| Bachelor's Degree | 0 (0.0%) | 0 (0.0%) |
| Graduate Degree | 0 (0.0%) | 0 (0.0%) |
| Total | 0 (0.0%) | 2 (100.0%) |
Employment Characteristics in Oberlin
Employment by Class of Employer in Oberlin
Among the 709 employed individuals in Oberlin, private company employees (368 | 51.9%), self-employed (not incorporated) (86 | 12.1%), and local government employees (86 | 12.1%) make up the most common classes of employment.
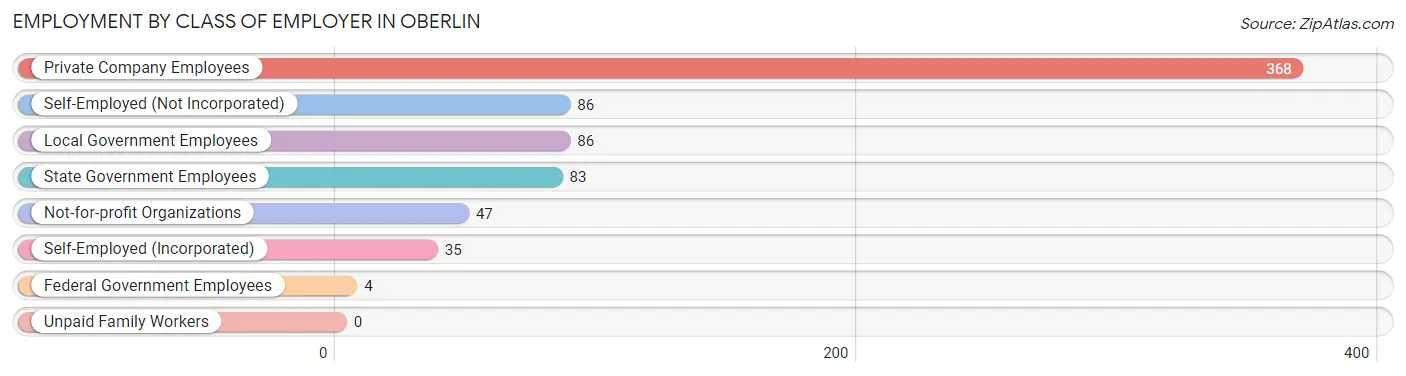
| Employer Class | # Employees | % Employees |
| Private Company Employees | 368 | 51.9% |
| Self-Employed (Incorporated) | 35 | 4.9% |
| Self-Employed (Not Incorporated) | 86 | 12.1% |
| Not-for-profit Organizations | 47 | 6.6% |
| Local Government Employees | 86 | 12.1% |
| State Government Employees | 83 | 11.7% |
| Federal Government Employees | 4 | 0.6% |
| Unpaid Family Workers | 0 | 0.0% |
| Total | 709 | 100.0% |
Employment Status by Age in Oberlin
According to the labor force statistics for Oberlin, out of the total population over 16 years of age (1,340), 56.0% or 750 individuals are in the labor force, with 5.5% or 41 of them unemployed. The age group with the highest labor force participation rate is 20 to 24 years, with 100.0% or 15 individuals in the labor force. Within the labor force, the 16 to 19 years age range has the highest percentage of unemployed individuals, with 35.7% or 15 of them being unemployed.
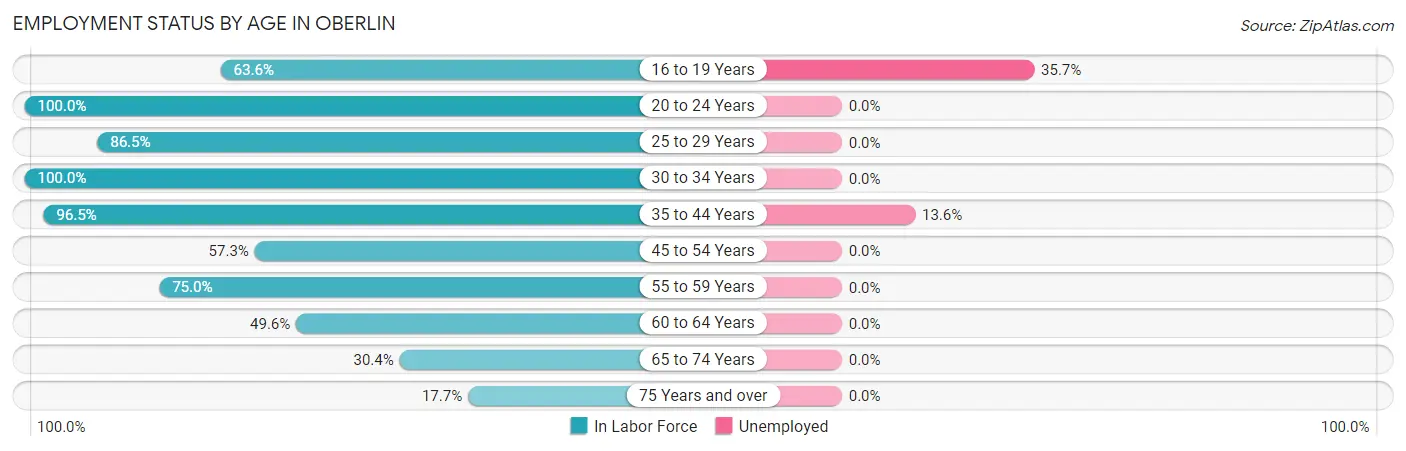
| Age Bracket | In Labor Force | Unemployed |
| 16 to 19 Years | 42 (63.6%) | 15 (35.7%) |
| 20 to 24 Years | 15 (100.0%) | 0 (0.0%) |
| 25 to 29 Years | 96 (86.5%) | 0 (0.0%) |
| 30 to 34 Years | 69 (100.0%) | 0 (0.0%) |
| 35 to 44 Years | 191 (96.5%) | 26 (13.6%) |
| 45 to 54 Years | 67 (57.3%) | 0 (0.0%) |
| 55 to 59 Years | 78 (75.0%) | 0 (0.0%) |
| 60 to 64 Years | 59 (49.6%) | 0 (0.0%) |
| 65 to 74 Years | 89 (30.4%) | 0 (0.0%) |
| 75 Years and over | 44 (17.7%) | 0 (0.0%) |
| Total | 750 (56.0%) | 41 (5.5%) |
Employment Status by Educational Attainment in Oberlin
According to labor force statistics for Oberlin, 78.0% of individuals (560) out of the total population between 25 and 64 years of age (718) are in the labor force, with 4.6% or 26 of them being unemployed. The group with the highest labor force participation rate are those with the educational attainment of college / associate degree, with 93.1% or 202 individuals in the labor force. Within the labor force, individuals with less than high school education have the highest percentage of unemployment, with 48.0% or 12 of them being unemployed.
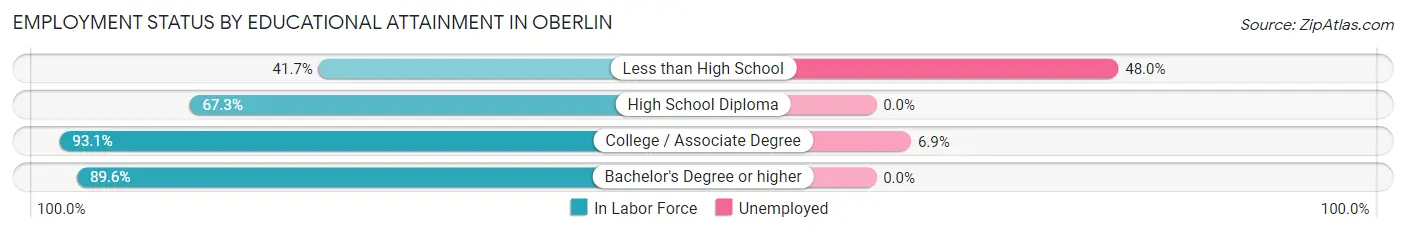
| Educational Attainment | In Labor Force | Unemployed |
| Less than High School | 25 (41.7%) | 29 (48.0%) |
| High School Diploma | 187 (67.3%) | 0 (0.0%) |
| College / Associate Degree | 202 (93.1%) | 15 (6.9%) |
| Bachelor's Degree or higher | 146 (89.6%) | 0 (0.0%) |
| Total | 560 (78.0%) | 33 (4.6%) |
Employment Occupations by Sex in Oberlin
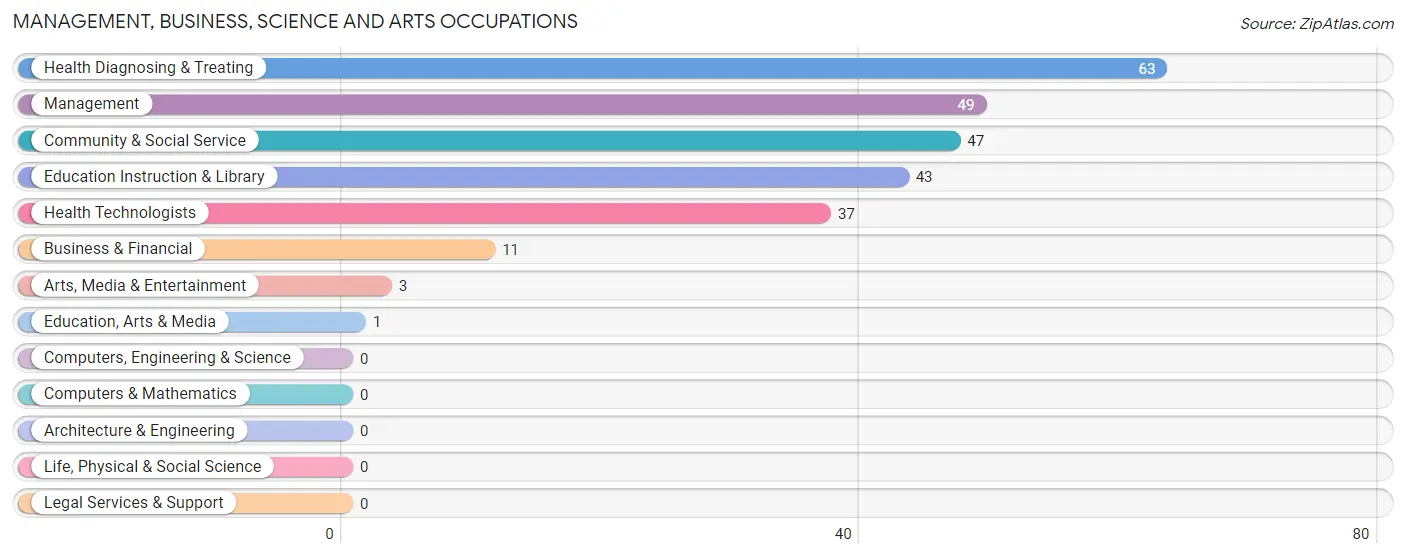
Management, Business, Science and Arts Occupations
The most common Management, Business, Science and Arts occupations in Oberlin are Health Diagnosing & Treating (63 | 8.9%), Management (49 | 6.9%), Community & Social Service (47 | 6.6%), Education Instruction & Library (43 | 6.1%), and Health Technologists (37 | 5.2%).
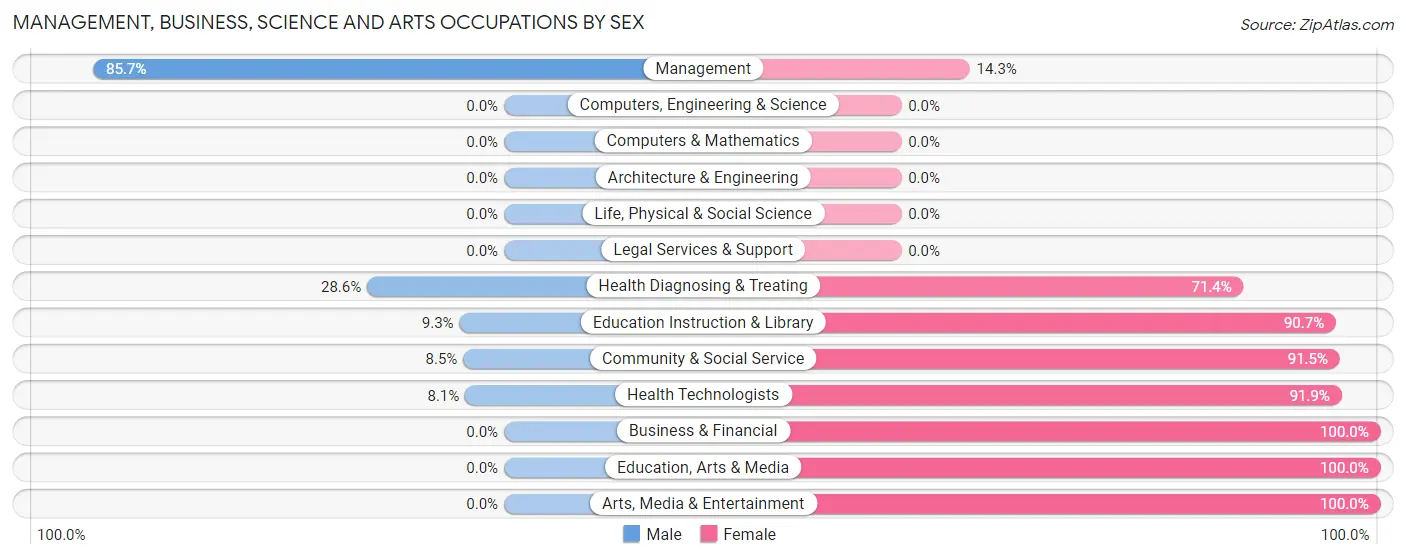
Management, Business, Science and Arts Occupations by Sex
Within the Management, Business, Science and Arts occupations in Oberlin, the most male-oriented occupations are Management (85.7%), Health Diagnosing & Treating (28.6%), and Education Instruction & Library (9.3%), while the most female-oriented occupations are Business & Financial (100.0%), Education, Arts & Media (100.0%), and Arts, Media & Entertainment (100.0%).
| Occupation | Male | Female |
| Management | 42 (85.7%) | 7 (14.3%) |
| Business & Financial | 0 (0.0%) | 11 (100.0%) |
| Computers, Engineering & Science | 0 (0.0%) | 0 (0.0%) |
| Computers & Mathematics | 0 (0.0%) | 0 (0.0%) |
| Architecture & Engineering | 0 (0.0%) | 0 (0.0%) |
| Life, Physical & Social Science | 0 (0.0%) | 0 (0.0%) |
| Community & Social Service | 4 (8.5%) | 43 (91.5%) |
| Education, Arts & Media | 0 (0.0%) | 1 (100.0%) |
| Legal Services & Support | 0 (0.0%) | 0 (0.0%) |
| Education Instruction & Library | 4 (9.3%) | 39 (90.7%) |
| Arts, Media & Entertainment | 0 (0.0%) | 3 (100.0%) |
| Health Diagnosing & Treating | 18 (28.6%) | 45 (71.4%) |
| Health Technologists | 3 (8.1%) | 34 (91.9%) |
| Total (Category) | 64 (37.7%) | 106 (62.4%) |
| Total (Overall) | 360 (50.8%) | 349 (49.2%) |
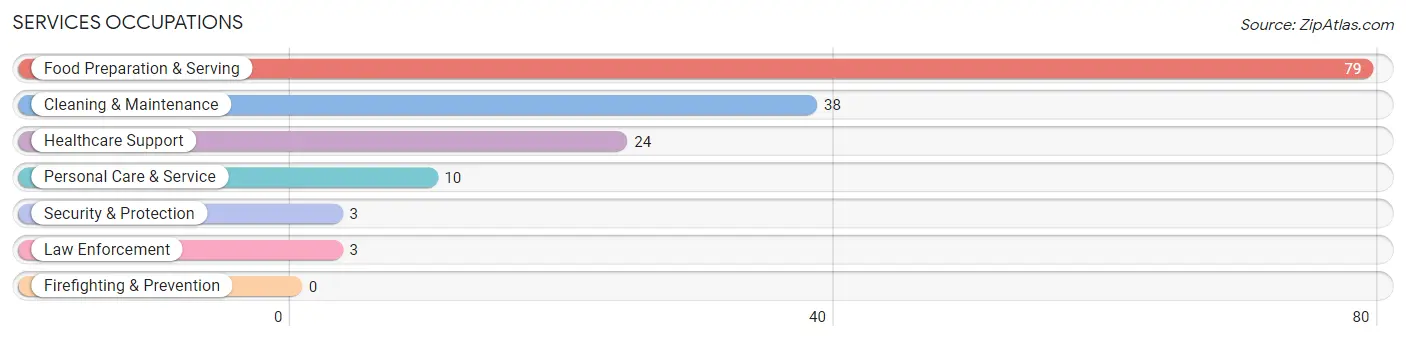
Services Occupations
The most common Services occupations in Oberlin are Food Preparation & Serving (79 | 11.1%), Cleaning & Maintenance (38 | 5.4%), Healthcare Support (24 | 3.4%), Personal Care & Service (10 | 1.4%), and Security & Protection (3 | 0.4%).
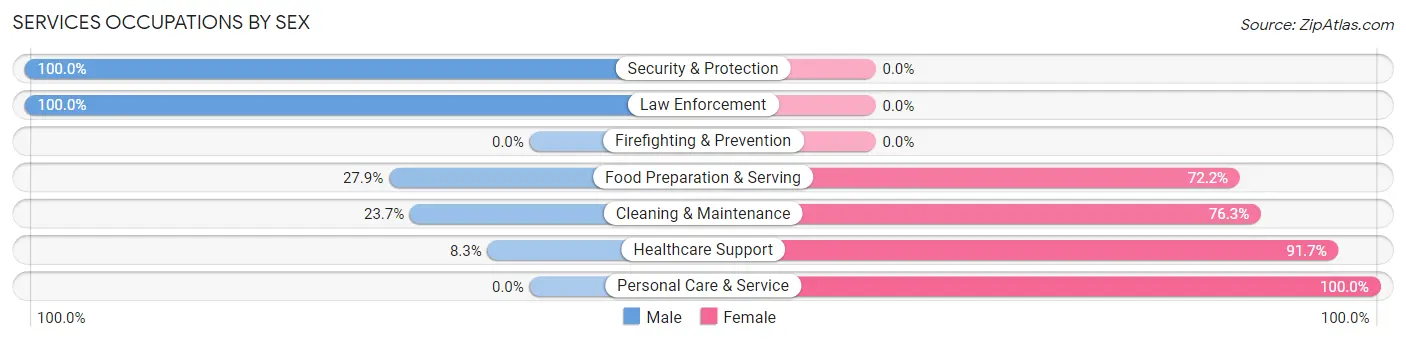
Services Occupations by Sex
Within the Services occupations in Oberlin, the most male-oriented occupations are Security & Protection (100.0%), Law Enforcement (100.0%), and Food Preparation & Serving (27.9%), while the most female-oriented occupations are Personal Care & Service (100.0%), Healthcare Support (91.7%), and Cleaning & Maintenance (76.3%).
| Occupation | Male | Female |
| Healthcare Support | 2 (8.3%) | 22 (91.7%) |
| Security & Protection | 3 (100.0%) | 0 (0.0%) |
| Firefighting & Prevention | 0 (0.0%) | 0 (0.0%) |
| Law Enforcement | 3 (100.0%) | 0 (0.0%) |
| Food Preparation & Serving | 22 (27.9%) | 57 (72.2%) |
| Cleaning & Maintenance | 9 (23.7%) | 29 (76.3%) |
| Personal Care & Service | 0 (0.0%) | 10 (100.0%) |
| Total (Category) | 36 (23.4%) | 118 (76.6%) |
| Total (Overall) | 360 (50.8%) | 349 (49.2%) |
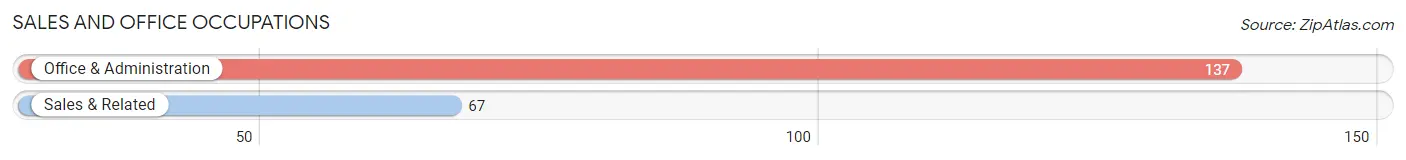
Sales and Office Occupations
The most common Sales and Office occupations in Oberlin are Office & Administration (137 | 19.3%), and Sales & Related (67 | 9.5%).
Sales and Office Occupations by Sex
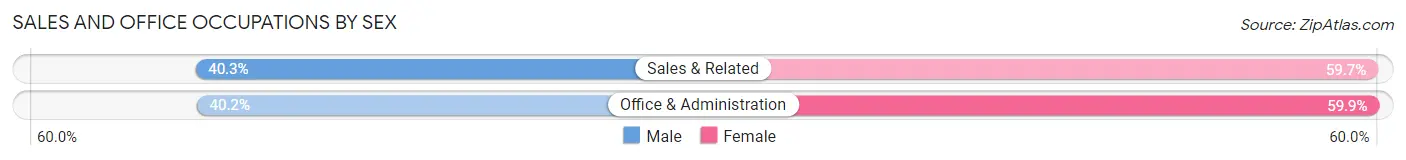
| Occupation | Male | Female |
| Sales & Related | 27 (40.3%) | 40 (59.7%) |
| Office & Administration | 55 (40.2%) | 82 (59.9%) |
| Total (Category) | 82 (40.2%) | 122 (59.8%) |
| Total (Overall) | 360 (50.8%) | 349 (49.2%) |
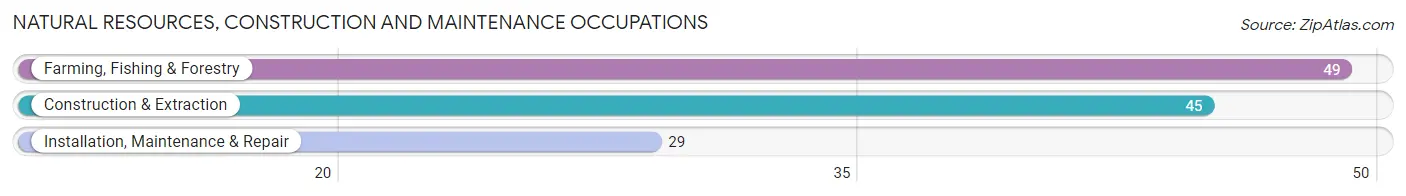
Natural Resources, Construction and Maintenance Occupations
The most common Natural Resources, Construction and Maintenance occupations in Oberlin are Farming, Fishing & Forestry (49 | 6.9%), Construction & Extraction (45 | 6.4%), and Installation, Maintenance & Repair (29 | 4.1%).
Natural Resources, Construction and Maintenance Occupations by Sex
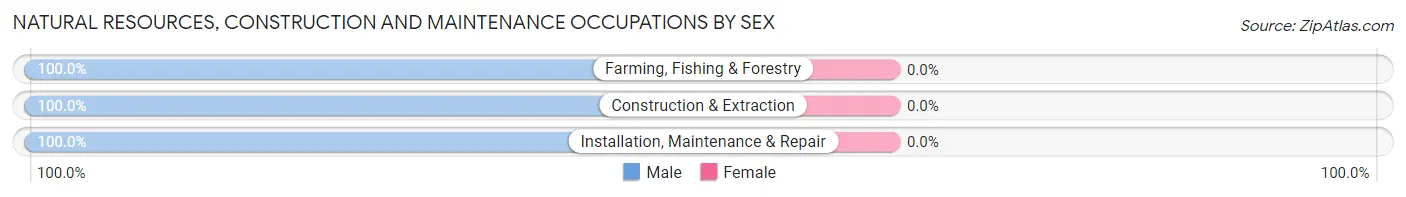
| Occupation | Male | Female |
| Farming, Fishing & Forestry | 49 (100.0%) | 0 (0.0%) |
| Construction & Extraction | 45 (100.0%) | 0 (0.0%) |
| Installation, Maintenance & Repair | 29 (100.0%) | 0 (0.0%) |
| Total (Category) | 123 (100.0%) | 0 (0.0%) |
| Total (Overall) | 360 (50.8%) | 349 (49.2%) |
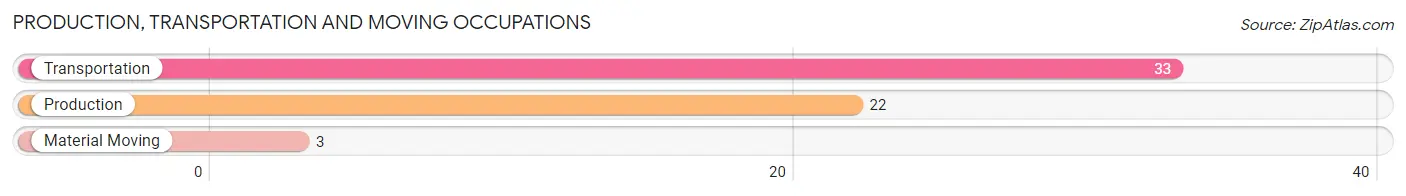
Production, Transportation and Moving Occupations
The most common Production, Transportation and Moving occupations in Oberlin are Transportation (33 | 4.6%), Production (22 | 3.1%), and Material Moving (3 | 0.4%).
Production, Transportation and Moving Occupations by Sex
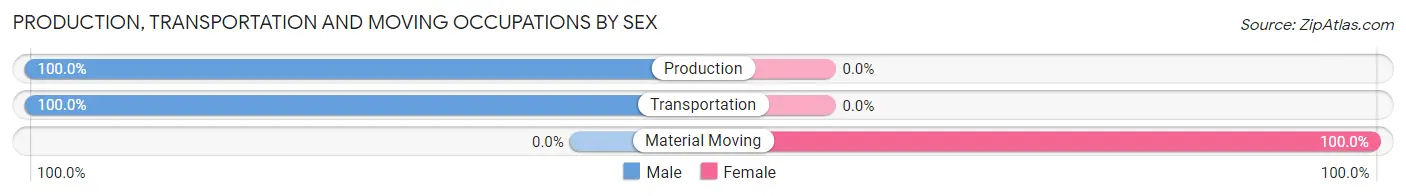
| Occupation | Male | Female |
| Production | 22 (100.0%) | 0 (0.0%) |
| Transportation | 33 (100.0%) | 0 (0.0%) |
| Material Moving | 0 (0.0%) | 3 (100.0%) |
| Total (Category) | 55 (94.8%) | 3 (5.2%) |
| Total (Overall) | 360 (50.8%) | 349 (49.2%) |
Employment Industries by Sex in Oberlin
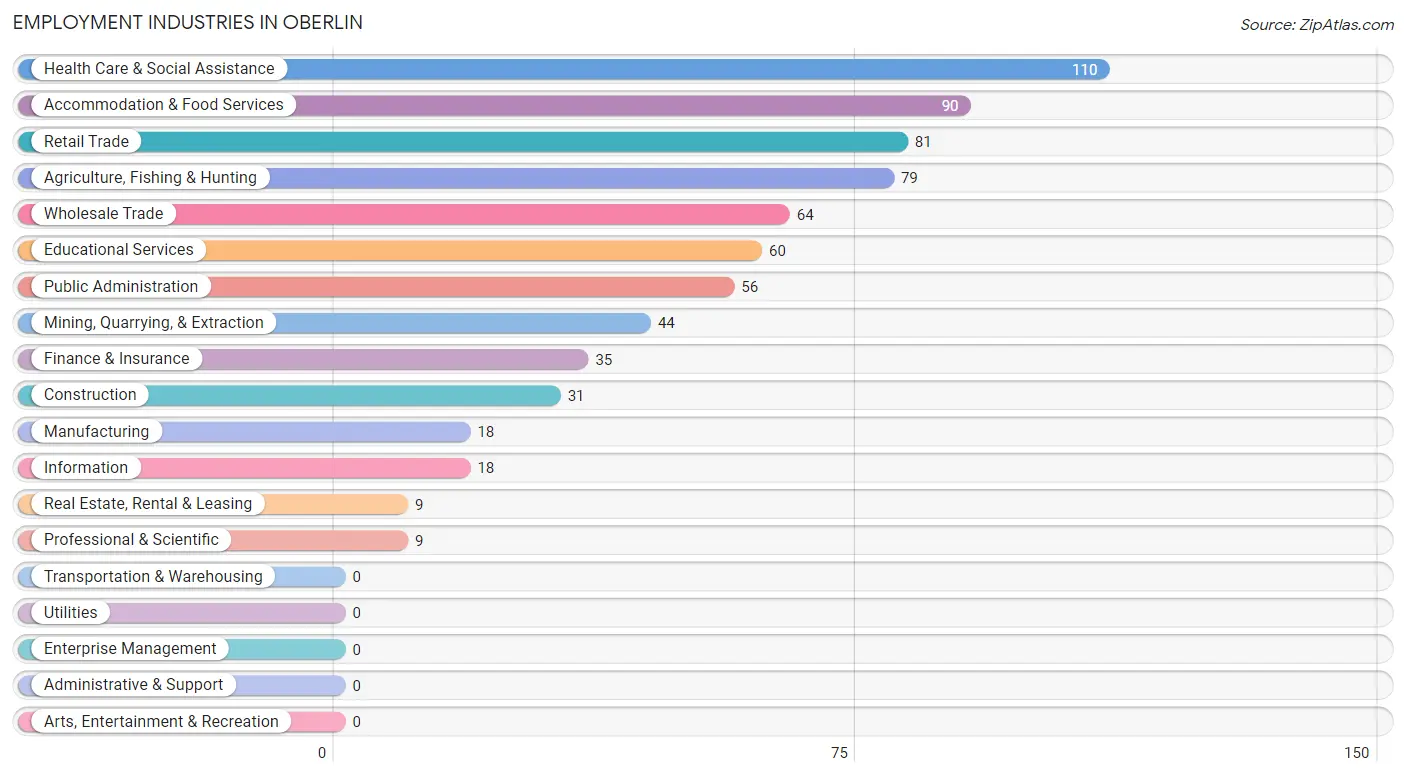
Employment Industries in Oberlin
The major employment industries in Oberlin include Health Care & Social Assistance (110 | 15.5%), Accommodation & Food Services (90 | 12.7%), Retail Trade (81 | 11.4%), Agriculture, Fishing & Hunting (79 | 11.1%), and Wholesale Trade (64 | 9.0%).
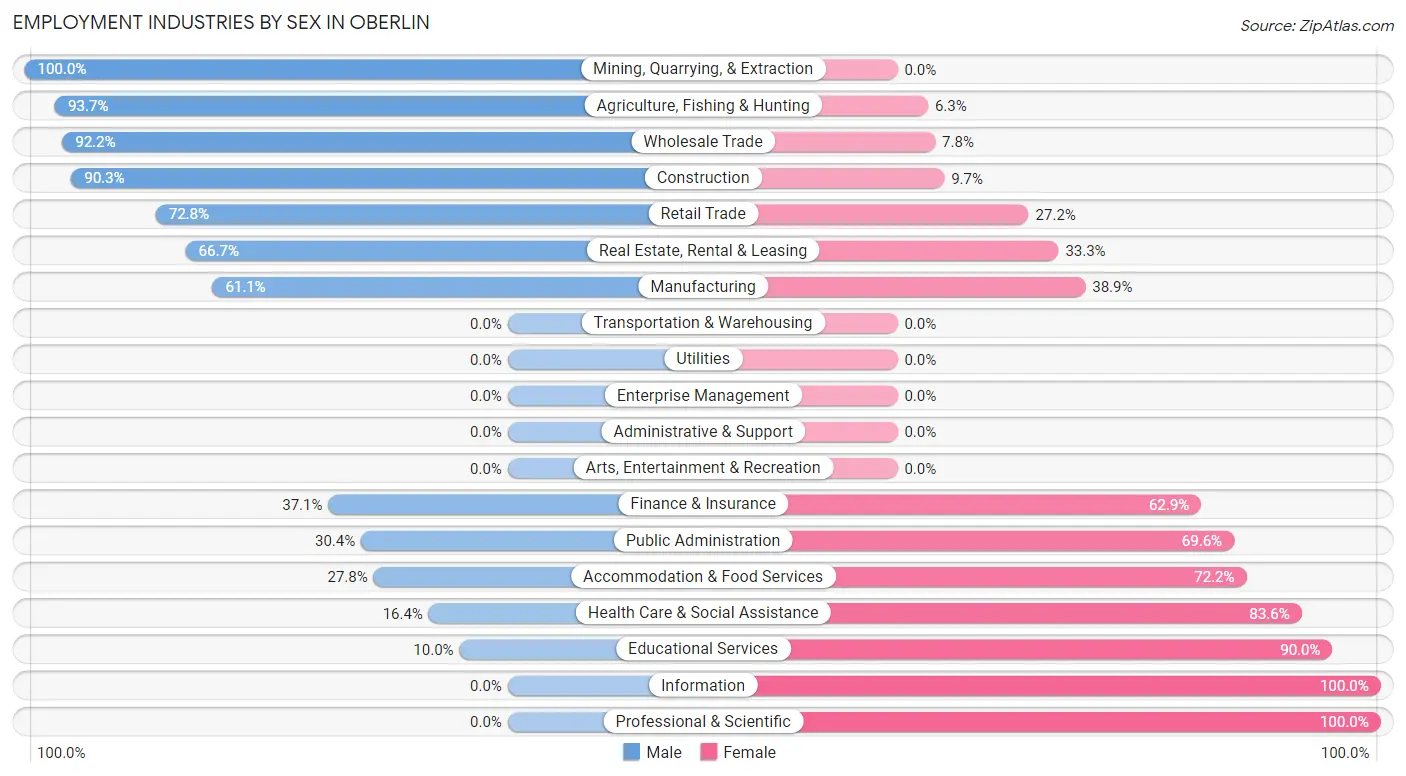
Employment Industries by Sex in Oberlin
The Oberlin industries that see more men than women are Mining, Quarrying, & Extraction (100.0%), Agriculture, Fishing & Hunting (93.7%), and Wholesale Trade (92.2%), whereas the industries that tend to have a higher number of women are Information (100.0%), Professional & Scientific (100.0%), and Educational Services (90.0%).
| Industry | Male | Female |
| Agriculture, Fishing & Hunting | 74 (93.7%) | 5 (6.3%) |
| Mining, Quarrying, & Extraction | 44 (100.0%) | 0 (0.0%) |
| Construction | 28 (90.3%) | 3 (9.7%) |
| Manufacturing | 11 (61.1%) | 7 (38.9%) |
| Wholesale Trade | 59 (92.2%) | 5 (7.8%) |
| Retail Trade | 59 (72.8%) | 22 (27.2%) |
| Transportation & Warehousing | 0 (0.0%) | 0 (0.0%) |
| Utilities | 0 (0.0%) | 0 (0.0%) |
| Information | 0 (0.0%) | 18 (100.0%) |
| Finance & Insurance | 13 (37.1%) | 22 (62.9%) |
| Real Estate, Rental & Leasing | 6 (66.7%) | 3 (33.3%) |
| Professional & Scientific | 0 (0.0%) | 9 (100.0%) |
| Enterprise Management | 0 (0.0%) | 0 (0.0%) |
| Administrative & Support | 0 (0.0%) | 0 (0.0%) |
| Educational Services | 6 (10.0%) | 54 (90.0%) |
| Health Care & Social Assistance | 18 (16.4%) | 92 (83.6%) |
| Arts, Entertainment & Recreation | 0 (0.0%) | 0 (0.0%) |
| Accommodation & Food Services | 25 (27.8%) | 65 (72.2%) |
| Public Administration | 17 (30.4%) | 39 (69.6%) |
| Total | 360 (50.8%) | 349 (49.2%) |
Education in Oberlin
School Enrollment in Oberlin
The most common levels of schooling among the 289 students in Oberlin are elementary school (93 | 32.2%), high school (88 | 30.4%), and middle school (43 | 14.9%).
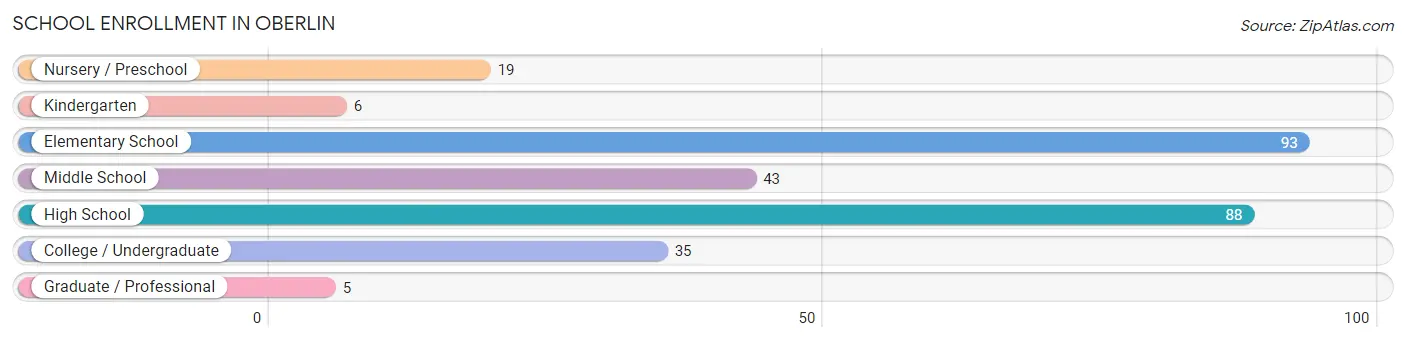
| School Level | # Students | % Students |
| Nursery / Preschool | 19 | 6.6% |
| Kindergarten | 6 | 2.1% |
| Elementary School | 93 | 32.2% |
| Middle School | 43 | 14.9% |
| High School | 88 | 30.4% |
| College / Undergraduate | 35 | 12.1% |
| Graduate / Professional | 5 | 1.7% |
| Total | 289 | 100.0% |
School Enrollment by Age by Funding Source in Oberlin
Out of a total of 289 students who are enrolled in schools in Oberlin, 6 (2.1%) attend a private institution, while the remaining 283 (97.9%) are enrolled in public schools. The age group of 5 to 9 year old has the highest likelihood of being enrolled in private schools, with 6 (6.2% in the age bracket) enrolled. Conversely, the age group of 3 to 4 year olds has the lowest likelihood of being enrolled in a private school, with 12 (100.0% in the age bracket) attending a public institution.
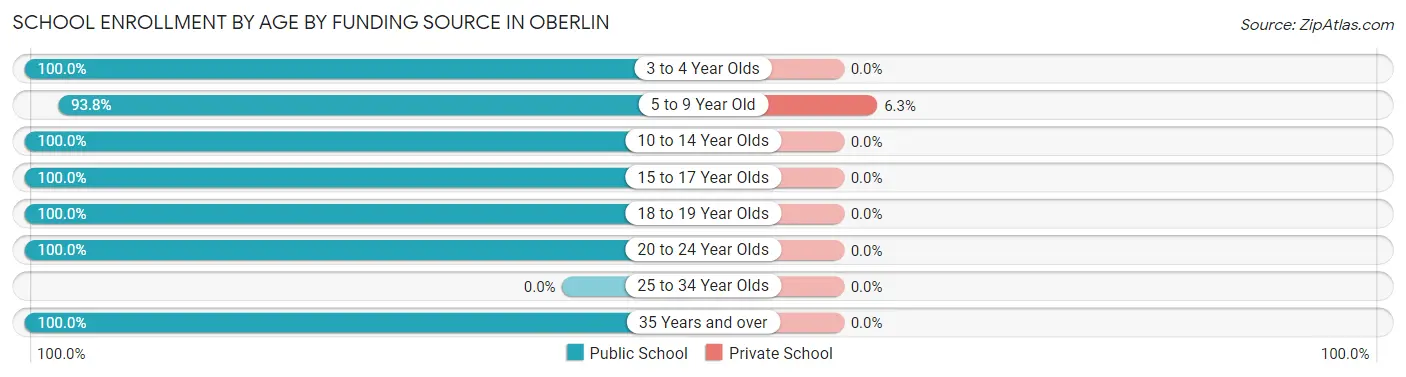
| Age Bracket | Public School | Private School |
| 3 to 4 Year Olds | 12 (100.0%) | 0 (0.0%) |
| 5 to 9 Year Old | 90 (93.8%) | 6 (6.2%) |
| 10 to 14 Year Olds | 73 (100.0%) | 0 (0.0%) |
| 15 to 17 Year Olds | 68 (100.0%) | 0 (0.0%) |
| 18 to 19 Year Olds | 1 (100.0%) | 0 (0.0%) |
| 20 to 24 Year Olds | 1 (100.0%) | 0 (0.0%) |
| 25 to 34 Year Olds | 0 (0.0%) | 0 (0.0%) |
| 35 Years and over | 38 (100.0%) | 0 (0.0%) |
| Total | 283 (97.9%) | 6 (2.1%) |
Educational Attainment by Field of Study in Oberlin
Education (68 | 21.3%), bio, nature & agricultural (58 | 18.2%), science & technology (51 | 16.0%), business (38 | 11.9%), and arts & humanities (35 | 11.0%) are the most common fields of study among 319 individuals in Oberlin who have obtained a bachelor's degree or higher.
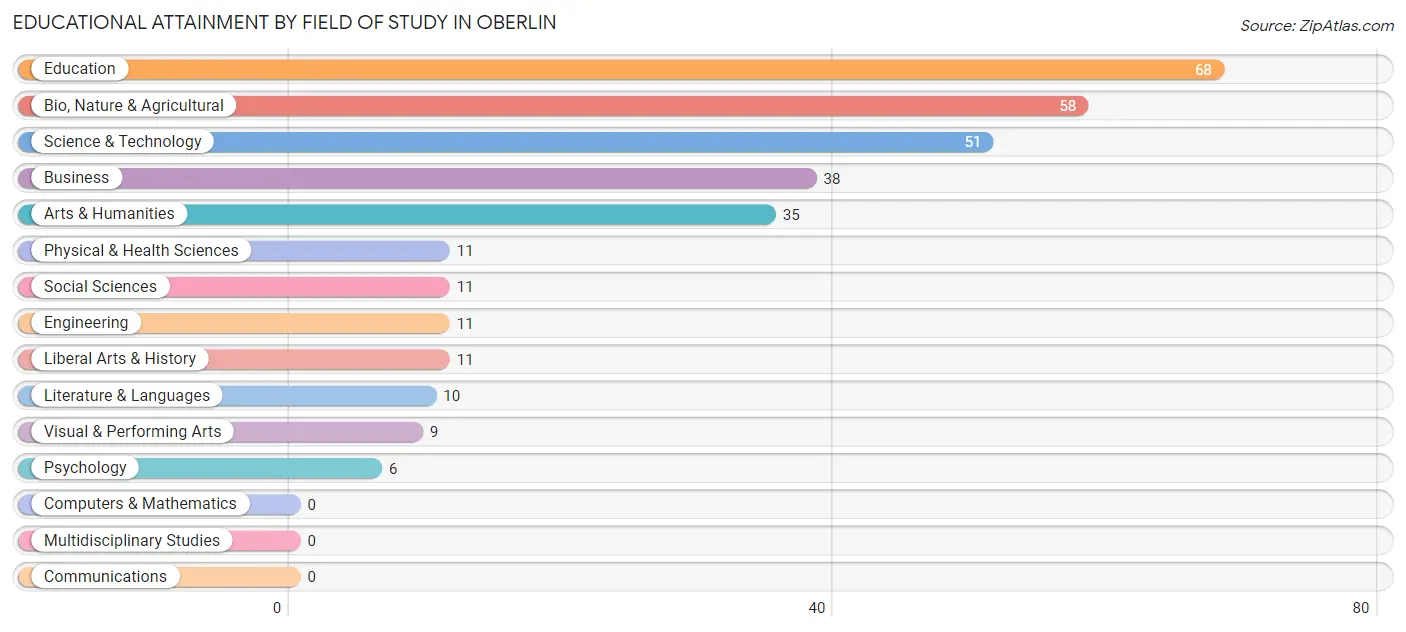
| Field of Study | # Graduates | % Graduates |
| Computers & Mathematics | 0 | 0.0% |
| Bio, Nature & Agricultural | 58 | 18.2% |
| Physical & Health Sciences | 11 | 3.5% |
| Psychology | 6 | 1.9% |
| Social Sciences | 11 | 3.5% |
| Engineering | 11 | 3.5% |
| Multidisciplinary Studies | 0 | 0.0% |
| Science & Technology | 51 | 16.0% |
| Business | 38 | 11.9% |
| Education | 68 | 21.3% |
| Literature & Languages | 10 | 3.1% |
| Liberal Arts & History | 11 | 3.5% |
| Visual & Performing Arts | 9 | 2.8% |
| Communications | 0 | 0.0% |
| Arts & Humanities | 35 | 11.0% |
| Total | 319 | 100.0% |
Transportation & Commute in Oberlin
Vehicle Availability by Sex in Oberlin
The most prevalent vehicle ownership categories in Oberlin are males with 2 vehicles (140, accounting for 38.9%) and females with 2 vehicles (136, making up 40.1%).
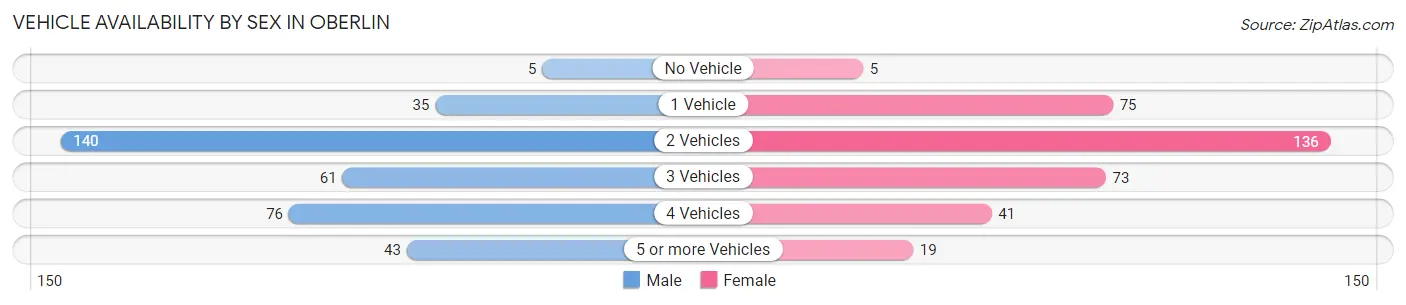
| Vehicles Available | Male | Female |
| No Vehicle | 5 (1.4%) | 5 (1.4%) |
| 1 Vehicle | 35 (9.7%) | 75 (21.5%) |
| 2 Vehicles | 140 (38.9%) | 136 (39.0%) |
| 3 Vehicles | 61 (16.9%) | 73 (20.9%) |
| 4 Vehicles | 76 (21.1%) | 41 (11.7%) |
| 5 or more Vehicles | 43 (11.9%) | 19 (5.4%) |
| Total | 360 (100.0%) | 349 (100.0%) |
Commute Time in Oberlin
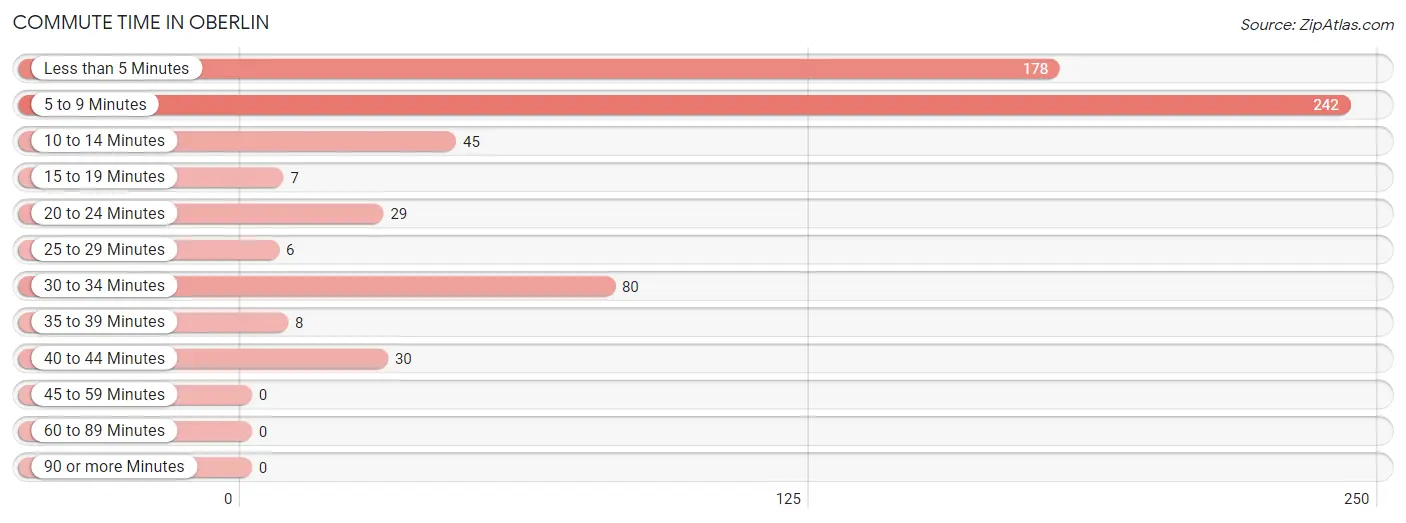
The most frequently occuring commute durations in Oberlin are 5 to 9 minutes (242 commuters, 38.7%), less than 5 minutes (178 commuters, 28.5%), and 30 to 34 minutes (80 commuters, 12.8%).
| Commute Time | # Commuters | % Commuters |
| Less than 5 Minutes | 178 | 28.5% |
| 5 to 9 Minutes | 242 | 38.7% |
| 10 to 14 Minutes | 45 | 7.2% |
| 15 to 19 Minutes | 7 | 1.1% |
| 20 to 24 Minutes | 29 | 4.6% |
| 25 to 29 Minutes | 6 | 1.0% |
| 30 to 34 Minutes | 80 | 12.8% |
| 35 to 39 Minutes | 8 | 1.3% |
| 40 to 44 Minutes | 30 | 4.8% |
| 45 to 59 Minutes | 0 | 0.0% |
| 60 to 89 Minutes | 0 | 0.0% |
| 90 or more Minutes | 0 | 0.0% |
Commute Time by Sex in Oberlin
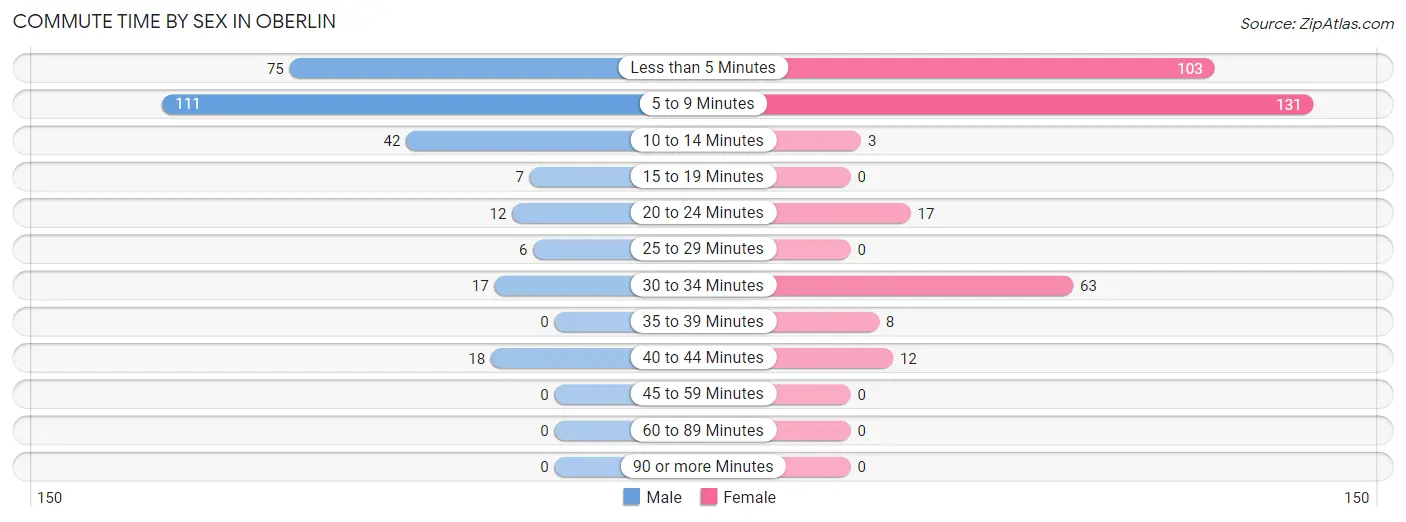
The most common commute times in Oberlin are 5 to 9 minutes (111 commuters, 38.5%) for males and 5 to 9 minutes (131 commuters, 38.9%) for females.
| Commute Time | Male | Female |
| Less than 5 Minutes | 75 (26.0%) | 103 (30.6%) |
| 5 to 9 Minutes | 111 (38.5%) | 131 (38.9%) |
| 10 to 14 Minutes | 42 (14.6%) | 3 (0.9%) |
| 15 to 19 Minutes | 7 (2.4%) | 0 (0.0%) |
| 20 to 24 Minutes | 12 (4.2%) | 17 (5.0%) |
| 25 to 29 Minutes | 6 (2.1%) | 0 (0.0%) |
| 30 to 34 Minutes | 17 (5.9%) | 63 (18.7%) |
| 35 to 39 Minutes | 0 (0.0%) | 8 (2.4%) |
| 40 to 44 Minutes | 18 (6.2%) | 12 (3.6%) |
| 45 to 59 Minutes | 0 (0.0%) | 0 (0.0%) |
| 60 to 89 Minutes | 0 (0.0%) | 0 (0.0%) |
| 90 or more Minutes | 0 (0.0%) | 0 (0.0%) |
Time of Departure to Work by Sex in Oberlin
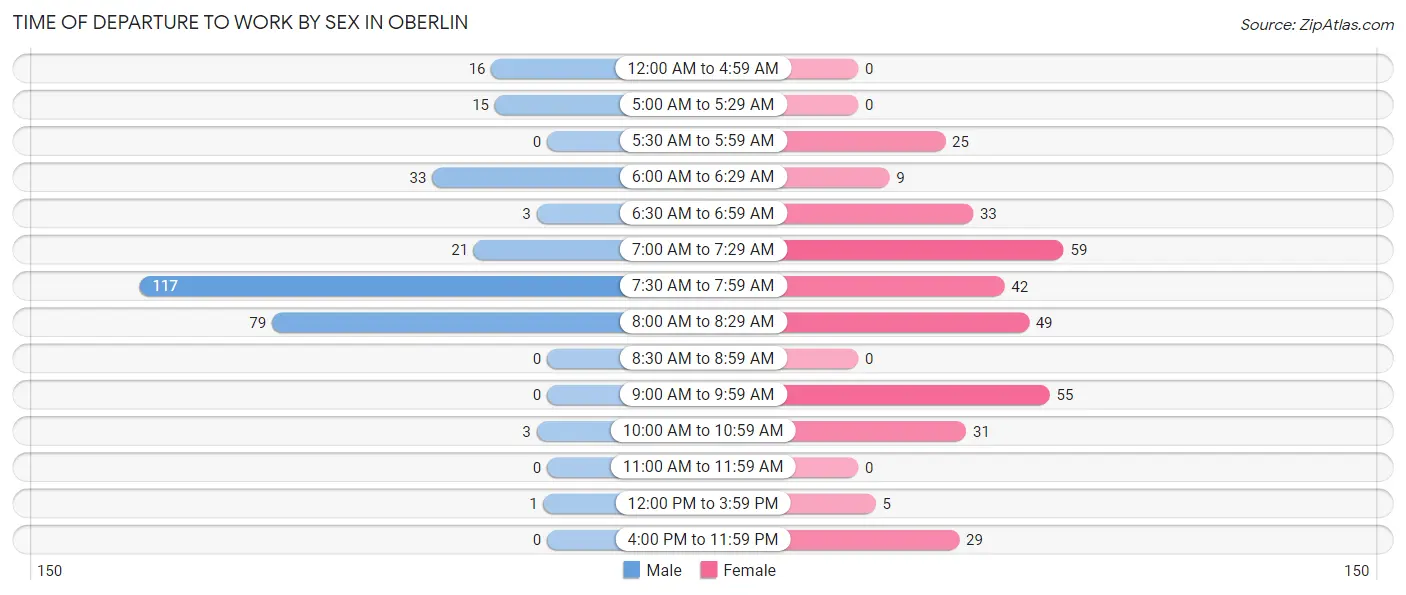
The most frequent times of departure to work in Oberlin are 7:30 AM to 7:59 AM (117, 40.6%) for males and 7:00 AM to 7:29 AM (59, 17.5%) for females.
| Time of Departure | Male | Female |
| 12:00 AM to 4:59 AM | 16 (5.6%) | 0 (0.0%) |
| 5:00 AM to 5:29 AM | 15 (5.2%) | 0 (0.0%) |
| 5:30 AM to 5:59 AM | 0 (0.0%) | 25 (7.4%) |
| 6:00 AM to 6:29 AM | 33 (11.5%) | 9 (2.7%) |
| 6:30 AM to 6:59 AM | 3 (1.0%) | 33 (9.8%) |
| 7:00 AM to 7:29 AM | 21 (7.3%) | 59 (17.5%) |
| 7:30 AM to 7:59 AM | 117 (40.6%) | 42 (12.5%) |
| 8:00 AM to 8:29 AM | 79 (27.4%) | 49 (14.5%) |
| 8:30 AM to 8:59 AM | 0 (0.0%) | 0 (0.0%) |
| 9:00 AM to 9:59 AM | 0 (0.0%) | 55 (16.3%) |
| 10:00 AM to 10:59 AM | 3 (1.0%) | 31 (9.2%) |
| 11:00 AM to 11:59 AM | 0 (0.0%) | 0 (0.0%) |
| 12:00 PM to 3:59 PM | 1 (0.4%) | 5 (1.5%) |
| 4:00 PM to 11:59 PM | 0 (0.0%) | 29 (8.6%) |
| Total | 288 (100.0%) | 337 (100.0%) |
Housing Occupancy in Oberlin
Occupancy by Ownership in Oberlin
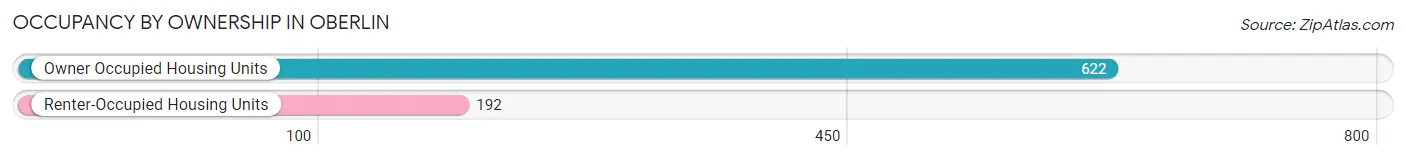
Of the total 814 dwellings in Oberlin, owner-occupied units account for 622 (76.4%), while renter-occupied units make up 192 (23.6%).
| Occupancy | # Housing Units | % Housing Units |
| Owner Occupied Housing Units | 622 | 76.4% |
| Renter-Occupied Housing Units | 192 | 23.6% |
| Total Occupied Housing Units | 814 | 100.0% |
Occupancy by Household Size in Oberlin
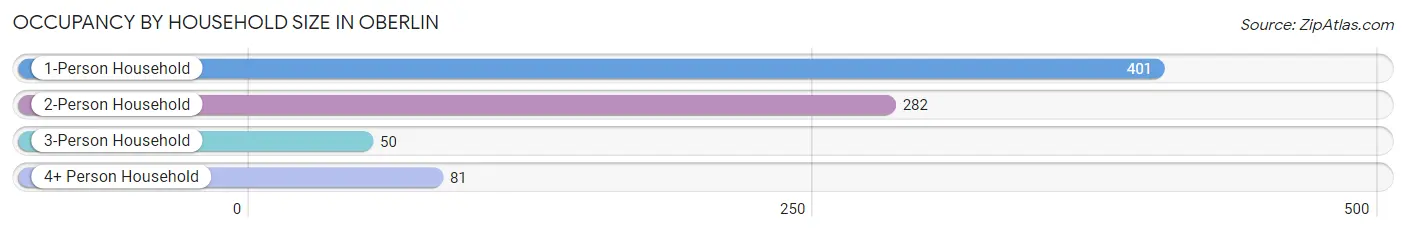
| Household Size | # Housing Units | % Housing Units |
| 1-Person Household | 401 | 49.3% |
| 2-Person Household | 282 | 34.6% |
| 3-Person Household | 50 | 6.1% |
| 4+ Person Household | 81 | 10.0% |
| Total Housing Units | 814 | 100.0% |
Occupancy by Ownership by Household Size in Oberlin
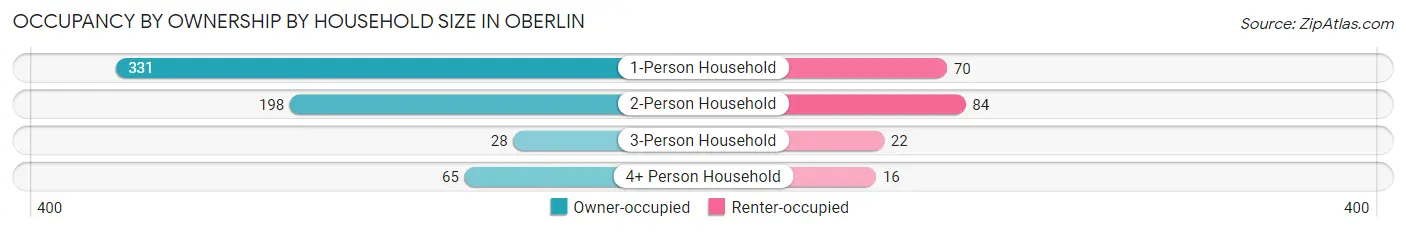
| Household Size | Owner-occupied | Renter-occupied |
| 1-Person Household | 331 (82.5%) | 70 (17.5%) |
| 2-Person Household | 198 (70.2%) | 84 (29.8%) |
| 3-Person Household | 28 (56.0%) | 22 (44.0%) |
| 4+ Person Household | 65 (80.2%) | 16 (19.8%) |
| Total Housing Units | 622 (76.4%) | 192 (23.6%) |
Occupancy by Educational Attainment in Oberlin
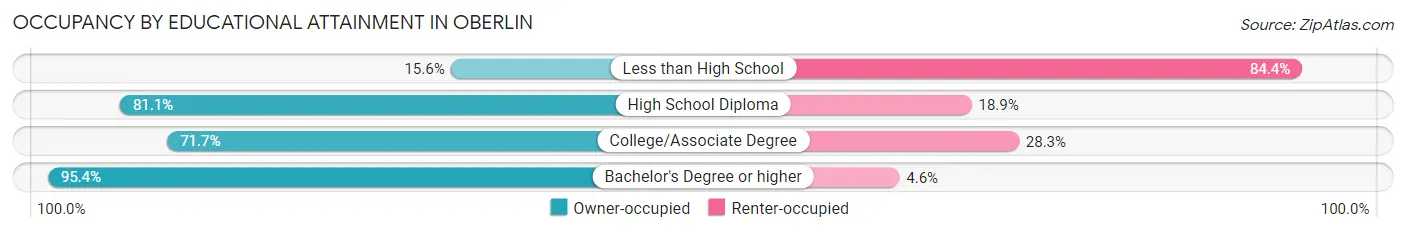
| Household Size | Owner-occupied | Renter-occupied |
| Less than High School | 7 (15.6%) | 38 (84.4%) |
| High School Diploma | 193 (81.1%) | 45 (18.9%) |
| College/Associate Degree | 256 (71.7%) | 101 (28.3%) |
| Bachelor's Degree or higher | 166 (95.4%) | 8 (4.6%) |
Occupancy by Age of Householder in Oberlin
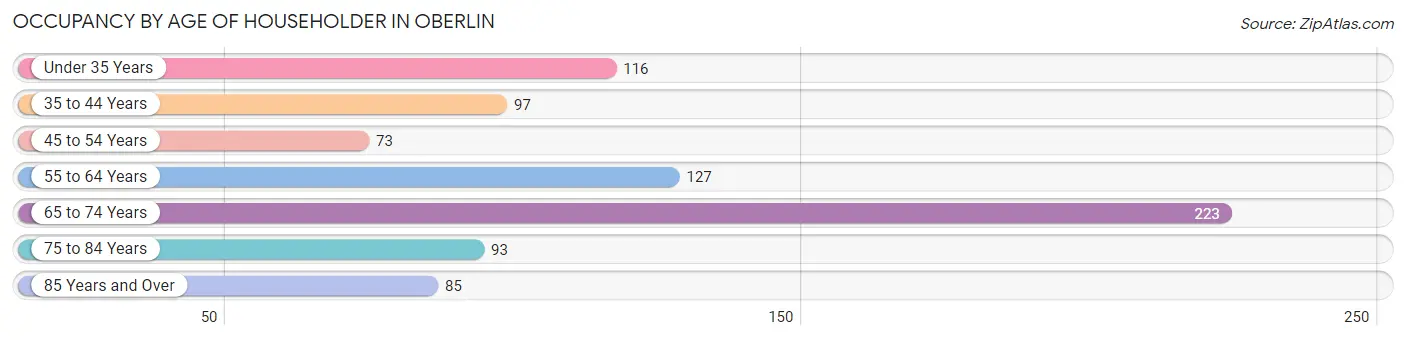
| Age Bracket | # Households | % Households |
| Under 35 Years | 116 | 14.2% |
| 35 to 44 Years | 97 | 11.9% |
| 45 to 54 Years | 73 | 9.0% |
| 55 to 64 Years | 127 | 15.6% |
| 65 to 74 Years | 223 | 27.4% |
| 75 to 84 Years | 93 | 11.4% |
| 85 Years and Over | 85 | 10.4% |
| Total | 814 | 100.0% |
Housing Finances in Oberlin
Median Income by Occupancy in Oberlin
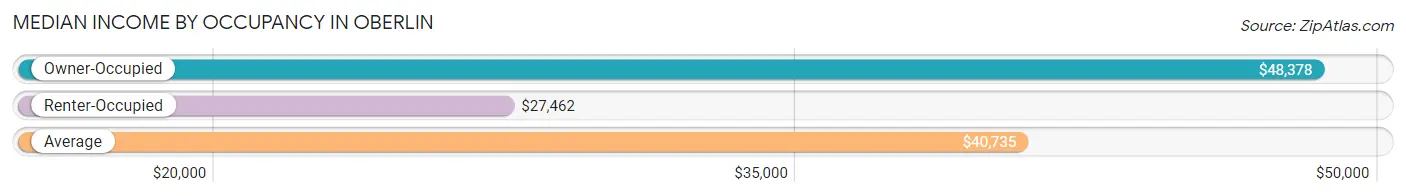
| Occupancy Type | # Households | Median Income |
| Owner-Occupied | 622 (76.4%) | $48,378 |
| Renter-Occupied | 192 (23.6%) | $27,462 |
| Average | 814 (100.0%) | $40,735 |
Occupancy by Householder Income Bracket in Oberlin
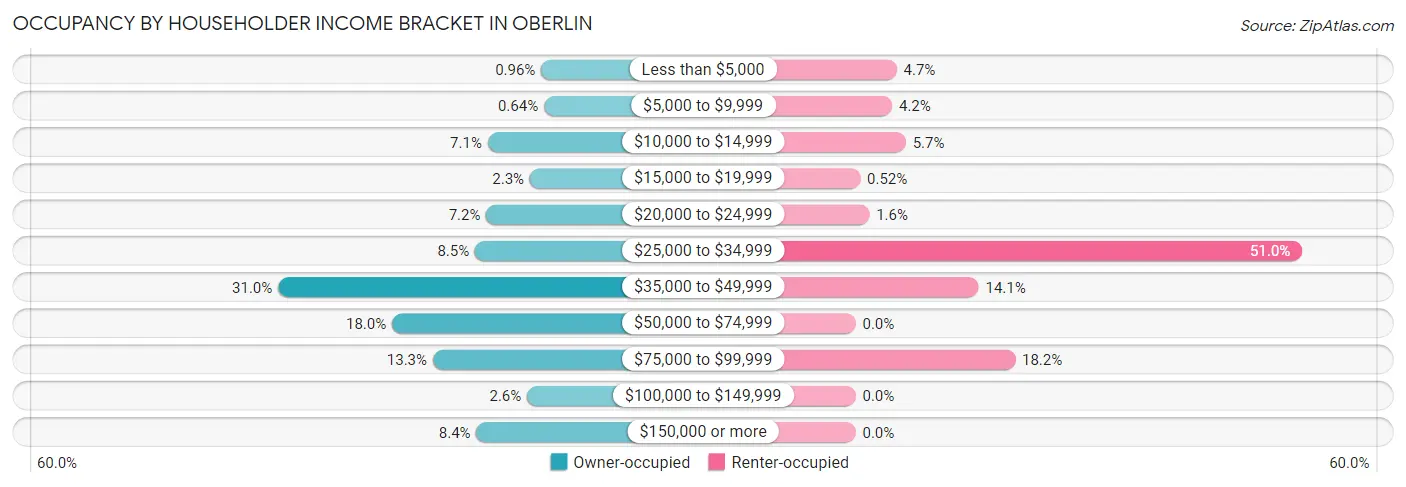
| Income Bracket | Owner-occupied | Renter-occupied |
| Less than $5,000 | 6 (1.0%) | 9 (4.7%) |
| $5,000 to $9,999 | 4 (0.6%) | 8 (4.2%) |
| $10,000 to $14,999 | 44 (7.1%) | 11 (5.7%) |
| $15,000 to $19,999 | 14 (2.2%) | 1 (0.5%) |
| $20,000 to $24,999 | 45 (7.2%) | 3 (1.6%) |
| $25,000 to $34,999 | 53 (8.5%) | 98 (51.0%) |
| $35,000 to $49,999 | 193 (31.0%) | 27 (14.1%) |
| $50,000 to $74,999 | 112 (18.0%) | 0 (0.0%) |
| $75,000 to $99,999 | 83 (13.3%) | 35 (18.2%) |
| $100,000 to $149,999 | 16 (2.6%) | 0 (0.0%) |
| $150,000 or more | 52 (8.4%) | 0 (0.0%) |
| Total | 622 (100.0%) | 192 (100.0%) |
Monthly Housing Cost Tiers in Oberlin
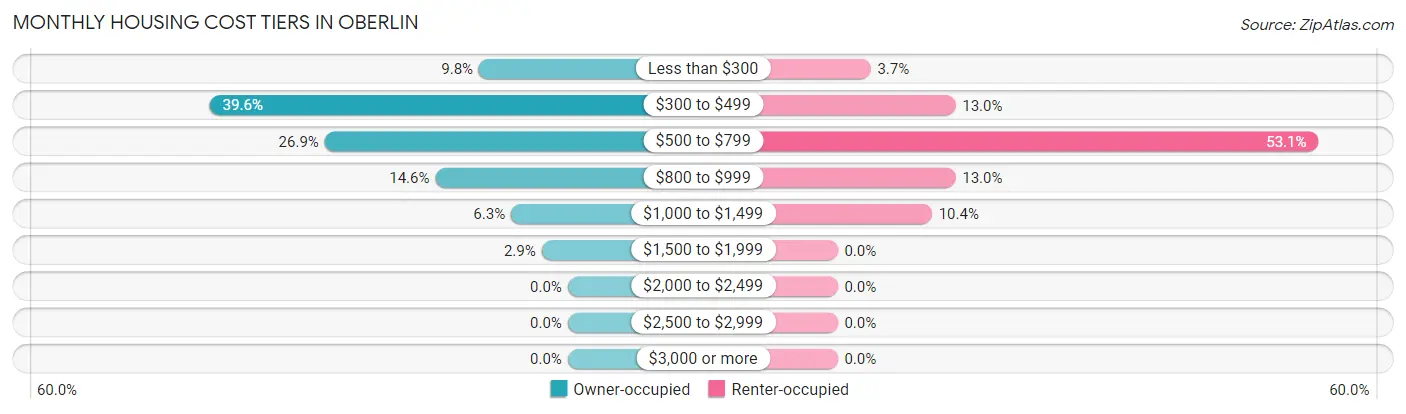
| Monthly Cost | Owner-occupied | Renter-occupied |
| Less than $300 | 61 (9.8%) | 7 (3.6%) |
| $300 to $499 | 246 (39.6%) | 25 (13.0%) |
| $500 to $799 | 167 (26.9%) | 102 (53.1%) |
| $800 to $999 | 91 (14.6%) | 25 (13.0%) |
| $1,000 to $1,499 | 39 (6.3%) | 20 (10.4%) |
| $1,500 to $1,999 | 18 (2.9%) | 0 (0.0%) |
| $2,000 to $2,499 | 0 (0.0%) | 0 (0.0%) |
| $2,500 to $2,999 | 0 (0.0%) | 0 (0.0%) |
| $3,000 or more | 0 (0.0%) | 0 (0.0%) |
| Total | 622 (100.0%) | 192 (100.0%) |
Physical Housing Characteristics in Oberlin
Housing Structures in Oberlin
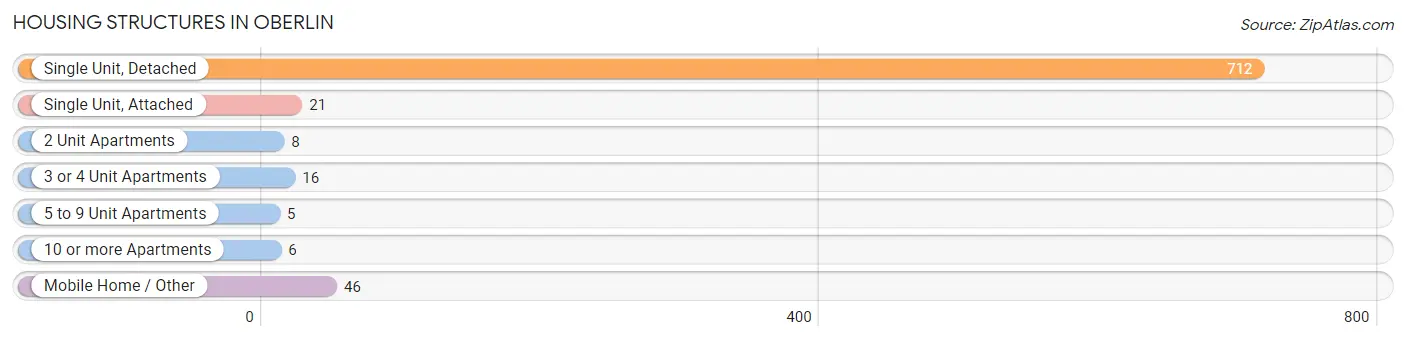
| Structure Type | # Housing Units | % Housing Units |
| Single Unit, Detached | 712 | 87.5% |
| Single Unit, Attached | 21 | 2.6% |
| 2 Unit Apartments | 8 | 1.0% |
| 3 or 4 Unit Apartments | 16 | 2.0% |
| 5 to 9 Unit Apartments | 5 | 0.6% |
| 10 or more Apartments | 6 | 0.7% |
| Mobile Home / Other | 46 | 5.7% |
| Total | 814 | 100.0% |
Housing Structures by Occupancy in Oberlin
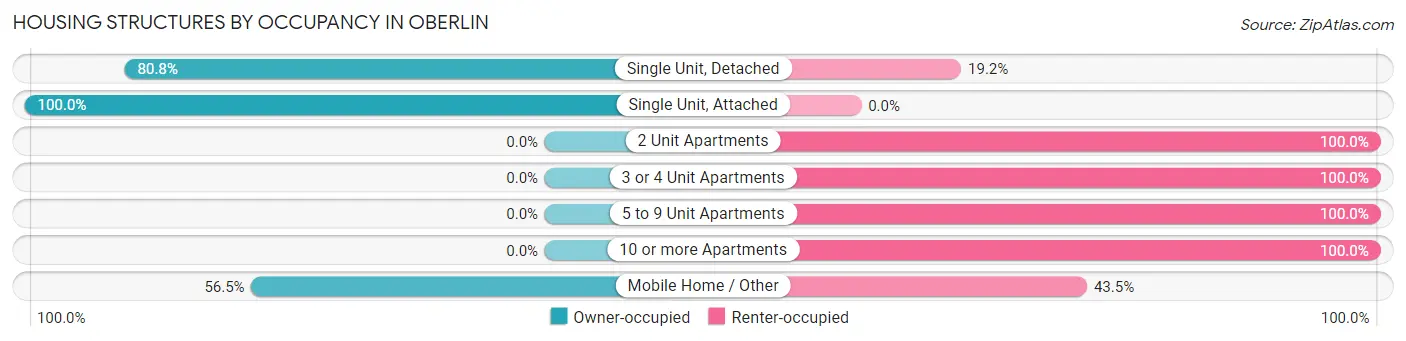
| Structure Type | Owner-occupied | Renter-occupied |
| Single Unit, Detached | 575 (80.8%) | 137 (19.2%) |
| Single Unit, Attached | 21 (100.0%) | 0 (0.0%) |
| 2 Unit Apartments | 0 (0.0%) | 8 (100.0%) |
| 3 or 4 Unit Apartments | 0 (0.0%) | 16 (100.0%) |
| 5 to 9 Unit Apartments | 0 (0.0%) | 5 (100.0%) |
| 10 or more Apartments | 0 (0.0%) | 6 (100.0%) |
| Mobile Home / Other | 26 (56.5%) | 20 (43.5%) |
| Total | 622 (76.4%) | 192 (23.6%) |
Housing Structures by Number of Rooms in Oberlin
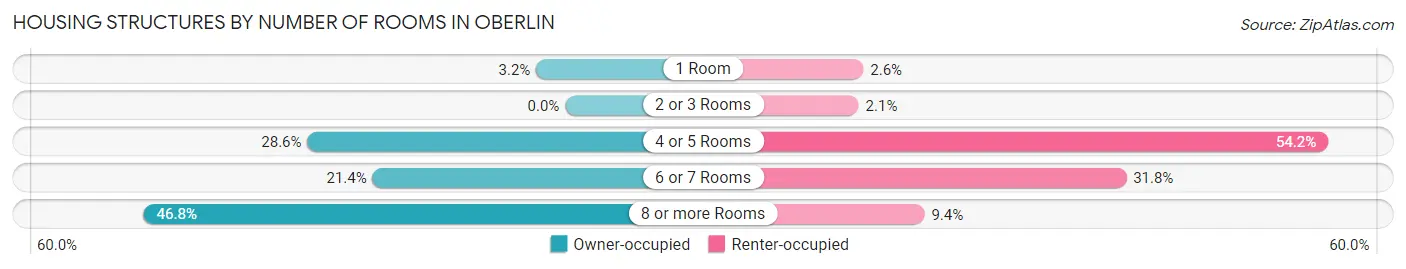
| Number of Rooms | Owner-occupied | Renter-occupied |
| 1 Room | 20 (3.2%) | 5 (2.6%) |
| 2 or 3 Rooms | 0 (0.0%) | 4 (2.1%) |
| 4 or 5 Rooms | 178 (28.6%) | 104 (54.2%) |
| 6 or 7 Rooms | 133 (21.4%) | 61 (31.8%) |
| 8 or more Rooms | 291 (46.8%) | 18 (9.4%) |
| Total | 622 (100.0%) | 192 (100.0%) |
Housing Structure by Heating Type in Oberlin
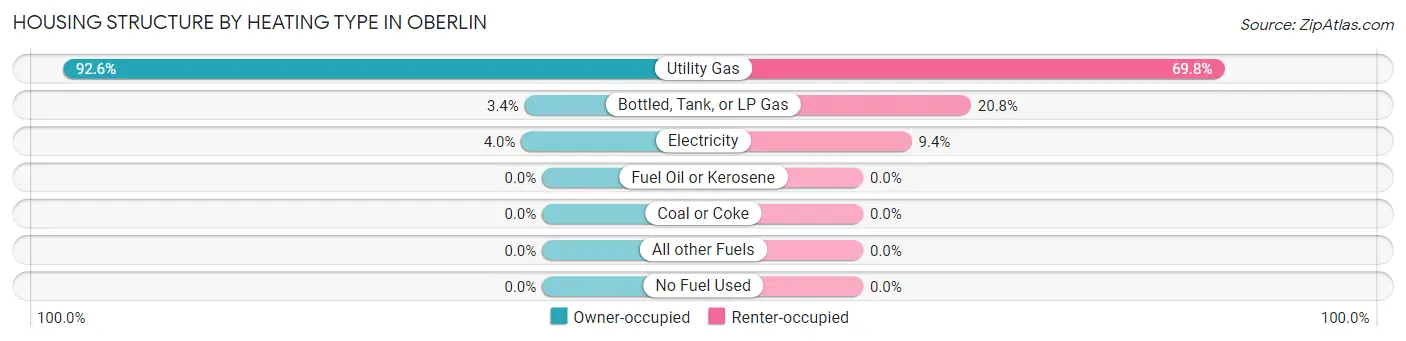
| Heating Type | Owner-occupied | Renter-occupied |
| Utility Gas | 576 (92.6%) | 134 (69.8%) |
| Bottled, Tank, or LP Gas | 21 (3.4%) | 40 (20.8%) |
| Electricity | 25 (4.0%) | 18 (9.4%) |
| Fuel Oil or Kerosene | 0 (0.0%) | 0 (0.0%) |
| Coal or Coke | 0 (0.0%) | 0 (0.0%) |
| All other Fuels | 0 (0.0%) | 0 (0.0%) |
| No Fuel Used | 0 (0.0%) | 0 (0.0%) |
| Total | 622 (100.0%) | 192 (100.0%) |
Household Vehicle Usage in Oberlin
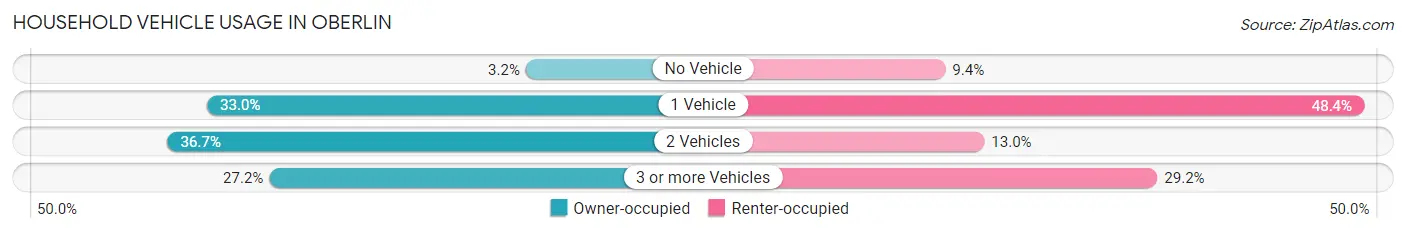
| Vehicles per Household | Owner-occupied | Renter-occupied |
| No Vehicle | 20 (3.2%) | 18 (9.4%) |
| 1 Vehicle | 205 (33.0%) | 93 (48.4%) |
| 2 Vehicles | 228 (36.7%) | 25 (13.0%) |
| 3 or more Vehicles | 169 (27.2%) | 56 (29.2%) |
| Total | 622 (100.0%) | 192 (100.0%) |
Real Estate & Mortgages in Oberlin
Real Estate and Mortgage Overview in Oberlin
| Characteristic | Without Mortgage | With Mortgage |
| Housing Units | 415 | 207 |
| Median Property Value | $73,600 | $58,000 |
| Median Household Income | $47,966 | $22 |
| Monthly Housing Costs | $445 | $0 |
| Real Estate Taxes | $1,459 | $0 |
Property Value by Mortgage Status in Oberlin
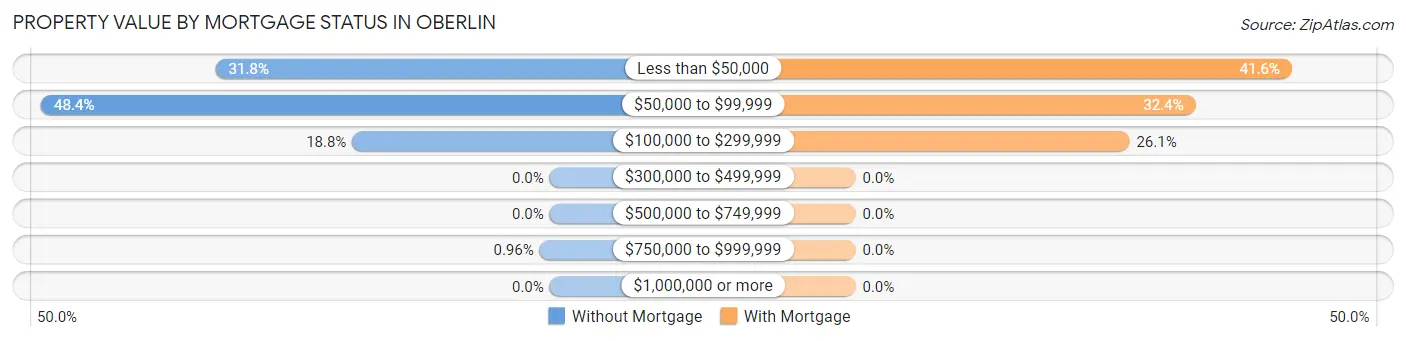
| Property Value | Without Mortgage | With Mortgage |
| Less than $50,000 | 132 (31.8%) | 86 (41.5%) |
| $50,000 to $99,999 | 201 (48.4%) | 67 (32.4%) |
| $100,000 to $299,999 | 78 (18.8%) | 54 (26.1%) |
| $300,000 to $499,999 | 0 (0.0%) | 0 (0.0%) |
| $500,000 to $749,999 | 0 (0.0%) | 0 (0.0%) |
| $750,000 to $999,999 | 4 (1.0%) | 0 (0.0%) |
| $1,000,000 or more | 0 (0.0%) | 0 (0.0%) |
| Total | 415 (100.0%) | 207 (100.0%) |
Household Income by Mortgage Status in Oberlin
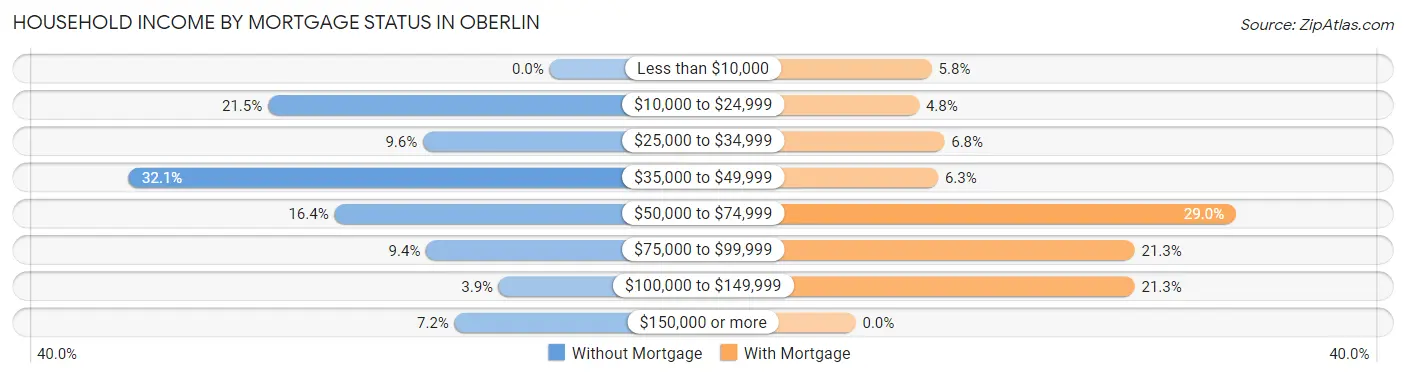
| Household Income | Without Mortgage | With Mortgage |
| Less than $10,000 | 0 (0.0%) | 12 (5.8%) |
| $10,000 to $24,999 | 89 (21.4%) | 10 (4.8%) |
| $25,000 to $34,999 | 40 (9.6%) | 14 (6.8%) |
| $35,000 to $49,999 | 133 (32.1%) | 13 (6.3%) |
| $50,000 to $74,999 | 68 (16.4%) | 60 (29.0%) |
| $75,000 to $99,999 | 39 (9.4%) | 44 (21.3%) |
| $100,000 to $149,999 | 16 (3.9%) | 44 (21.3%) |
| $150,000 or more | 30 (7.2%) | 0 (0.0%) |
| Total | 415 (100.0%) | 207 (100.0%) |
Property Value to Household Income Ratio in Oberlin
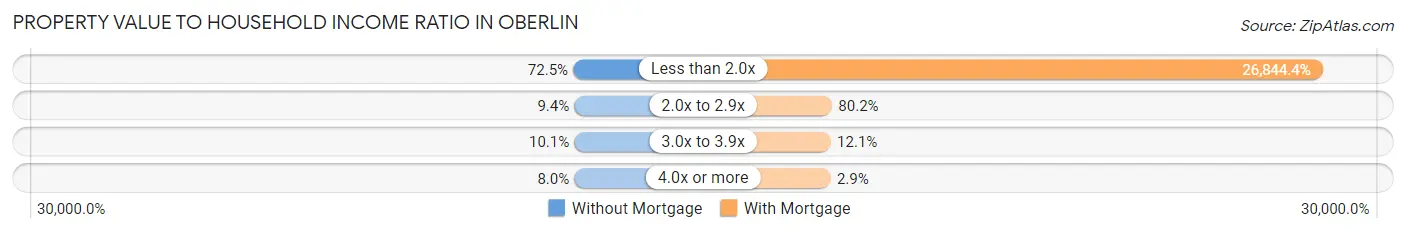
| Value-to-Income Ratio | Without Mortgage | With Mortgage |
| Less than 2.0x | 301 (72.5%) | 55,568 (26,844.4%) |
| 2.0x to 2.9x | 39 (9.4%) | 166 (80.2%) |
| 3.0x to 3.9x | 42 (10.1%) | 25 (12.1%) |
| 4.0x or more | 33 (8.0%) | 6 (2.9%) |
| Total | 415 (100.0%) | 207 (100.0%) |
Real Estate Taxes by Mortgage Status in Oberlin
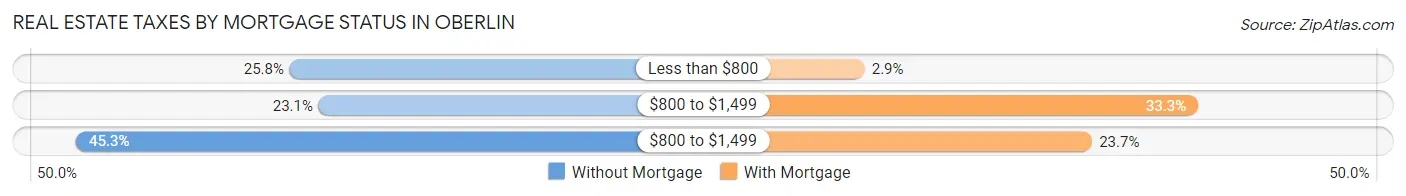
| Property Taxes | Without Mortgage | With Mortgage |
| Less than $800 | 107 (25.8%) | 6 (2.9%) |
| $800 to $1,499 | 96 (23.1%) | 69 (33.3%) |
| $800 to $1,499 | 188 (45.3%) | 49 (23.7%) |
| Total | 415 (100.0%) | 207 (100.0%) |
Health & Disability in Oberlin
Health Insurance Coverage by Age in Oberlin
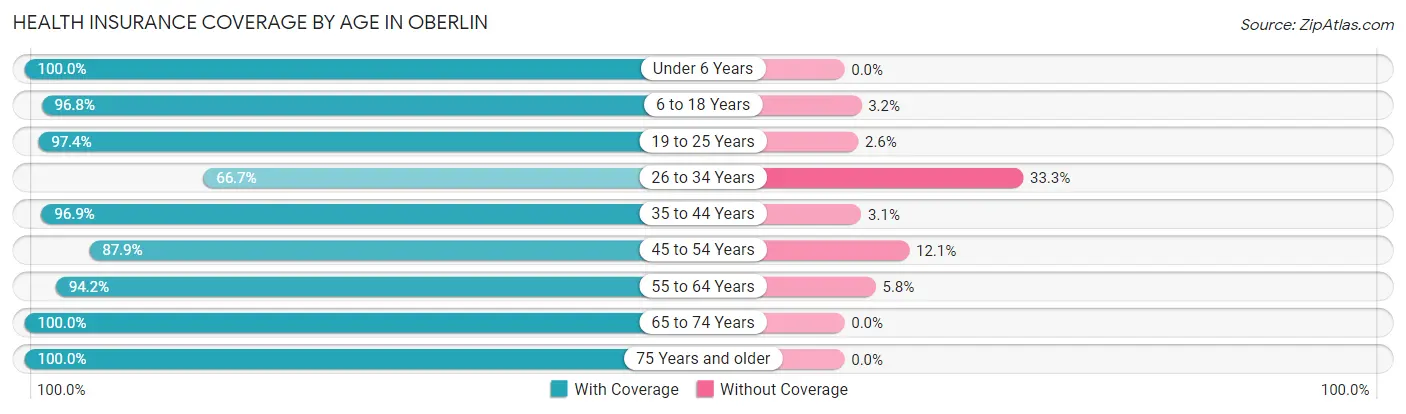
| Age Bracket | With Coverage | Without Coverage |
| Under 6 Years | 99 (100.0%) | 0 (0.0%) |
| 6 to 18 Years | 245 (96.8%) | 8 (3.2%) |
| 19 to 25 Years | 76 (97.4%) | 2 (2.6%) |
| 26 to 34 Years | 72 (66.7%) | 36 (33.3%) |
| 35 to 44 Years | 185 (96.9%) | 6 (3.1%) |
| 45 to 54 Years | 102 (87.9%) | 14 (12.1%) |
| 55 to 64 Years | 210 (94.2%) | 13 (5.8%) |
| 65 to 74 Years | 286 (100.0%) | 0 (0.0%) |
| 75 Years and older | 225 (100.0%) | 0 (0.0%) |
| Total | 1,500 (95.0%) | 79 (5.0%) |
Health Insurance Coverage by Citizenship Status in Oberlin
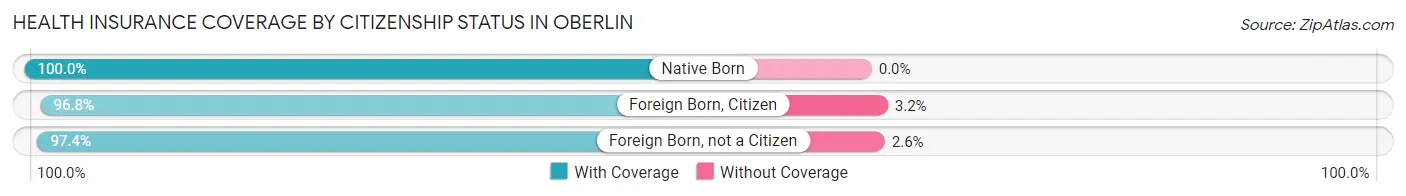
| Citizenship Status | With Coverage | Without Coverage |
| Native Born | 99 (100.0%) | 0 (0.0%) |
| Foreign Born, Citizen | 245 (96.8%) | 8 (3.2%) |
| Foreign Born, not a Citizen | 76 (97.4%) | 2 (2.6%) |
Health Insurance Coverage by Household Income in Oberlin
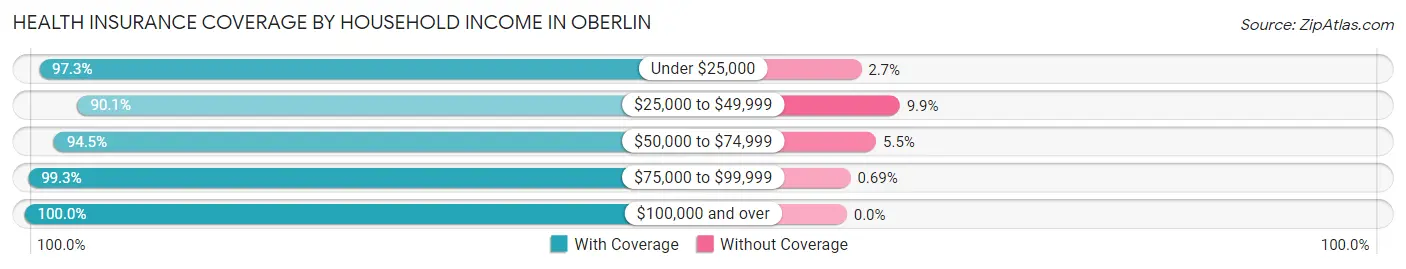
| Household Income | With Coverage | Without Coverage |
| Under $25,000 | 215 (97.3%) | 6 (2.7%) |
| $25,000 to $49,999 | 527 (90.1%) | 58 (9.9%) |
| $50,000 to $74,999 | 224 (94.5%) | 13 (5.5%) |
| $75,000 to $99,999 | 289 (99.3%) | 2 (0.7%) |
| $100,000 and over | 245 (100.0%) | 0 (0.0%) |
Public vs Private Health Insurance Coverage by Age in Oberlin
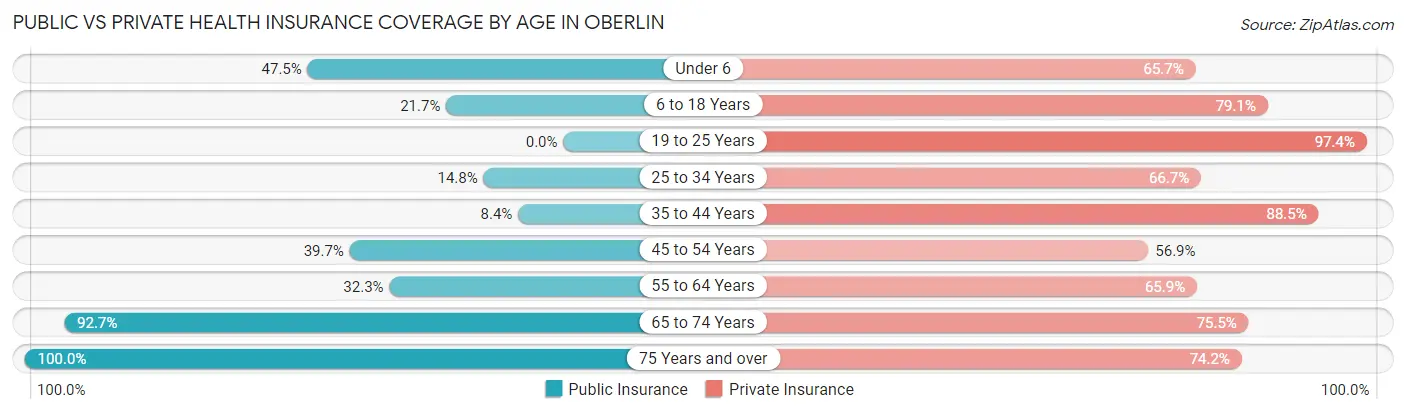
| Age Bracket | Public Insurance | Private Insurance |
| Under 6 | 47 (47.5%) | 65 (65.7%) |
| 6 to 18 Years | 55 (21.7%) | 200 (79.0%) |
| 19 to 25 Years | 0 (0.0%) | 76 (97.4%) |
| 25 to 34 Years | 16 (14.8%) | 72 (66.7%) |
| 35 to 44 Years | 16 (8.4%) | 169 (88.5%) |
| 45 to 54 Years | 46 (39.7%) | 66 (56.9%) |
| 55 to 64 Years | 72 (32.3%) | 147 (65.9%) |
| 65 to 74 Years | 265 (92.7%) | 216 (75.5%) |
| 75 Years and over | 225 (100.0%) | 167 (74.2%) |
| Total | 742 (47.0%) | 1,178 (74.6%) |
Disability Status by Sex by Age in Oberlin
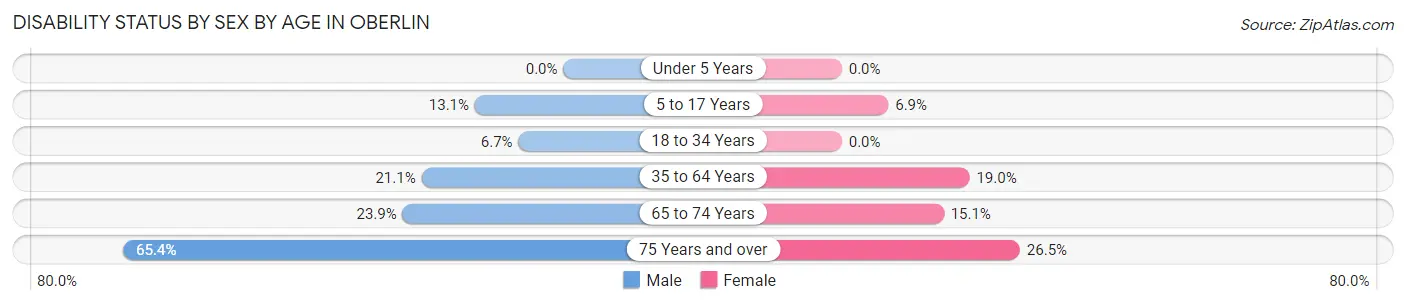
| Age Bracket | Male | Female |
| Under 5 Years | 0 (0.0%) | 0 (0.0%) |
| 5 to 17 Years | 18 (13.1%) | 8 (6.9%) |
| 18 to 34 Years | 7 (6.7%) | 0 (0.0%) |
| 35 to 64 Years | 55 (21.1%) | 51 (19.0%) |
| 65 to 74 Years | 32 (23.9%) | 23 (15.1%) |
| 75 Years and over | 68 (65.4%) | 32 (26.5%) |
Disability Class by Sex by Age in Oberlin
Disability Class: Hearing Difficulty
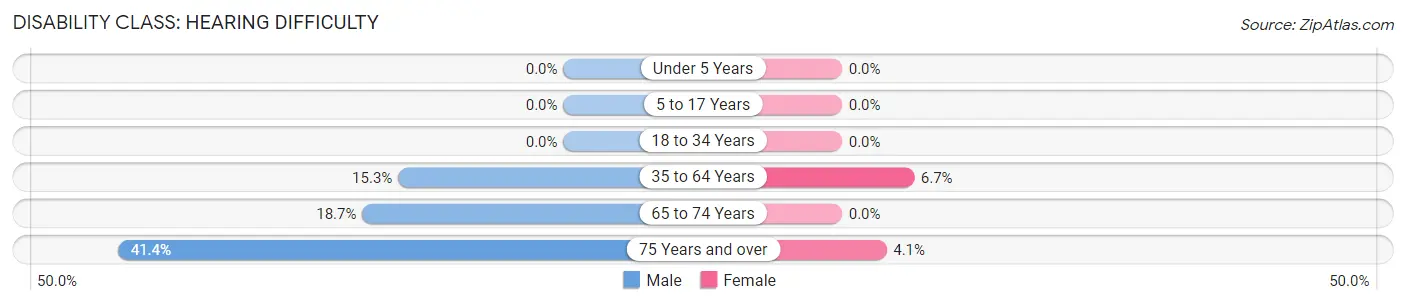
| Age Bracket | Male | Female |
| Under 5 Years | 0 (0.0%) | 0 (0.0%) |
| 5 to 17 Years | 0 (0.0%) | 0 (0.0%) |
| 18 to 34 Years | 0 (0.0%) | 0 (0.0%) |
| 35 to 64 Years | 40 (15.3%) | 18 (6.7%) |
| 65 to 74 Years | 25 (18.7%) | 0 (0.0%) |
| 75 Years and over | 43 (41.3%) | 5 (4.1%) |
Disability Class: Vision Difficulty
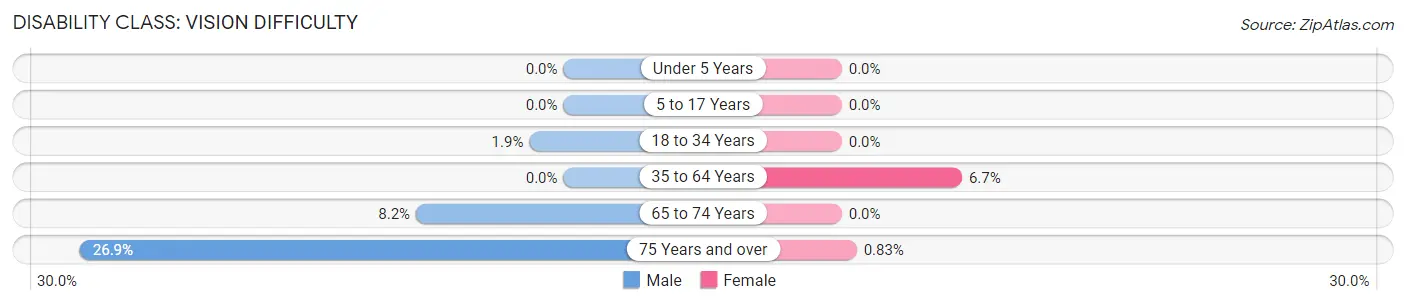
| Age Bracket | Male | Female |
| Under 5 Years | 0 (0.0%) | 0 (0.0%) |
| 5 to 17 Years | 0 (0.0%) | 0 (0.0%) |
| 18 to 34 Years | 2 (1.9%) | 0 (0.0%) |
| 35 to 64 Years | 0 (0.0%) | 18 (6.7%) |
| 65 to 74 Years | 11 (8.2%) | 0 (0.0%) |
| 75 Years and over | 28 (26.9%) | 1 (0.8%) |
Disability Class: Cognitive Difficulty
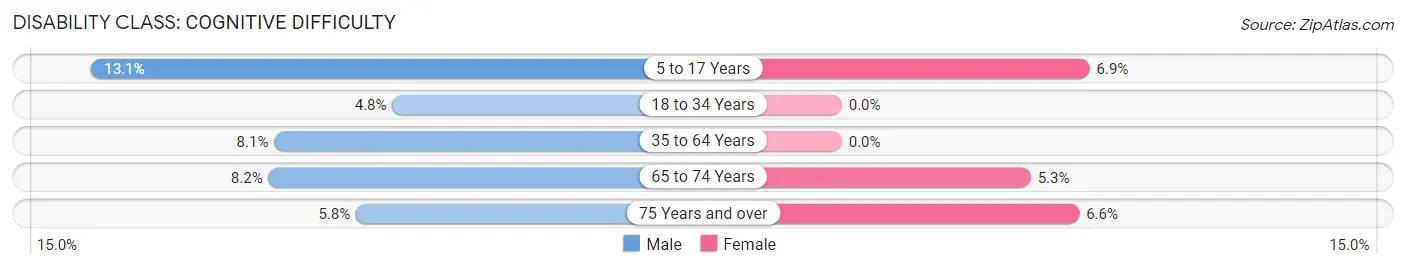
| Age Bracket | Male | Female |
| 5 to 17 Years | 18 (13.1%) | 8 (6.9%) |
| 18 to 34 Years | 5 (4.8%) | 0 (0.0%) |
| 35 to 64 Years | 21 (8.1%) | 0 (0.0%) |
| 65 to 74 Years | 11 (8.2%) | 8 (5.3%) |
| 75 Years and over | 6 (5.8%) | 8 (6.6%) |
Disability Class: Ambulatory Difficulty
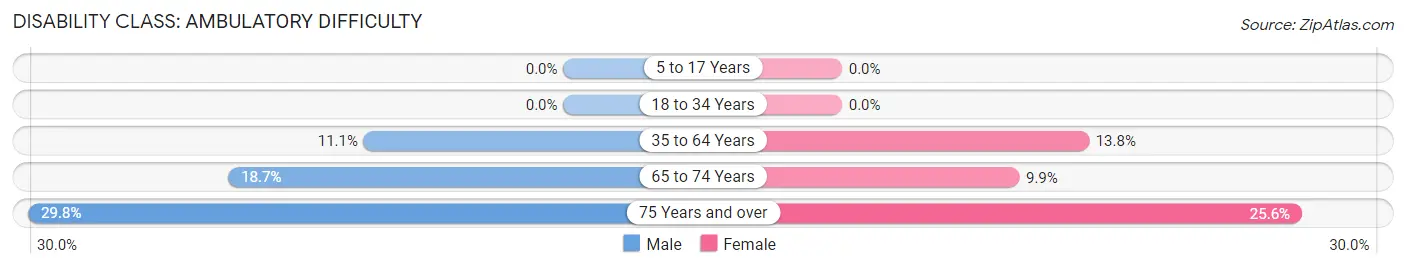
| Age Bracket | Male | Female |
| 5 to 17 Years | 0 (0.0%) | 0 (0.0%) |
| 18 to 34 Years | 0 (0.0%) | 0 (0.0%) |
| 35 to 64 Years | 29 (11.1%) | 37 (13.8%) |
| 65 to 74 Years | 25 (18.7%) | 15 (9.9%) |
| 75 Years and over | 31 (29.8%) | 31 (25.6%) |
Disability Class: Self-Care Difficulty
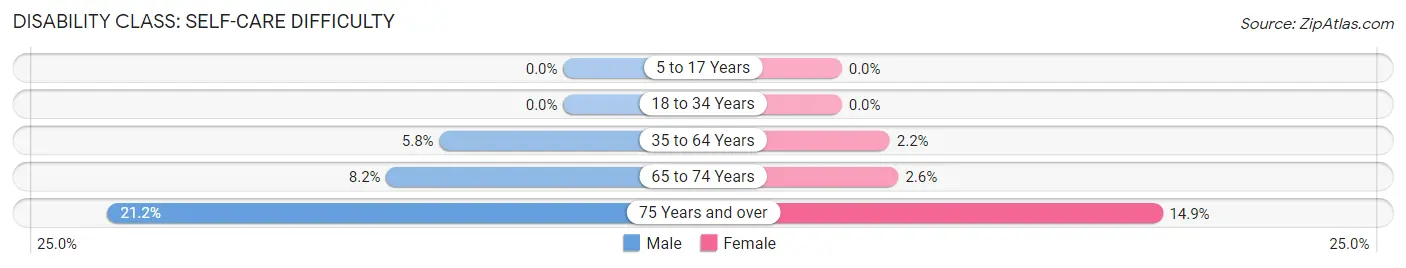
| Age Bracket | Male | Female |
| 5 to 17 Years | 0 (0.0%) | 0 (0.0%) |
| 18 to 34 Years | 0 (0.0%) | 0 (0.0%) |
| 35 to 64 Years | 15 (5.8%) | 6 (2.2%) |
| 65 to 74 Years | 11 (8.2%) | 4 (2.6%) |
| 75 Years and over | 22 (21.1%) | 18 (14.9%) |
Technology Access in Oberlin
Computing Device Access in Oberlin
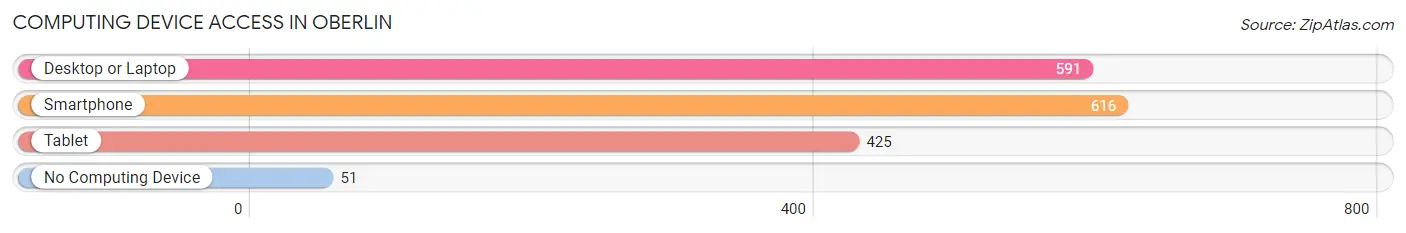
| Device Type | # Households | % Households |
| Desktop or Laptop | 591 | 72.6% |
| Smartphone | 616 | 75.7% |
| Tablet | 425 | 52.2% |
| No Computing Device | 51 | 6.3% |
| Total | 814 | 100.0% |
Internet Access in Oberlin
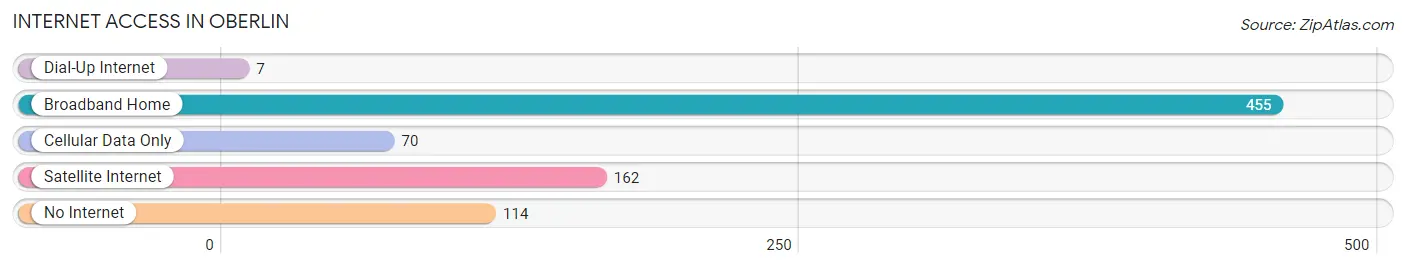
| Internet Type | # Households | % Households |
| Dial-Up Internet | 7 | 0.9% |
| Broadband Home | 455 | 55.9% |
| Cellular Data Only | 70 | 8.6% |
| Satellite Internet | 162 | 19.9% |
| No Internet | 114 | 14.0% |
| Total | 814 | 100.0% |
Oberlin Summary
Oberlin, Kansas is a small city located in Decatur County in the northwest corner of the state. The city is situated on the banks of the Republican River and is home to a population of approximately 1,800 people. The city is known for its rich history, diverse geography, and vibrant economy.
History
Oberlin was founded in 1885 by a group of German-Russian immigrants who had recently arrived in the United States. The city was named after Oberlin, Ohio, the hometown of one of the founders. The city quickly grew and by 1890, it had a population of over 1,000 people.
The city was an important stop on the Union Pacific Railroad and was a major shipping point for cattle and grain. The city also had a thriving business district, with several stores, banks, and other businesses.
In the early 1900s, the city experienced a period of growth and prosperity. The population increased to over 2,000 people and the city was home to several churches, schools, and other businesses.
Geography
Oberlin is located in the northwest corner of Kansas, near the Nebraska border. The city is situated on the banks of the Republican River and is surrounded by rolling hills and prairies. The city is located in the High Plains region of the state and is known for its dry climate and wide open spaces.
The city is located in Decatur County and is home to several small towns and villages. The nearest major city is Hays, which is located about 50 miles to the south.
Economy
Oberlin’s economy is largely based on agriculture and related industries. The city is home to several grain elevators and is a major shipping point for grain and cattle. The city is also home to several manufacturing companies, including a furniture factory and a plastics plant.
The city is also home to several small businesses, including restaurants, retail stores, and other services. The city is also home to a branch of the Decatur County Bank.
Demographics
As of the 2010 census, the population of Oberlin was 1,817 people. The city is predominantly white, with a small Hispanic population. The median household income is $37,000 and the median home value is $90,000.
The city is home to several churches, including the First United Methodist Church, the First Presbyterian Church, and the First Baptist Church. The city is also home to several schools, including Oberlin High School and Oberlin Elementary School.
Conclusion
Oberlin, Kansas is a small city located in Decatur County in the northwest corner of the state. The city is known for its rich history, diverse geography, and vibrant economy. The city is home to a population of approximately 1,800 people and is predominantly white, with a small Hispanic population. The city is home to several churches, schools, and businesses and is a major shipping point for grain and cattle.
Common Questions
What is Per Capita Income in Oberlin?
Per Capita income in Oberlin is $29,689.
What is the Median Family Income in Oberlin?
Median Family Income in Oberlin is $53,571.
What is the Median Household income in Oberlin?
Median Household Income in Oberlin is $40,735.
What is Income or Wage Gap in Oberlin?
Income or Wage Gap in Oberlin is 40.8%.
Women in Oberlin earn 59.2 cents for every dollar earned by a man.
What is Inequality or Gini Index in Oberlin?
Inequality or Gini Index in Oberlin is 0.41.
What is the Total Population of Oberlin?
Total Population of Oberlin is 1,629.
What is the Total Male Population of Oberlin?
Total Male Population of Oberlin is 809.
What is the Total Female Population of Oberlin?
Total Female Population of Oberlin is 820.
What is the Ratio of Males per 100 Females in Oberlin?
There are 98.66 Males per 100 Females in Oberlin.
What is the Ratio of Females per 100 Males in Oberlin?
There are 101.36 Females per 100 Males in Oberlin.
What is the Median Population Age in Oberlin?
Median Population Age in Oberlin is 53.1 Years.
What is the Average Family Size in Oberlin
Average Family Size in Oberlin is 2.9 People.
What is the Average Household Size in Oberlin
Average Household Size in Oberlin is 1.9 People.
How Large is the Labor Force in Oberlin?
There are 750 People in the Labor Forcein in Oberlin.
What is the Percentage of People in the Labor Force in Oberlin?
56.0% of People are in the Labor Force in Oberlin.
What is the Unemployment Rate in Oberlin?
Unemployment Rate in Oberlin is 5.5%.