Zip Codes with the Highest Percentage of Households with Income Above $200,000 in Springfield, IL
RELATED REPORTS & OPTIONS
Household Income | $200k+
Springfield
Compare Zip Codes
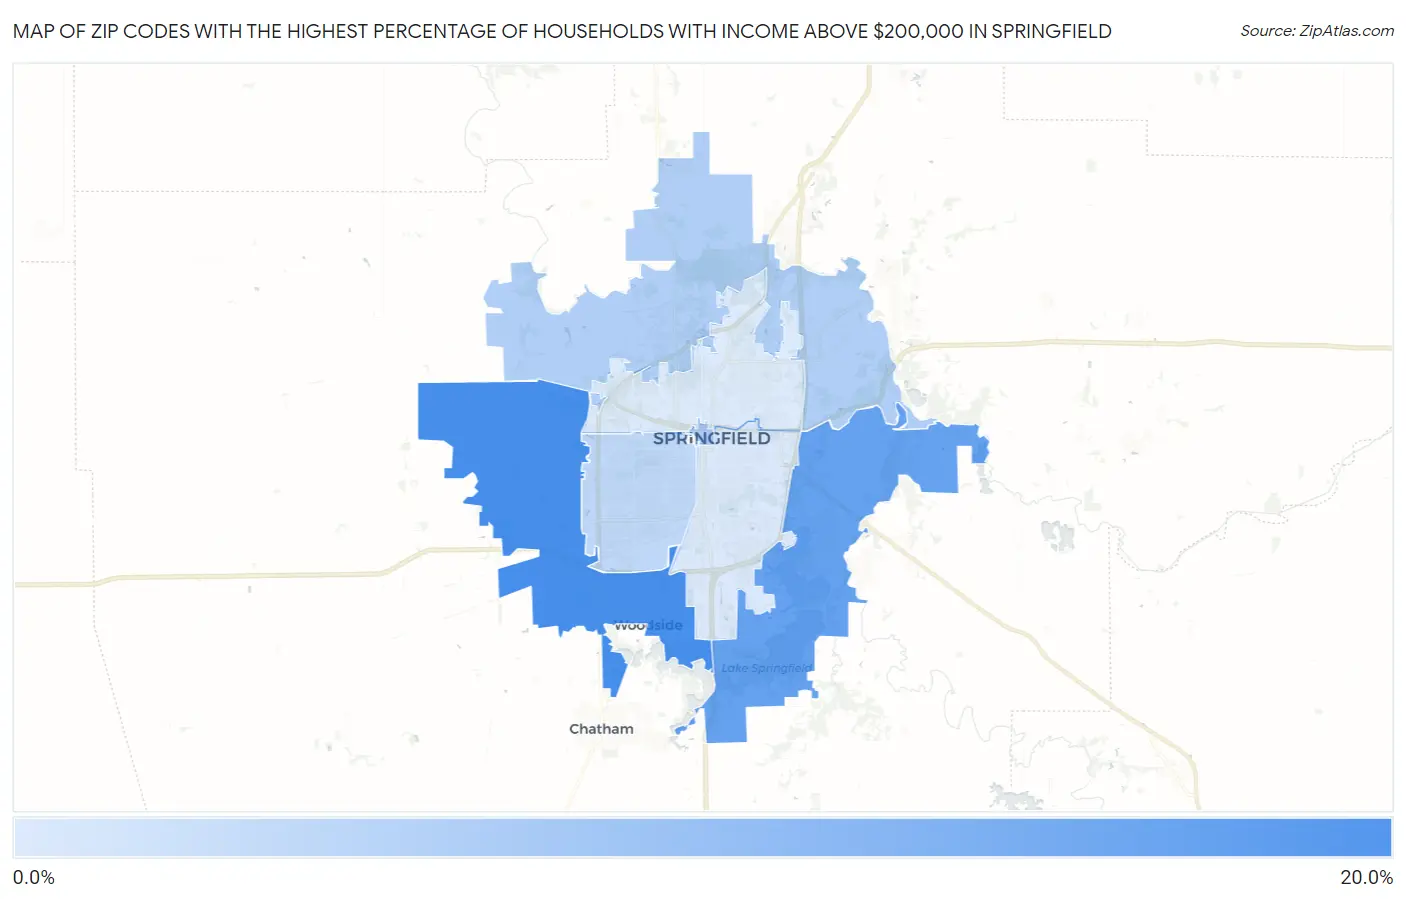
Map of Zip Codes with the Highest Percentage of Households with Income Above $200,000 in Springfield
2.3%
19.6%
Zip Codes with the Highest Percentage of Households with Income Above $200,000 in Springfield, IL
| Zip Code | Households with Income > $200k | vs State | vs National | |
| 1. | 62711 | 19.6% | 12.1%(+7.50)#122 | 11.4%(+8.20)#3,401 |
| 2. | 62712 | 16.0% | 12.1%(+3.90)#179 | 11.4%(+4.60)#4,573 |
| 3. | 62701 | 7.6% | 12.1%(-4.50)#461 | 11.4%(-3.80)#10,999 |
| 4. | 62707 | 7.0% | 12.1%(-5.10)#489 | 11.4%(-4.40)#11,798 |
| 5. | 62704 | 5.5% | 12.1%(-6.60)#611 | 11.4%(-5.90)#14,479 |
| 6. | 62703 | 2.6% | 12.1%(-9.50)#978 | 11.4%(-8.80)#22,014 |
| 7. | 62702 | 2.3% | 12.1%(-9.80)#1,015 | 11.4%(-9.10)#22,896 |
1
Common Questions
What are the Top 5 Zip Codes with the Highest Percentage of Households with Income Above $200,000 in Springfield, IL?
Top 5 Zip Codes with the Highest Percentage of Households with Income Above $200,000 in Springfield, IL are:
What zip code has the Highest Percentage of Households with Income Above $200,000 in Springfield, IL?
62711 has the Highest Percentage of Households with Income Above $200,000 in Springfield, IL with 19.6%.
What is the Percentage of Households with Income Above $200,000 in Springfield, IL?
Percentage of Households with Income Above $200,000 in Springfield is 6.6%.
What is the Percentage of Households with Income Above $200,000 in Illinois?
Percentage of Households with Income Above $200,000 in Illinois is 12.1%.
What is the Percentage of Households with Income Above $200,000 in the United States?
Percentage of Households with Income Above $200,000 in the United States is 11.4%.