Zip Codes with the Highest Percentage of Population Employed in Community & Social Service in Springfield, IL
RELATED REPORTS & OPTIONS
Community & Social Service
Springfield
Compare Zip Codes
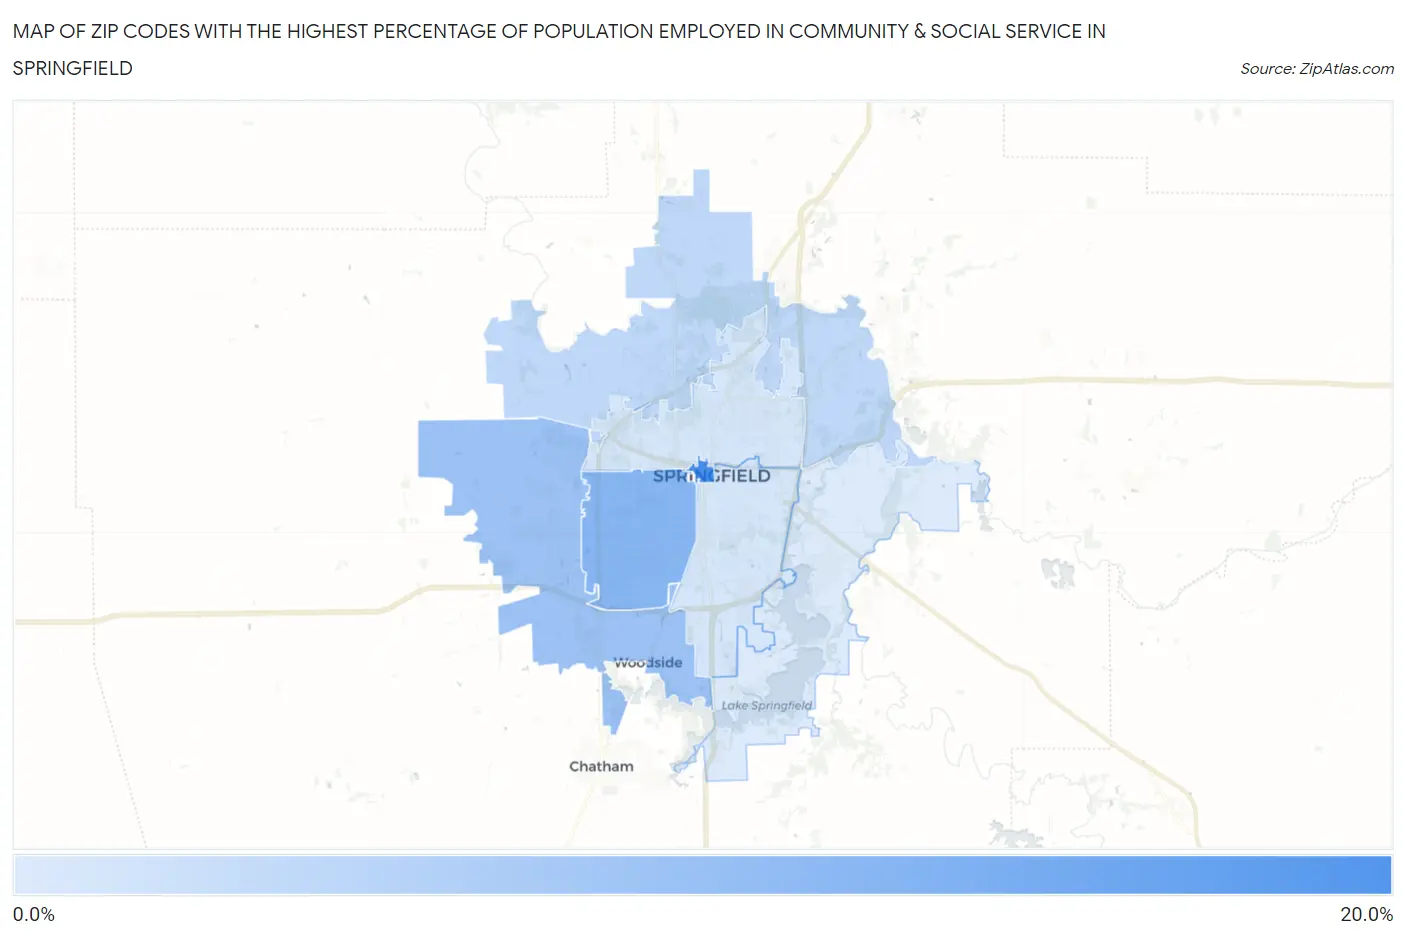
Map of Zip Codes with the Highest Percentage of Population Employed in Community & Social Service in Springfield
8.5%
17.9%
Zip Codes with the Highest Percentage of Population Employed in Community & Social Service in Springfield, IL
| Zip Code | % Employed | vs State | vs National | |
| 1. | 62701 | 17.9% | 11.3%(+6.63)#77 | 11.2%(+6.70)#2,860 |
| 2. | 62704 | 13.7% | 11.3%(+2.41)#211 | 11.2%(+2.48)#6,482 |
| 3. | 62711 | 12.6% | 11.3%(+1.30)#270 | 11.2%(+1.36)#8,288 |
| 4. | 62707 | 10.3% | 11.3%(-1.01)#492 | 11.2%(-0.947)#13,443 |
| 5. | 62703 | 8.9% | 11.3%(-2.38)#639 | 11.2%(-2.31)#17,075 |
| 6. | 62702 | 8.9% | 11.3%(-2.42)#648 | 11.2%(-2.36)#17,209 |
| 7. | 62712 | 8.5% | 11.3%(-2.80)#694 | 11.2%(-2.73)#18,227 |
1
Common Questions
What are the Top 5 Zip Codes with the Highest Percentage of Population Employed in Community & Social Service in Springfield, IL?
Top 5 Zip Codes with the Highest Percentage of Population Employed in Community & Social Service in Springfield, IL are:
What zip code has the Highest Percentage of Population Employed in Community & Social Service in Springfield, IL?
62701 has the Highest Percentage of Population Employed in Community & Social Service in Springfield, IL with 17.9%.
What is the Percentage of Population Employed in Community & Social Service in Springfield, IL?
Percentage of Population Employed in Community & Social Service in Springfield is 11.0%.
What is the Percentage of Population Employed in Community & Social Service in Illinois?
Percentage of Population Employed in Community & Social Service in Illinois is 11.3%.
What is the Percentage of Population Employed in Community & Social Service in the United States?
Percentage of Population Employed in Community & Social Service in the United States is 11.2%.