Zip Codes with the Highest Percentage of Population Employed in Office & Administration in Springfield, IL
RELATED REPORTS & OPTIONS
Office & Administration
Springfield
Compare Zip Codes
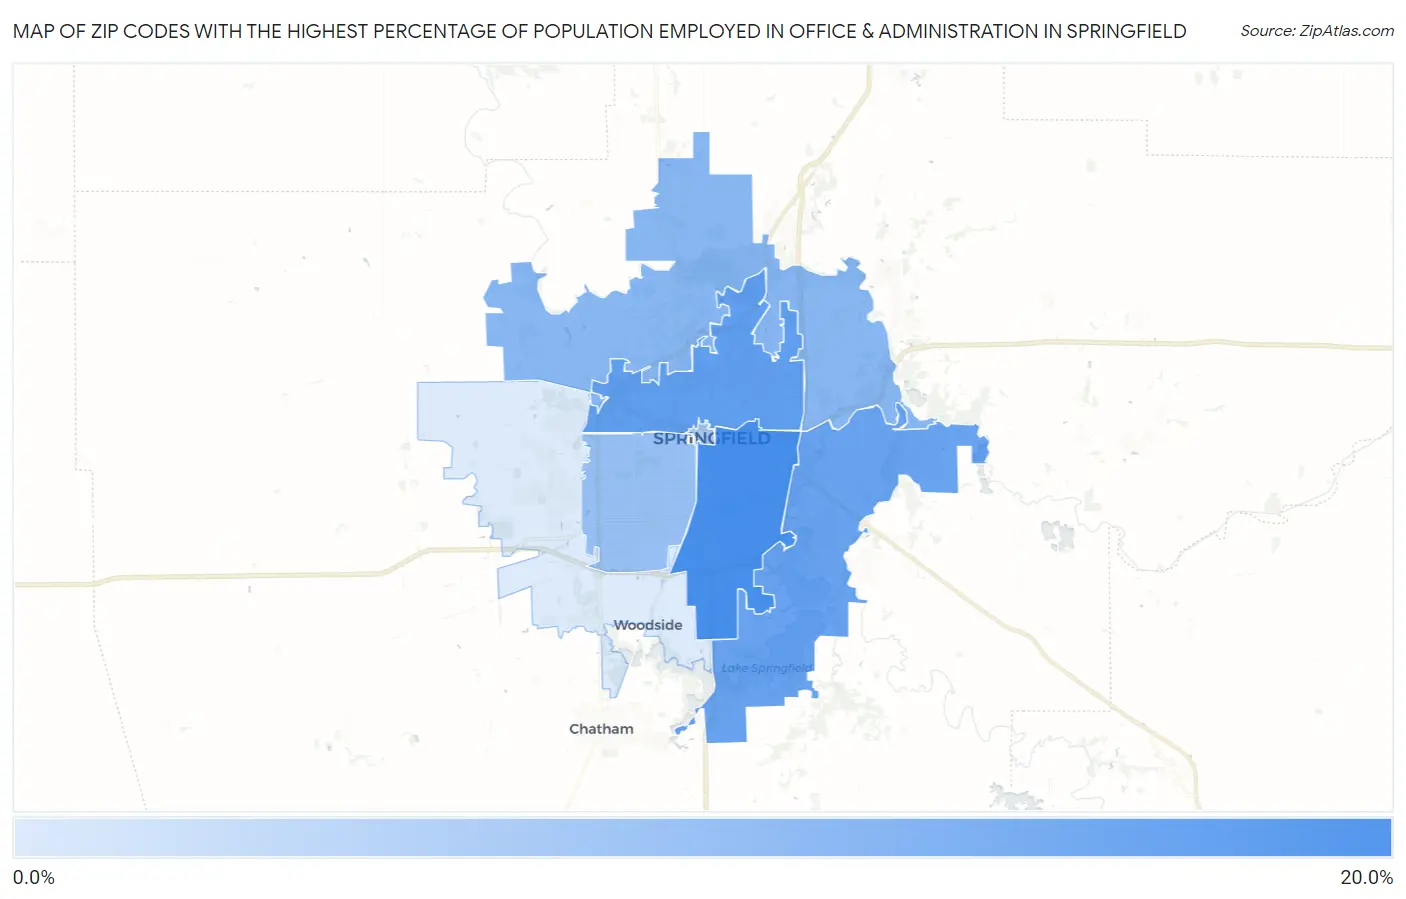
Map of Zip Codes with the Highest Percentage of Population Employed in Office & Administration in Springfield
7.2%
16.9%
Zip Codes with the Highest Percentage of Population Employed in Office & Administration in Springfield, IL
| Zip Code | % Employed | vs State | vs National | |
| 1. | 62703 | 16.9% | 10.8%(+6.18)#130 | 10.9%(+6.09)#2,875 |
| 2. | 62702 | 15.2% | 10.8%(+4.47)#202 | 10.9%(+4.38)#4,284 |
| 3. | 62712 | 14.8% | 10.8%(+4.07)#230 | 10.9%(+3.97)#4,791 |
| 4. | 62707 | 12.6% | 10.8%(+1.87)#435 | 10.9%(+1.78)#8,947 |
| 5. | 62704 | 11.6% | 10.8%(+0.863)#568 | 10.9%(+0.771)#11,852 |
| 6. | 62701 | 10.7% | 10.8%(-0.107)#691 | 10.9%(-0.199)#14,948 |
| 7. | 62711 | 7.2% | 10.8%(-3.57)#1,109 | 10.9%(-3.67)#24,842 |
1
Common Questions
What are the Top 5 Zip Codes with the Highest Percentage of Population Employed in Office & Administration in Springfield, IL?
Top 5 Zip Codes with the Highest Percentage of Population Employed in Office & Administration in Springfield, IL are:
What zip code has the Highest Percentage of Population Employed in Office & Administration in Springfield, IL?
62703 has the Highest Percentage of Population Employed in Office & Administration in Springfield, IL with 16.9%.
What is the Percentage of Population Employed in Office & Administration in Springfield, IL?
Percentage of Population Employed in Office & Administration in Springfield is 13.2%.
What is the Percentage of Population Employed in Office & Administration in Illinois?
Percentage of Population Employed in Office & Administration in Illinois is 10.8%.
What is the Percentage of Population Employed in Office & Administration in the United States?
Percentage of Population Employed in Office & Administration in the United States is 10.9%.