Zip Codes with the Highest Percentage of Population Employed in Accommodation & Food Services in Springfield, IL
RELATED REPORTS & OPTIONS
Accommodation & Food Services
Springfield
Compare Zip Codes
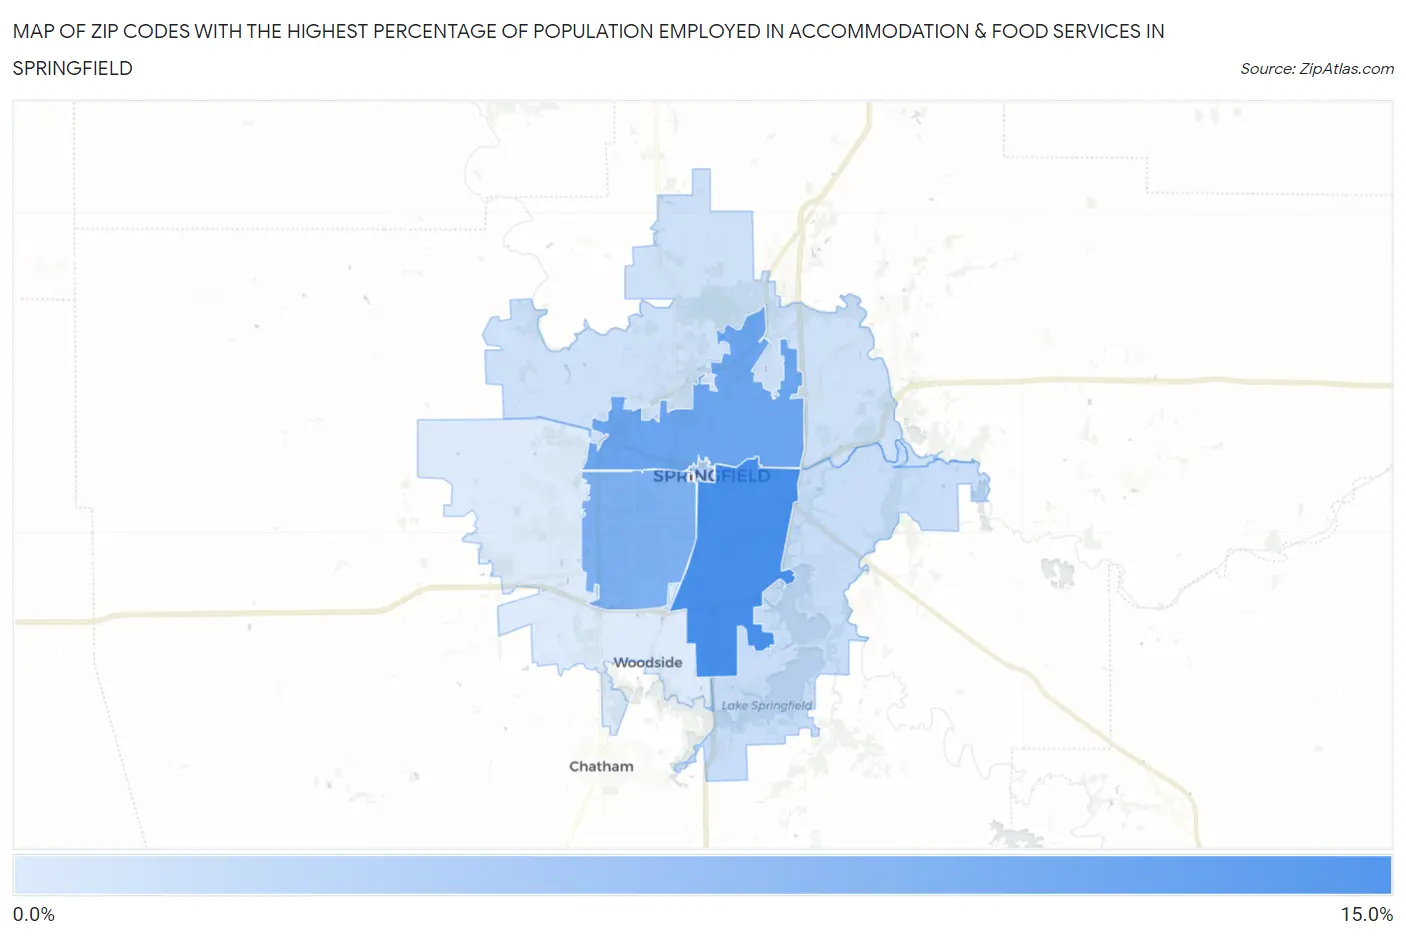
Map of Zip Codes with the Highest Percentage of Population Employed in Accommodation & Food Services in Springfield
2.3%
11.3%
Zip Codes with the Highest Percentage of Population Employed in Accommodation & Food Services in Springfield, IL
| Zip Code | % Employed | vs State | vs National | |
| 1. | 62703 | 11.3% | 6.5%(+4.81)#90 | 6.9%(+4.40)#3,338 |
| 2. | 62702 | 8.9% | 6.5%(+2.45)#189 | 6.9%(+2.04)#6,098 |
| 3. | 62704 | 7.9% | 6.5%(+1.40)#286 | 6.9%(+0.992)#8,092 |
| 4. | 62701 | 5.0% | 6.5%(-1.48)#665 | 6.9%(-1.89)#16,865 |
| 5. | 62712 | 3.5% | 6.5%(-2.98)#923 | 6.9%(-3.39)#21,805 |
| 6. | 62707 | 3.1% | 6.5%(-3.41)#982 | 6.9%(-3.82)#23,048 |
| 7. | 62711 | 2.3% | 6.5%(-4.22)#1,086 | 6.9%(-4.63)#25,037 |
1
Common Questions
What are the Top 5 Zip Codes with the Highest Percentage of Population Employed in Accommodation & Food Services in Springfield, IL?
Top 5 Zip Codes with the Highest Percentage of Population Employed in Accommodation & Food Services in Springfield, IL are:
What zip code has the Highest Percentage of Population Employed in Accommodation & Food Services in Springfield, IL?
62703 has the Highest Percentage of Population Employed in Accommodation & Food Services in Springfield, IL with 11.3%.
What is the Percentage of Population Employed in Accommodation & Food Services in Springfield, IL?
Percentage of Population Employed in Accommodation & Food Services in Springfield is 7.3%.
What is the Percentage of Population Employed in Accommodation & Food Services in Illinois?
Percentage of Population Employed in Accommodation & Food Services in Illinois is 6.5%.
What is the Percentage of Population Employed in Accommodation & Food Services in the United States?
Percentage of Population Employed in Accommodation & Food Services in the United States is 6.9%.