Zip Codes with the Highest Percentage of Households with Income Above $200,000 in Plainfield, IL
RELATED REPORTS & OPTIONS
Household Income | $200k+
Plainfield
Compare Zip Codes
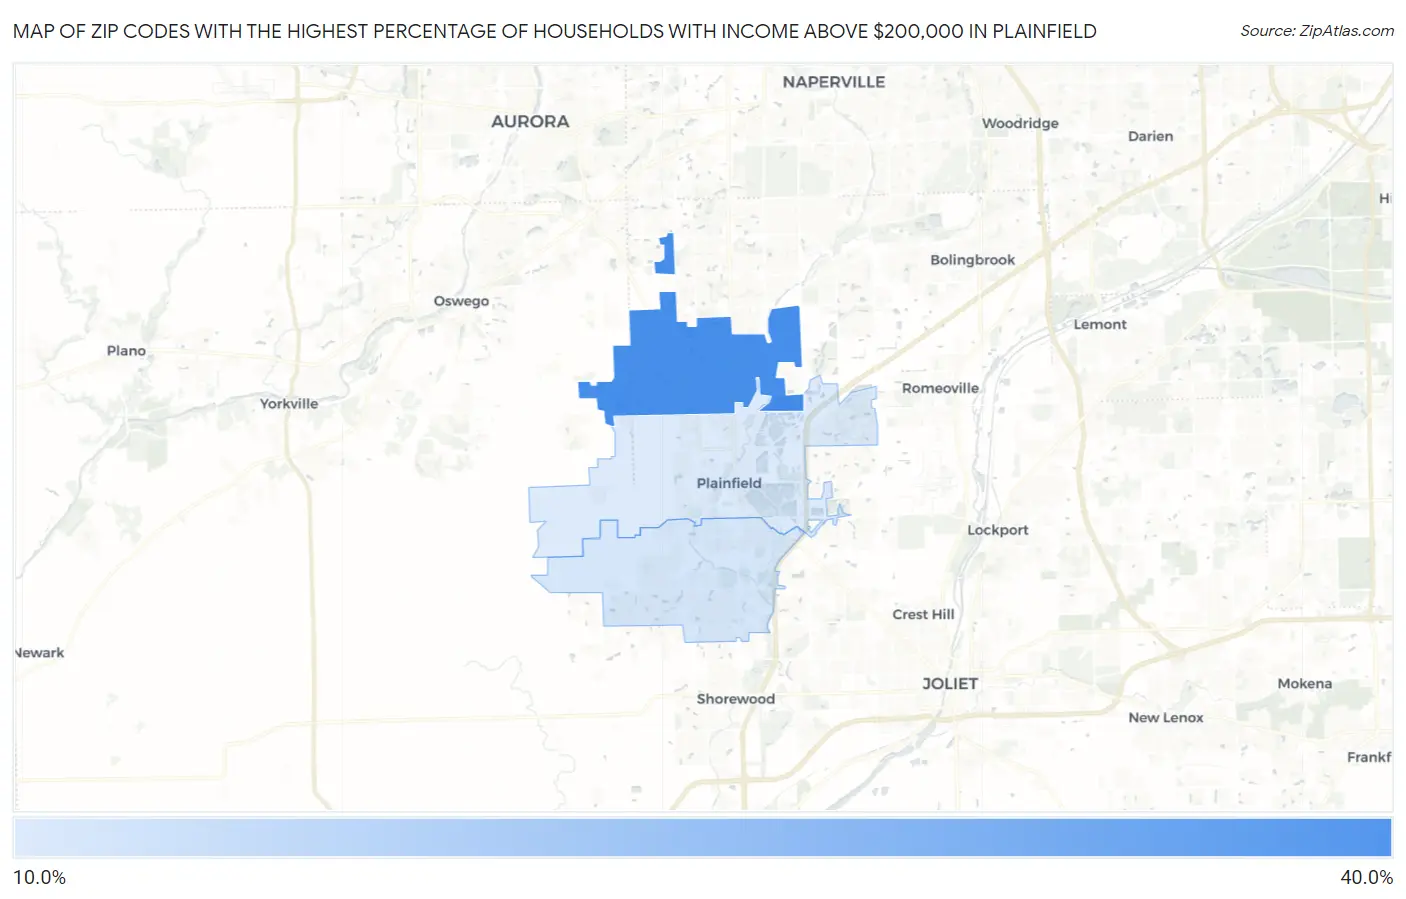
Map of Zip Codes with the Highest Percentage of Households with Income Above $200,000 in Plainfield
16.4%
32.2%
Zip Codes with the Highest Percentage of Households with Income Above $200,000 in Plainfield, IL
| Zip Code | Households with Income > $200k | vs State | vs National | |
| 1. | 60585 | 32.2% | 12.1%(+20.1)#34 | 11.4%(+20.8)#1,231 |
| 2. | 60586 | 17.2% | 12.1%(+5.10)#151 | 11.4%(+5.80)#4,093 |
| 3. | 60544 | 16.4% | 12.1%(+4.30)#170 | 11.4%(+5.00)#4,411 |
1
Common Questions
What are the Top Zip Codes with the Highest Percentage of Households with Income Above $200,000 in Plainfield, IL?
Top Zip Codes with the Highest Percentage of Households with Income Above $200,000 in Plainfield, IL are:
What zip code has the Highest Percentage of Households with Income Above $200,000 in Plainfield, IL?
60585 has the Highest Percentage of Households with Income Above $200,000 in Plainfield, IL with 32.2%.
What is the Percentage of Households with Income Above $200,000 in Plainfield, IL?
Percentage of Households with Income Above $200,000 in Plainfield is 29.3%.
What is the Percentage of Households with Income Above $200,000 in Illinois?
Percentage of Households with Income Above $200,000 in Illinois is 12.1%.
What is the Percentage of Households with Income Above $200,000 in the United States?
Percentage of Households with Income Above $200,000 in the United States is 11.4%.