Zip Codes with the Highest Percentage of Households with Income Above $200,000 in Chicago, IL
RELATED REPORTS & OPTIONS
Household Income | $200k+
Chicago
Compare Zip Codes
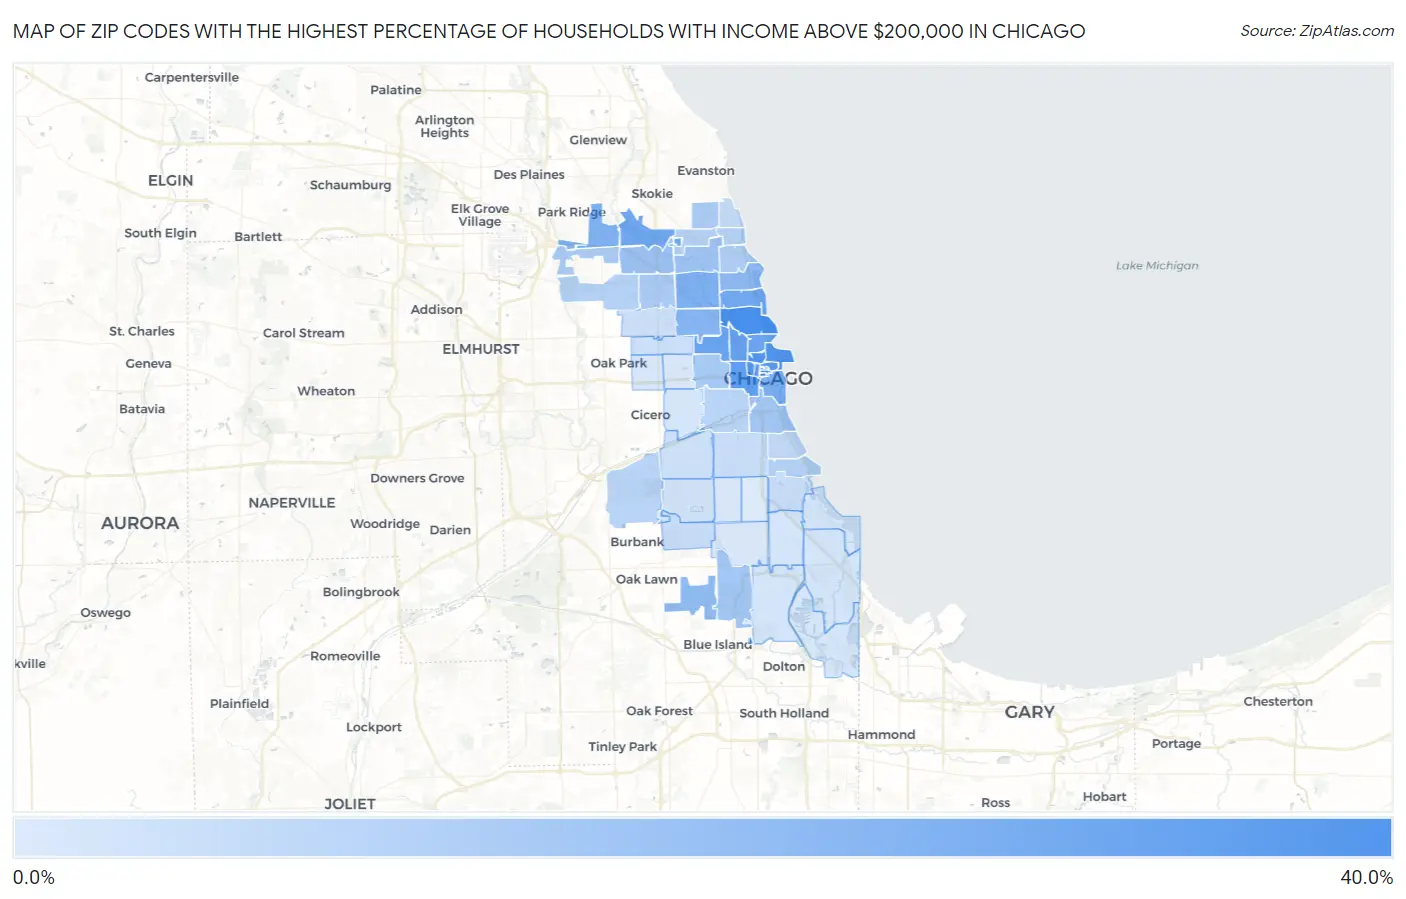
Map of Zip Codes with the Highest Percentage of Households with Income Above $200,000 in Chicago
1.3%
34.9%
Zip Codes with the Highest Percentage of Households with Income Above $200,000 in Chicago, IL
| Zip Code | Households with Income > $200k | vs State | vs National | |
| 1. | 60614 | 34.9% | 12.1%(+22.8)#26 | 11.4%(+23.5)#983 |
| 2. | 60603 | 34.0% | 12.1%(+21.9)#29 | 11.4%(+22.6)#1,066 |
| 3. | 60654 | 33.0% | 12.1%(+20.9)#31 | 11.4%(+21.6)#1,151 |
| 4. | 60611 | 32.7% | 12.1%(+20.6)#33 | 11.4%(+21.3)#1,176 |
| 5. | 60661 | 31.1% | 12.1%(+19.0)#41 | 11.4%(+19.7)#1,341 |
| 6. | 60604 | 30.8% | 12.1%(+18.7)#45 | 11.4%(+19.4)#1,372 |
| 7. | 60601 | 30.6% | 12.1%(+18.5)#46 | 11.4%(+19.2)#1,389 |
| 8. | 60607 | 28.7% | 12.1%(+16.6)#51 | 11.4%(+17.3)#1,621 |
| 9. | 60602 | 28.6% | 12.1%(+16.5)#52 | 11.4%(+17.2)#1,638 |
| 10. | 60642 | 27.4% | 12.1%(+15.3)#59 | 11.4%(+16.0)#1,811 |
| 11. | 60622 | 27.0% | 12.1%(+14.9)#63 | 11.4%(+15.6)#1,873 |
| 12. | 60606 | 26.5% | 12.1%(+14.4)#65 | 11.4%(+15.1)#1,952 |
| 13. | 60610 | 25.5% | 12.1%(+13.4)#71 | 11.4%(+14.1)#2,095 |
| 14. | 60646 | 24.6% | 12.1%(+12.5)#77 | 11.4%(+13.2)#2,263 |
| 15. | 60657 | 24.5% | 12.1%(+12.4)#78 | 11.4%(+13.1)#2,272 |
| 16. | 60605 | 22.2% | 12.1%(+10.1)#91 | 11.4%(+10.8)#2,727 |
| 17. | 60618 | 21.1% | 12.1%(+9.00)#99 | 11.4%(+9.70)#2,987 |
| 18. | 60631 | 20.7% | 12.1%(+8.60)#105 | 11.4%(+9.30)#3,105 |
| 19. | 60647 | 19.6% | 12.1%(+7.50)#120 | 11.4%(+8.20)#3,386 |
| 20. | 60613 | 18.1% | 12.1%(+6.00)#139 | 11.4%(+6.70)#3,805 |
| 21. | 60655 | 17.2% | 12.1%(+5.10)#152 | 11.4%(+5.80)#4,101 |
| 22. | 60630 | 14.6% | 12.1%(+2.50)#199 | 11.4%(+3.20)#5,170 |
| 23. | 60625 | 13.4% | 12.1%(+1.30)#219 | 11.4%(+2.00)#5,775 |
| 24. | 60643 | 13.2% | 12.1%(+1.10)#226 | 11.4%(+1.80)#5,889 |
| 25. | 60616 | 13.0% | 12.1%(+0.900)#231 | 11.4%(+1.60)#5,996 |
| 26. | 60612 | 12.0% | 12.1%(-0.100)#258 | 11.4%(+0.600)#6,664 |
| 27. | 60641 | 11.6% | 12.1%(-0.500)#269 | 11.4%(+0.200)#6,922 |
| 28. | 60656 | 11.2% | 12.1%(-0.900)#283 | 11.4%(-0.200)#7,227 |
| 29. | 60645 | 11.0% | 12.1%(-1.10)#293 | 11.4%(-0.400)#7,387 |
| 30. | 60640 | 10.5% | 12.1%(-1.60)#303 | 11.4%(-0.900)#7,770 |
| 31. | 60660 | 9.4% | 12.1%(-2.70)#349 | 11.4%(-2.00)#8,824 |
| 32. | 60634 | 9.2% | 12.1%(-2.90)#357 | 11.4%(-2.20)#9,020 |
| 33. | 60659 | 9.2% | 12.1%(-2.90)#360 | 11.4%(-2.20)#9,030 |
| 34. | 60615 | 9.1% | 12.1%(-3.00)#364 | 11.4%(-2.30)#9,123 |
| 35. | 60638 | 8.3% | 12.1%(-3.80)#413 | 11.4%(-3.10)#9,979 |
| 36. | 60608 | 8.1% | 12.1%(-4.00)#427 | 11.4%(-3.30)#10,207 |
| 37. | 60653 | 6.6% | 12.1%(-5.50)#510 | 11.4%(-4.80)#12,400 |
| 38. | 60626 | 6.4% | 12.1%(-5.70)#524 | 11.4%(-5.00)#12,709 |
| 39. | 60637 | 5.5% | 12.1%(-6.60)#610 | 11.4%(-5.90)#14,470 |
| 40. | 60652 | 5.4% | 12.1%(-6.70)#618 | 11.4%(-6.00)#14,660 |
| 41. | 60609 | 5.2% | 12.1%(-6.90)#633 | 11.4%(-6.20)#15,062 |
| 42. | 60651 | 4.5% | 12.1%(-7.60)#706 | 11.4%(-6.90)#16,751 |
| 43. | 60639 | 4.3% | 12.1%(-7.80)#727 | 11.4%(-7.10)#17,240 |
| 44. | 60632 | 4.1% | 12.1%(-8.00)#756 | 11.4%(-7.30)#17,787 |
| 45. | 60629 | 3.6% | 12.1%(-8.50)#816 | 11.4%(-7.80)#19,133 |
| 46. | 60617 | 3.3% | 12.1%(-8.80)#863 | 11.4%(-8.10)#19,987 |
| 47. | 60619 | 3.3% | 12.1%(-8.80)#864 | 11.4%(-8.10)#19,992 |
| 48. | 60628 | 3.2% | 12.1%(-8.90)#884 | 11.4%(-8.20)#20,268 |
| 49. | 60649 | 3.0% | 12.1%(-9.10)#918 | 11.4%(-8.40)#20,866 |
| 50. | 60633 | 2.7% | 12.1%(-9.40)#966 | 11.4%(-8.70)#21,766 |
| 51. | 60623 | 2.6% | 12.1%(-9.50)#977 | 11.4%(-8.80)#21,988 |
| 52. | 60624 | 2.4% | 12.1%(-9.70)#998 | 11.4%(-9.00)#22,618 |
| 53. | 60620 | 2.3% | 12.1%(-9.80)#1,014 | 11.4%(-9.10)#22,883 |
| 54. | 60644 | 2.1% | 12.1%(-10.00)#1,031 | 11.4%(-9.30)#23,443 |
| 55. | 60636 | 2.0% | 12.1%(-10.1)#1,044 | 11.4%(-9.40)#23,747 |
| 56. | 60621 | 1.3% | 12.1%(-10.8)#1,115 | 11.4%(-10.1)#25,525 |
1
Common Questions
What are the Top 10 Zip Codes with the Highest Percentage of Households with Income Above $200,000 in Chicago, IL?
Top 10 Zip Codes with the Highest Percentage of Households with Income Above $200,000 in Chicago, IL are:
What zip code has the Highest Percentage of Households with Income Above $200,000 in Chicago, IL?
60614 has the Highest Percentage of Households with Income Above $200,000 in Chicago, IL with 34.9%.
What is the Percentage of Households with Income Above $200,000 in Chicago, IL?
Percentage of Households with Income Above $200,000 in Chicago is 12.8%.
What is the Percentage of Households with Income Above $200,000 in Illinois?
Percentage of Households with Income Above $200,000 in Illinois is 12.1%.
What is the Percentage of Households with Income Above $200,000 in the United States?
Percentage of Households with Income Above $200,000 in the United States is 11.4%.