Zip Codes with the Highest Percentage of Households with Income Above $200,000 in Quincy, IL
RELATED REPORTS & OPTIONS
Household Income | $200k+
Quincy
Compare Zip Codes
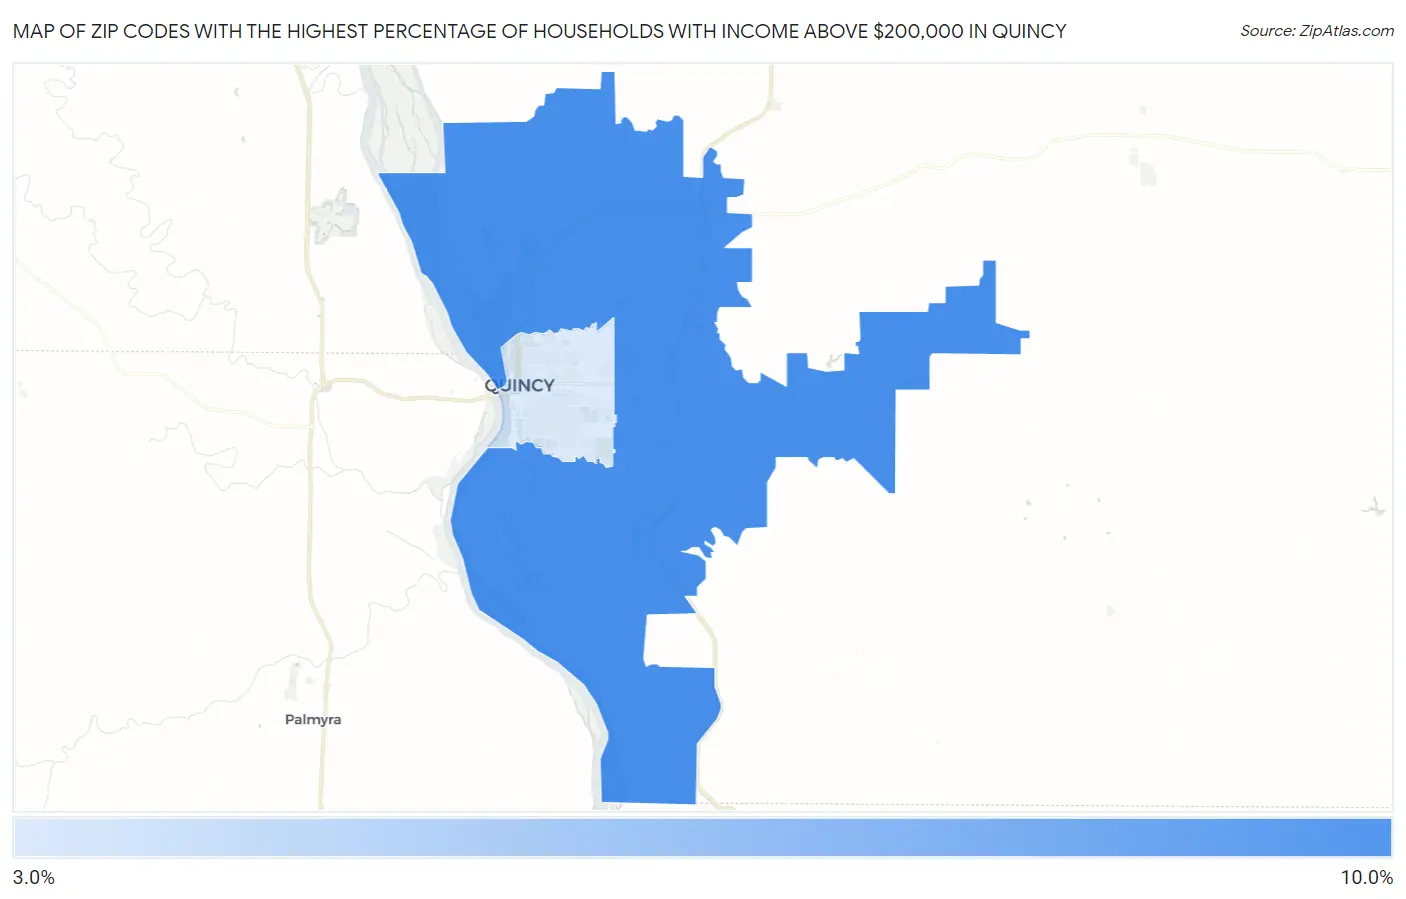
Map of Zip Codes with the Highest Percentage of Households with Income Above $200,000 in Quincy
3.2%
8.3%
Zip Codes with the Highest Percentage of Households with Income Above $200,000 in Quincy, IL
| Zip Code | Households with Income > $200k | vs State | vs National | |
| 1. | 62305 | 8.3% | 12.1%(-3.80)#414 | 11.4%(-3.10)#10,013 |
| 2. | 62301 | 3.2% | 12.1%(-8.90)#885 | 11.4%(-8.20)#20,292 |
1
Common Questions
What are the Top Zip Codes with the Highest Percentage of Households with Income Above $200,000 in Quincy, IL?
Top Zip Codes with the Highest Percentage of Households with Income Above $200,000 in Quincy, IL are:
What zip code has the Highest Percentage of Households with Income Above $200,000 in Quincy, IL?
62305 has the Highest Percentage of Households with Income Above $200,000 in Quincy, IL with 8.3%.
What is the Percentage of Households with Income Above $200,000 in Quincy, IL?
Percentage of Households with Income Above $200,000 in Quincy is 4.2%.
What is the Percentage of Households with Income Above $200,000 in Illinois?
Percentage of Households with Income Above $200,000 in Illinois is 12.1%.
What is the Percentage of Households with Income Above $200,000 in the United States?
Percentage of Households with Income Above $200,000 in the United States is 11.4%.