Zip Codes with the Highest Percentage of Population with a Degree in Visual and Performing Arts in Springfield, IL
RELATED REPORTS & OPTIONS
Visual and Performing Arts
Springfield
Compare Zip Codes
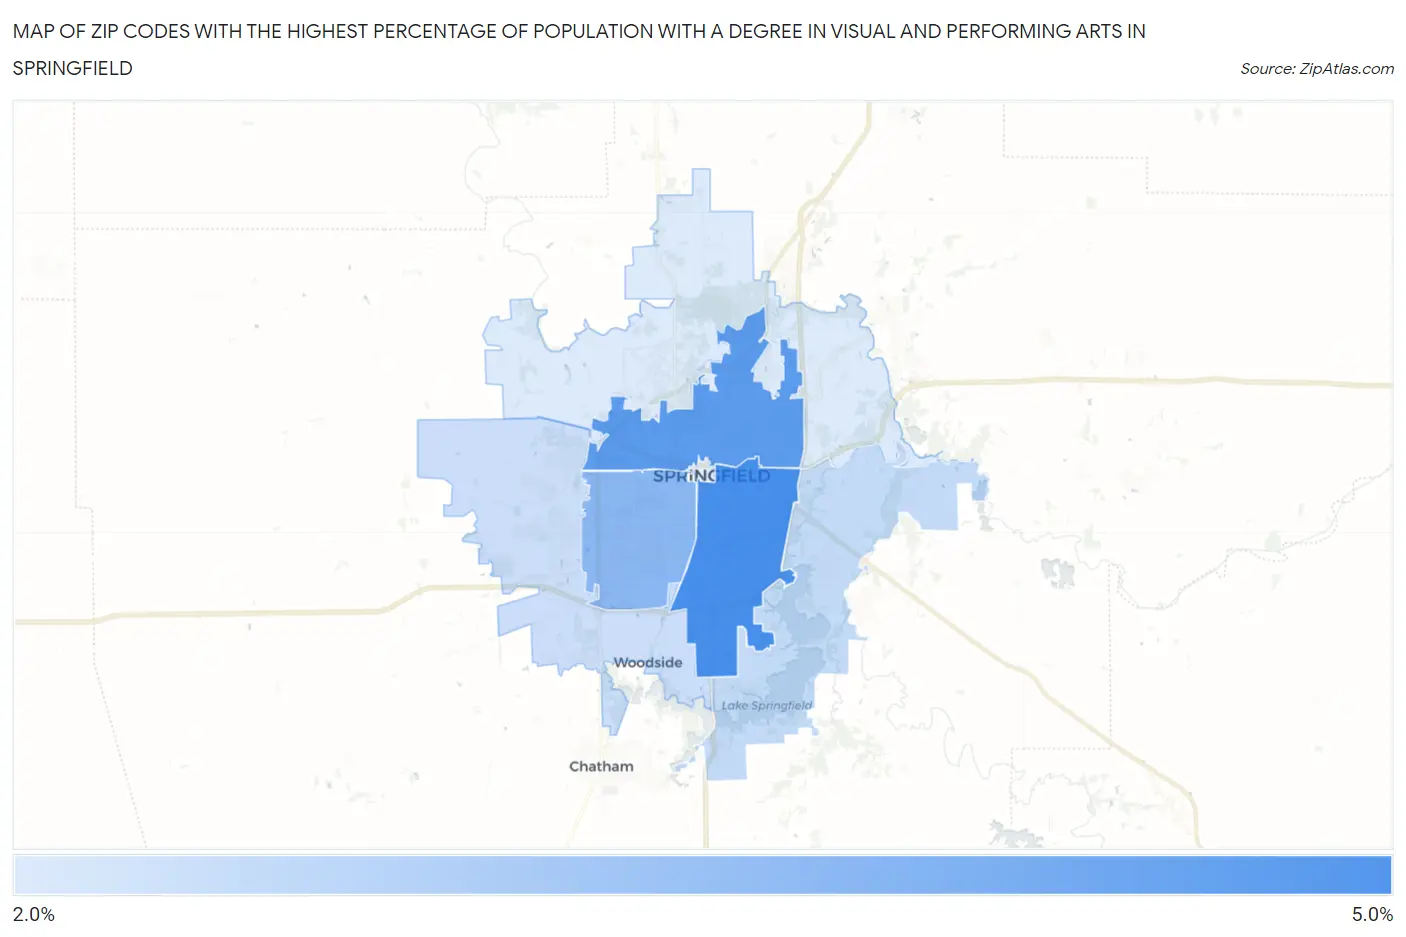
Map of Zip Codes with the Highest Percentage of Population with a Degree in Visual and Performing Arts in Springfield
2.7%
5.0%
Zip Codes with the Highest Percentage of Population with a Degree in Visual and Performing Arts in Springfield, IL
| Zip Code | % Graduates | vs State | vs National | |
| 1. | 62703 | 5.0% | 4.4%(+0.545)#245 | 4.3%(+0.743)#6,659 |
| 2. | 62702 | 4.7% | 4.4%(+0.227)#282 | 4.3%(+0.424)#7,353 |
| 3. | 62704 | 4.0% | 4.4%(-0.495)#368 | 4.3%(-0.298)#9,385 |
| 4. | 62712 | 3.1% | 4.4%(-1.37)#503 | 4.3%(-1.17)#12,391 |
| 5. | 62711 | 3.0% | 4.4%(-1.47)#520 | 4.3%(-1.27)#12,802 |
| 6. | 62707 | 2.7% | 4.4%(-1.76)#570 | 4.3%(-1.56)#13,947 |
1
Common Questions
What are the Top 5 Zip Codes with the Highest Percentage of Population with a Degree in Visual and Performing Arts in Springfield, IL?
Top 5 Zip Codes with the Highest Percentage of Population with a Degree in Visual and Performing Arts in Springfield, IL are:
What zip code has the Highest Percentage of Population with a Degree in Visual and Performing Arts in Springfield, IL?
62703 has the Highest Percentage of Population with a Degree in Visual and Performing Arts in Springfield, IL with 5.0%.
What is the Percentage of Population with a Degree in Visual and Performing Arts in Springfield, IL?
Percentage of Population with a Degree in Visual and Performing Arts in Springfield is 3.6%.
What is the Percentage of Population with a Degree in Visual and Performing Arts in Illinois?
Percentage of Population with a Degree in Visual and Performing Arts in Illinois is 4.4%.
What is the Percentage of Population with a Degree in Visual and Performing Arts in the United States?
Percentage of Population with a Degree in Visual and Performing Arts in the United States is 4.3%.