Zip Codes with the Highest Percentage of Families with Income Below $10,000 in Springfield, IL
RELATED REPORTS & OPTIONS
Family Income | $0-10k
Springfield
Compare Zip Codes
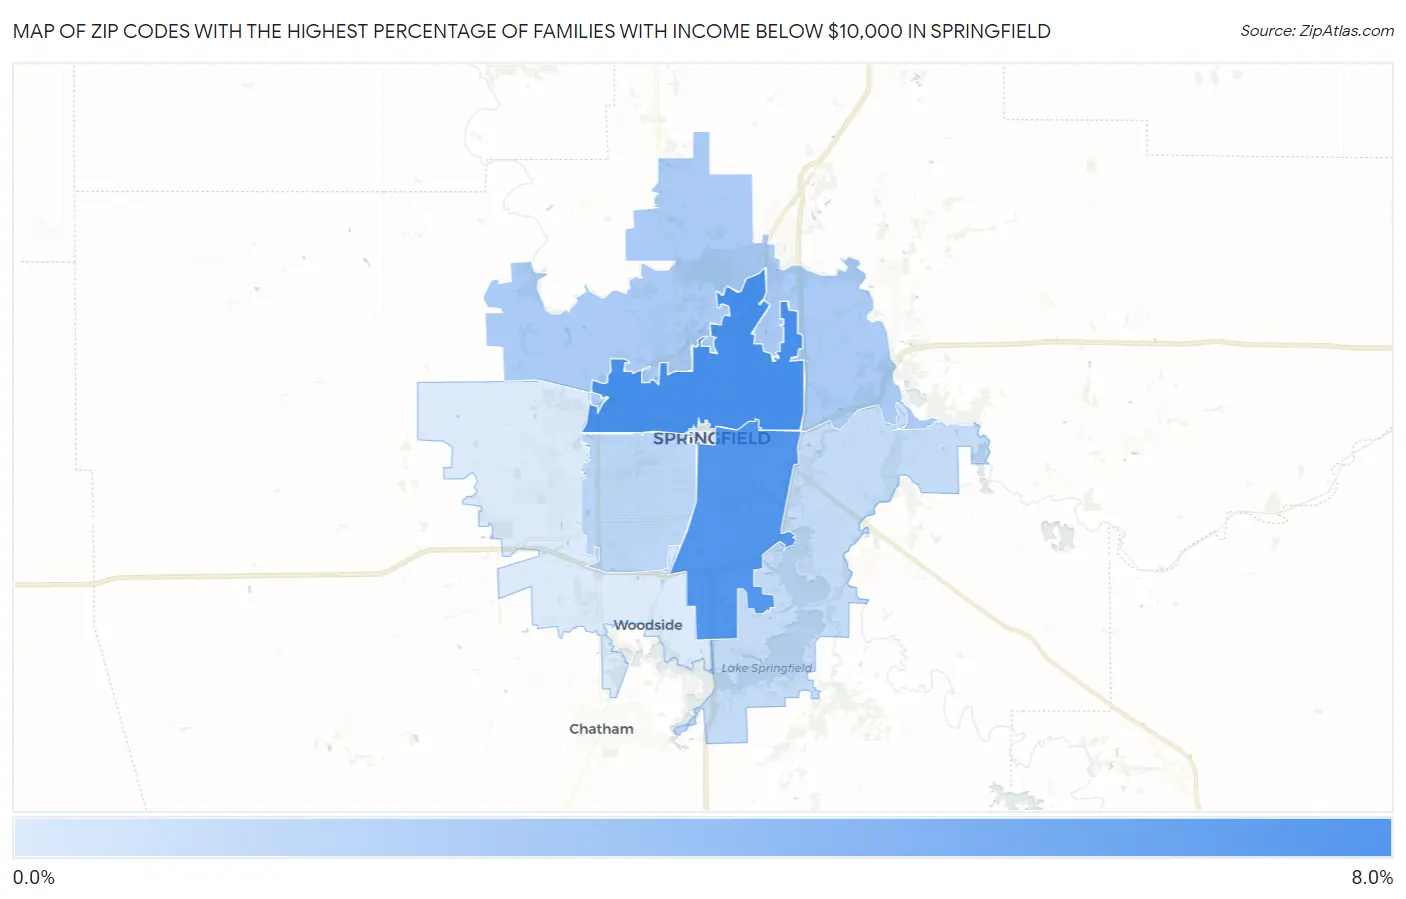
Map of Zip Codes with the Highest Percentage of Families with Income Below $10,000 in Springfield
0.60%
7.0%
Zip Codes with the Highest Percentage of Families with Income Below $10,000 in Springfield, IL
| Zip Code | Families with Income < $10k | vs State | vs National | |
| 1. | 62702 | 7.0% | 3.0%(+4.00)#129 | 3.1%(+3.90)#3,625 |
| 2. | 62703 | 6.5% | 3.0%(+3.50)#144 | 3.1%(+3.40)#4,105 |
| 3. | 62707 | 2.7% | 3.0%(-0.300)#478 | 3.1%(-0.400)#12,408 |
| 4. | 62704 | 1.9% | 3.0%(-1.10)#646 | 3.1%(-1.20)#15,762 |
| 5. | 62712 | 1.6% | 3.0%(-1.40)#716 | 3.1%(-1.50)#17,385 |
| 6. | 62711 | 0.60% | 3.0%(-2.40)#967 | 3.1%(-2.50)#22,242 |
1
Common Questions
What are the Top 5 Zip Codes with the Highest Percentage of Families with Income Below $10,000 in Springfield, IL?
Top 5 Zip Codes with the Highest Percentage of Families with Income Below $10,000 in Springfield, IL are:
What zip code has the Highest Percentage of Families with Income Below $10,000 in Springfield, IL?
62702 has the Highest Percentage of Families with Income Below $10,000 in Springfield, IL with 7.0%.
What is the Percentage of Families with Income Below $10,000 in Springfield, IL?
Percentage of Families with Income Below $10,000 in Springfield is 3.8%.
What is the Percentage of Families with Income Below $10,000 in Illinois?
Percentage of Families with Income Below $10,000 in Illinois is 3.0%.
What is the Percentage of Families with Income Below $10,000 in the United States?
Percentage of Families with Income Below $10,000 in the United States is 3.1%.