Zip Codes with the Highest Percentage of Households with Income Above $200,000 in Urbana, IL
RELATED REPORTS & OPTIONS
Household Income | $200k+
Urbana
Compare Zip Codes
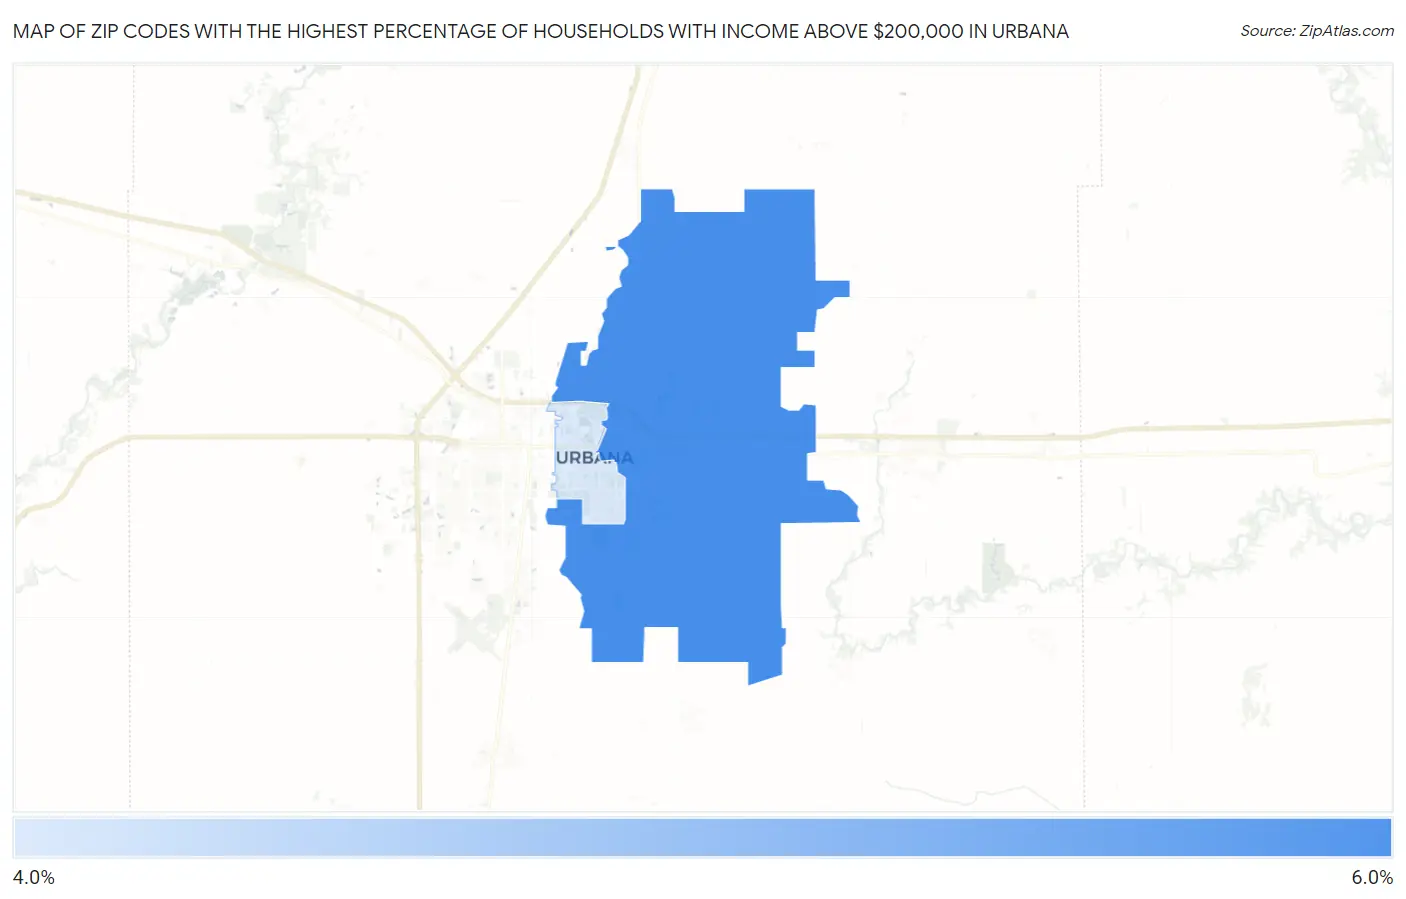
Map of Zip Codes with the Highest Percentage of Households with Income Above $200,000 in Urbana
4.8%
5.5%
Zip Codes with the Highest Percentage of Households with Income Above $200,000 in Urbana, IL
| Zip Code | Households with Income > $200k | vs State | vs National | |
| 1. | 61802 | 5.5% | 12.1%(-6.60)#613 | 11.4%(-5.90)#14,510 |
| 2. | 61801 | 4.8% | 12.1%(-7.30)#678 | 11.4%(-6.60)#16,060 |
1
Common Questions
What are the Top Zip Codes with the Highest Percentage of Households with Income Above $200,000 in Urbana, IL?
Top Zip Codes with the Highest Percentage of Households with Income Above $200,000 in Urbana, IL are:
What zip code has the Highest Percentage of Households with Income Above $200,000 in Urbana, IL?
61802 has the Highest Percentage of Households with Income Above $200,000 in Urbana, IL with 5.5%.
What is the Percentage of Households with Income Above $200,000 in Urbana, IL?
Percentage of Households with Income Above $200,000 in Urbana is 5.4%.
What is the Percentage of Households with Income Above $200,000 in Illinois?
Percentage of Households with Income Above $200,000 in Illinois is 12.1%.
What is the Percentage of Households with Income Above $200,000 in the United States?
Percentage of Households with Income Above $200,000 in the United States is 11.4%.