Zip Codes with the Highest Percentage of Population Employed in Health Care & Social Assistance in Springfield, IL
RELATED REPORTS & OPTIONS
Health Care & Social Assistance
Springfield
Compare Zip Codes
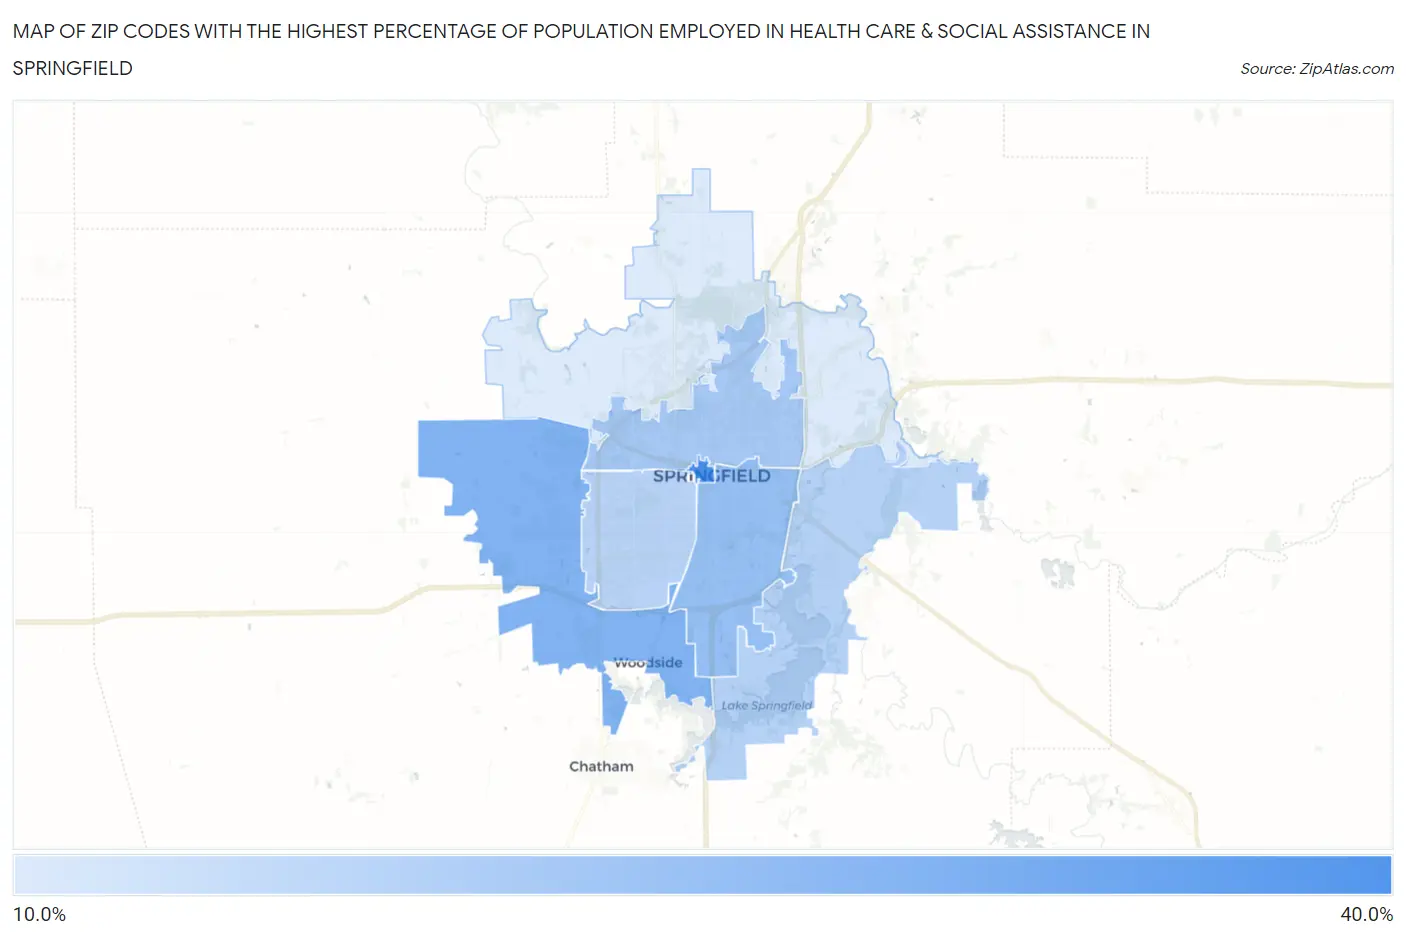
Map of Zip Codes with the Highest Percentage of Population Employed in Health Care & Social Assistance in Springfield
12.7%
32.4%
Zip Codes with the Highest Percentage of Population Employed in Health Care & Social Assistance in Springfield, IL
| Zip Code | % Employed | vs State | vs National | |
| 1. | 62701 | 32.4% | 13.8%(+18.7)#17 | 13.9%(+18.5)#750 |
| 2. | 62711 | 24.4% | 13.8%(+10.6)#69 | 13.9%(+10.4)#1,891 |
| 3. | 62703 | 21.7% | 13.8%(+7.95)#123 | 13.9%(+7.78)#2,948 |
| 4. | 62702 | 19.7% | 13.8%(+5.93)#191 | 13.9%(+5.76)#4,312 |
| 5. | 62712 | 17.6% | 13.8%(+3.83)#320 | 13.9%(+3.66)#6,793 |
| 6. | 62704 | 17.4% | 13.8%(+3.63)#333 | 13.9%(+3.46)#7,101 |
| 7. | 62707 | 12.7% | 13.8%(-1.08)#782 | 13.9%(-1.25)#17,381 |
1
Common Questions
What are the Top 5 Zip Codes with the Highest Percentage of Population Employed in Health Care & Social Assistance in Springfield, IL?
Top 5 Zip Codes with the Highest Percentage of Population Employed in Health Care & Social Assistance in Springfield, IL are:
What zip code has the Highest Percentage of Population Employed in Health Care & Social Assistance in Springfield, IL?
62701 has the Highest Percentage of Population Employed in Health Care & Social Assistance in Springfield, IL with 32.4%.
What is the Percentage of Population Employed in Health Care & Social Assistance in Springfield, IL?
Percentage of Population Employed in Health Care & Social Assistance in Springfield is 20.5%.
What is the Percentage of Population Employed in Health Care & Social Assistance in Illinois?
Percentage of Population Employed in Health Care & Social Assistance in Illinois is 13.8%.
What is the Percentage of Population Employed in Health Care & Social Assistance in the United States?
Percentage of Population Employed in Health Care & Social Assistance in the United States is 13.9%.