Zip Codes with the Highest Percentage of Population with a Degree in Liberal Arts and History in Springfield, IL
RELATED REPORTS & OPTIONS
Liberal Arts and History
Springfield
Compare Zip Codes
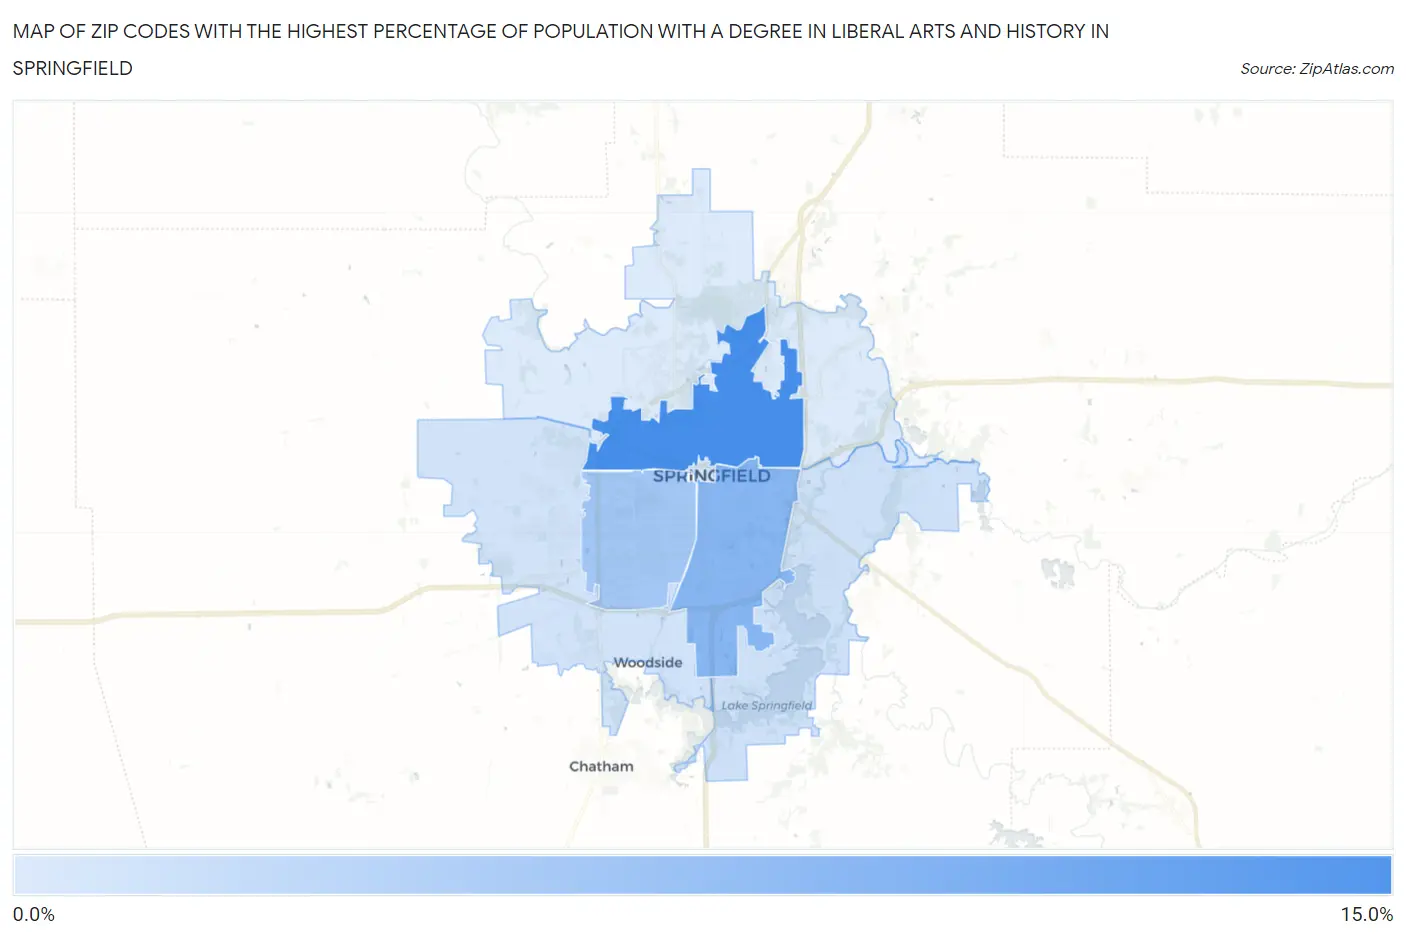
Map of Zip Codes with the Highest Percentage of Population with a Degree in Liberal Arts and History in Springfield
3.7%
10.6%
Zip Codes with the Highest Percentage of Population with a Degree in Liberal Arts and History in Springfield, IL
| Zip Code | % Graduates | vs State | vs National | |
| 1. | 62702 | 10.6% | 4.7%(+5.85)#102 | 4.9%(+5.69)#2,784 |
| 2. | 62703 | 7.5% | 4.7%(+2.79)#206 | 4.9%(+2.63)#5,576 |
| 3. | 62704 | 6.3% | 4.7%(+1.55)#301 | 4.9%(+1.39)#7,865 |
| 4. | 62712 | 4.3% | 4.7%(-0.446)#530 | 4.9%(-0.605)#13,751 |
| 5. | 62711 | 4.2% | 4.7%(-0.479)#542 | 4.9%(-0.639)#13,877 |
| 6. | 62701 | 4.1% | 4.7%(-0.610)#561 | 4.9%(-0.770)#14,398 |
| 7. | 62707 | 3.7% | 4.7%(-1.02)#623 | 4.9%(-1.18)#15,949 |
1
Common Questions
What are the Top 5 Zip Codes with the Highest Percentage of Population with a Degree in Liberal Arts and History in Springfield, IL?
Top 5 Zip Codes with the Highest Percentage of Population with a Degree in Liberal Arts and History in Springfield, IL are:
What zip code has the Highest Percentage of Population with a Degree in Liberal Arts and History in Springfield, IL?
62702 has the Highest Percentage of Population with a Degree in Liberal Arts and History in Springfield, IL with 10.6%.
What is the Percentage of Population with a Degree in Liberal Arts and History in Springfield, IL?
Percentage of Population with a Degree in Liberal Arts and History in Springfield is 6.1%.
What is the Percentage of Population with a Degree in Liberal Arts and History in Illinois?
Percentage of Population with a Degree in Liberal Arts and History in Illinois is 4.7%.
What is the Percentage of Population with a Degree in Liberal Arts and History in the United States?
Percentage of Population with a Degree in Liberal Arts and History in the United States is 4.9%.