Zip Codes with the Highest Percentage of Population Employed in Security & Protection in Springfield, IL
RELATED REPORTS & OPTIONS
Security & Protection
Springfield
Compare Zip Codes
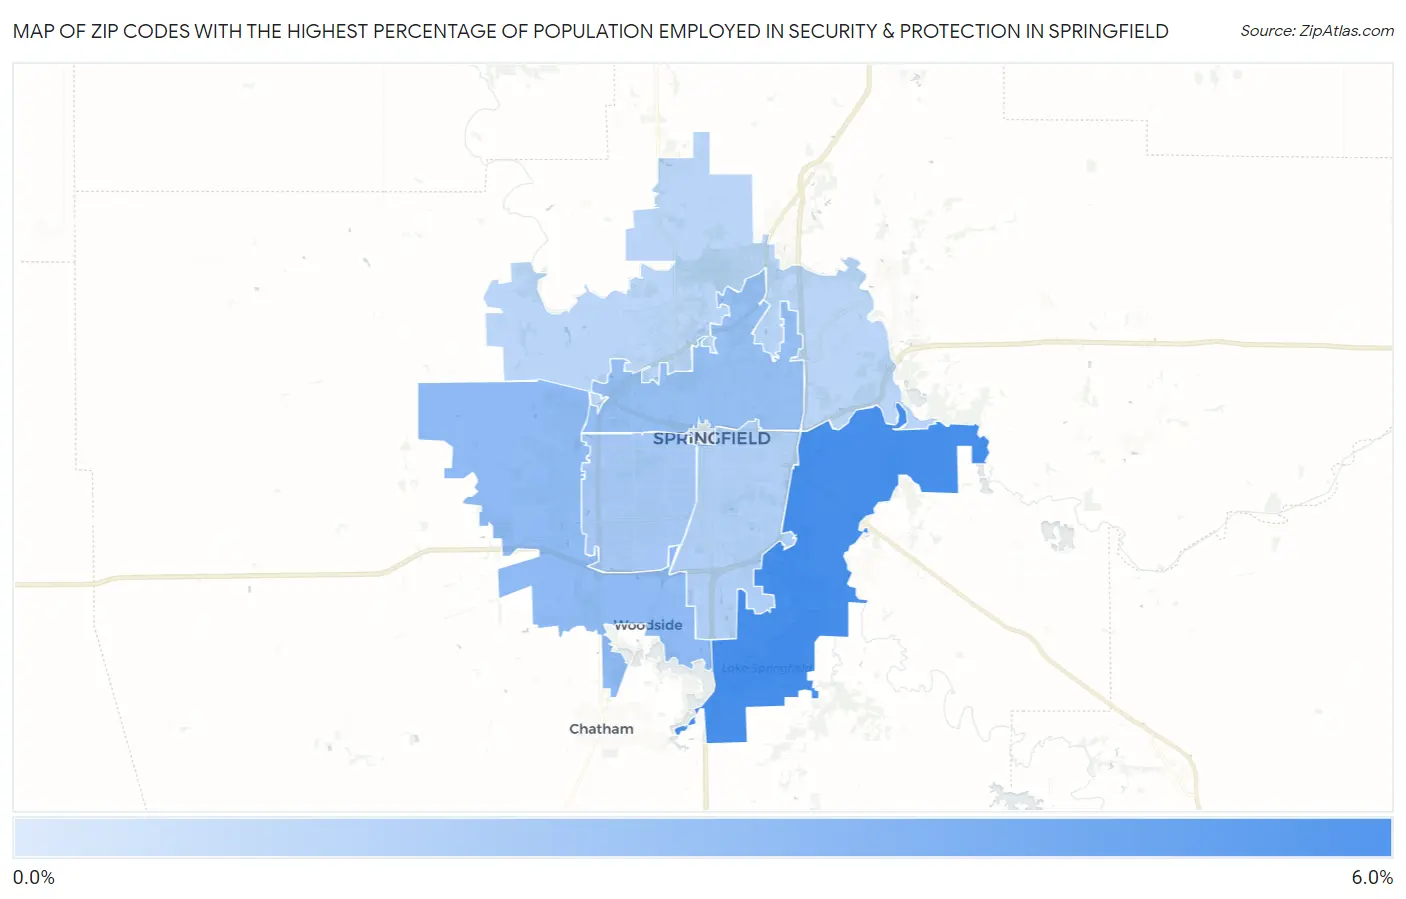
Map of Zip Codes with the Highest Percentage of Population Employed in Security & Protection in Springfield
1.1%
5.7%
Zip Codes with the Highest Percentage of Population Employed in Security & Protection in Springfield, IL
| Zip Code | % Employed | vs State | vs National | |
| 1. | 62712 | 5.7% | 2.2%(+3.55)#90 | 2.1%(+3.59)#2,260 |
| 2. | 62711 | 3.5% | 2.2%(+1.33)#231 | 2.1%(+1.38)#5,612 |
| 3. | 62702 | 3.3% | 2.2%(+1.10)#260 | 2.1%(+1.15)#6,262 |
| 4. | 62704 | 2.8% | 2.2%(+0.604)#342 | 2.1%(+0.647)#8,128 |
| 5. | 62703 | 2.4% | 2.2%(+0.249)#410 | 2.1%(+0.292)#9,847 |
| 6. | 62707 | 2.2% | 2.2%(-0.004)#488 | 2.1%(+0.039)#11,329 |
| 7. | 62701 | 1.1% | 2.2%(-1.06)#833 | 2.1%(-1.01)#19,037 |
1
Common Questions
What are the Top 5 Zip Codes with the Highest Percentage of Population Employed in Security & Protection in Springfield, IL?
Top 5 Zip Codes with the Highest Percentage of Population Employed in Security & Protection in Springfield, IL are:
What zip code has the Highest Percentage of Population Employed in Security & Protection in Springfield, IL?
62712 has the Highest Percentage of Population Employed in Security & Protection in Springfield, IL with 5.7%.
What is the Percentage of Population Employed in Security & Protection in Springfield, IL?
Percentage of Population Employed in Security & Protection in Springfield is 3.4%.
What is the Percentage of Population Employed in Security & Protection in Illinois?
Percentage of Population Employed in Security & Protection in Illinois is 2.2%.
What is the Percentage of Population Employed in Security & Protection in the United States?
Percentage of Population Employed in Security & Protection in the United States is 2.1%.