Hungarian vs Immigrants from Sudan Married-couple Households
COMPARE
Hungarian
Immigrants from Sudan
Married-couple Households
Married-couple Households Comparison
Hungarians
Immigrants from Sudan
49.1%
MARRIED-COUPLE HOUSEHOLDS
99.8/ 100
METRIC RATING
32nd/ 347
METRIC RANK
41.9%
MARRIED-COUPLE HOUSEHOLDS
0.0/ 100
METRIC RATING
296th/ 347
METRIC RANK
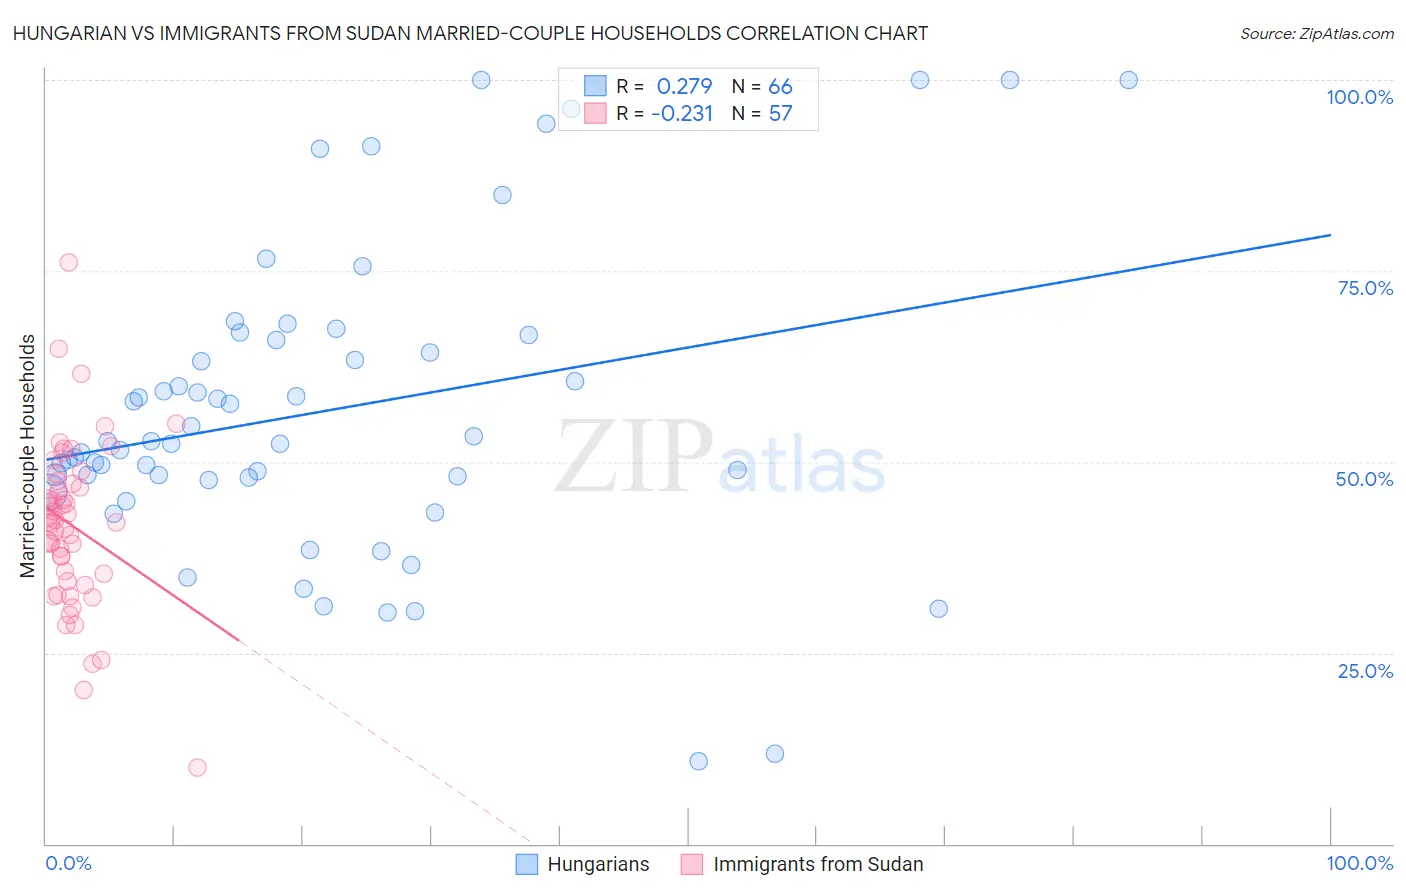
Hungarian vs Immigrants from Sudan Married-couple Households Correlation Chart
The statistical analysis conducted on geographies consisting of 485,875,006 people shows a weak positive correlation between the proportion of Hungarians and percentage of married-couple family households in the United States with a correlation coefficient (R) of 0.279 and weighted average of 49.1%. Similarly, the statistical analysis conducted on geographies consisting of 118,946,439 people shows a weak negative correlation between the proportion of Immigrants from Sudan and percentage of married-couple family households in the United States with a correlation coefficient (R) of -0.231 and weighted average of 41.9%, a difference of 17.0%.
Married-couple Households Correlation Summary
| Measurement | Hungarian | Immigrants from Sudan |
| Minimum | 10.9% | 10.0% |
| Maximum | 100.0% | 76.0% |
| Range | 89.1% | 66.0% |
| Mean | 56.7% | 41.7% |
| Median | 52.5% | 42.1% |
| Interquartile 25% (IQ1) | 47.9% | 34.9% |
| Interquartile 75% (IQ3) | 65.9% | 47.3% |
| Interquartile Range (IQR) | 18.0% | 12.4% |
| Standard Deviation (Sample) | 19.9% | 10.9% |
| Standard Deviation (Population) | 19.8% | 10.8% |
Similar Demographics by Married-couple Households
Demographics Similar to Hungarians by Married-couple Households
In terms of married-couple households, the demographic groups most similar to Hungarians are Immigrants from Asia (49.1%, a difference of 0.030%), Native Hawaiian (49.1%, a difference of 0.060%), Italian (49.0%, a difference of 0.11%), Scottish (49.0%, a difference of 0.13%), and Bolivian (49.2%, a difference of 0.17%).
| Demographics | Rating | Rank | Married-couple Households |
| Immigrants | Philippines | 99.9 /100 | #25 | Exceptional 49.3% |
| Immigrants | Scotland | 99.8 /100 | #26 | Exceptional 49.3% |
| Bhutanese | 99.8 /100 | #27 | Exceptional 49.3% |
| Germans | 99.8 /100 | #28 | Exceptional 49.2% |
| Maltese | 99.8 /100 | #29 | Exceptional 49.2% |
| Bolivians | 99.8 /100 | #30 | Exceptional 49.2% |
| Native Hawaiians | 99.8 /100 | #31 | Exceptional 49.1% |
| Hungarians | 99.8 /100 | #32 | Exceptional 49.1% |
| Immigrants | Asia | 99.7 /100 | #33 | Exceptional 49.1% |
| Italians | 99.7 /100 | #34 | Exceptional 49.0% |
| Scottish | 99.7 /100 | #35 | Exceptional 49.0% |
| Iranians | 99.7 /100 | #36 | Exceptional 49.0% |
| Sri Lankans | 99.7 /100 | #37 | Exceptional 49.0% |
| Greeks | 99.7 /100 | #38 | Exceptional 48.9% |
| Lithuanians | 99.6 /100 | #39 | Exceptional 48.9% |
Demographics Similar to Immigrants from Sudan by Married-couple Households
In terms of married-couple households, the demographic groups most similar to Immigrants from Sudan are Menominee (42.0%, a difference of 0.11%), Immigrants from Yemen (42.0%, a difference of 0.11%), Kiowa (42.0%, a difference of 0.11%), Indonesian (42.0%, a difference of 0.22%), and Paiute (42.1%, a difference of 0.27%).
| Demographics | Rating | Rank | Married-couple Households |
| Sudanese | 0.0 /100 | #289 | Tragic 42.1% |
| Hondurans | 0.0 /100 | #290 | Tragic 42.1% |
| Paiute | 0.0 /100 | #291 | Tragic 42.1% |
| Indonesians | 0.0 /100 | #292 | Tragic 42.0% |
| Menominee | 0.0 /100 | #293 | Tragic 42.0% |
| Immigrants | Yemen | 0.0 /100 | #294 | Tragic 42.0% |
| Kiowa | 0.0 /100 | #295 | Tragic 42.0% |
| Immigrants | Sudan | 0.0 /100 | #296 | Tragic 41.9% |
| Arapaho | 0.0 /100 | #297 | Tragic 41.8% |
| Immigrants | Middle Africa | 0.0 /100 | #298 | Tragic 41.8% |
| Immigrants | Ghana | 0.0 /100 | #299 | Tragic 41.8% |
| Immigrants | Belize | 0.0 /100 | #300 | Tragic 41.8% |
| Immigrants | Bahamas | 0.0 /100 | #301 | Tragic 41.7% |
| Immigrants | Honduras | 0.0 /100 | #302 | Tragic 41.6% |
| Sub-Saharan Africans | 0.0 /100 | #303 | Tragic 41.6% |