Scotch-Irish vs Immigrants from Brazil Male Disability
COMPARE
Scotch-Irish
Immigrants from Brazil
Male Disability
Male Disability Comparison
Scotch-Irish
Immigrants from Brazil
13.2%
MALE DISABILITY
0.0/ 100
METRIC RATING
303rd/ 347
METRIC RANK
10.8%
MALE DISABILITY
95.0/ 100
METRIC RATING
105th/ 347
METRIC RANK
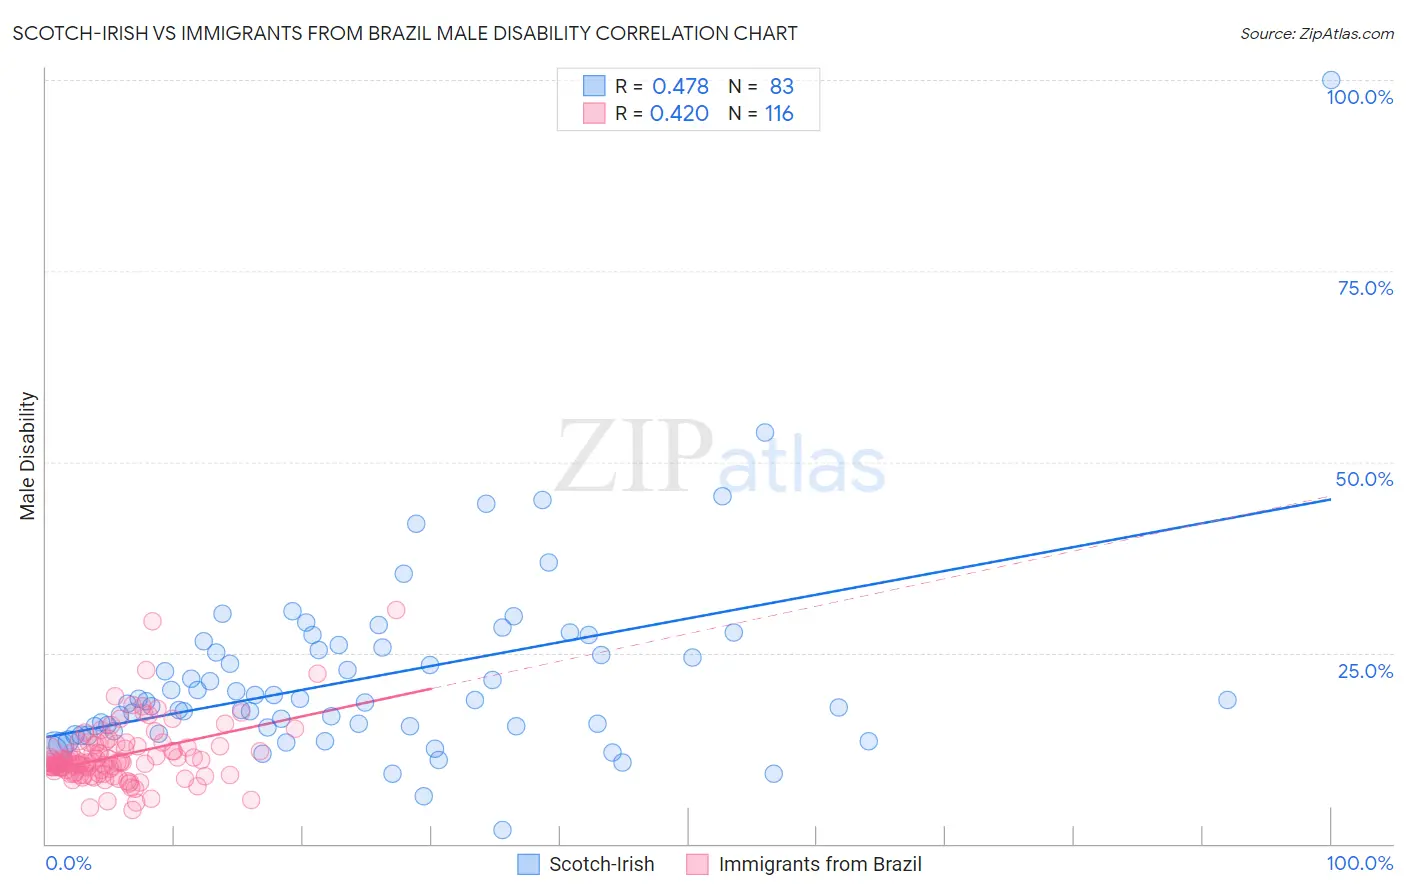
Scotch-Irish vs Immigrants from Brazil Male Disability Correlation Chart
The statistical analysis conducted on geographies consisting of 548,574,277 people shows a moderate positive correlation between the proportion of Scotch-Irish and percentage of males with a disability in the United States with a correlation coefficient (R) of 0.478 and weighted average of 13.2%. Similarly, the statistical analysis conducted on geographies consisting of 342,998,829 people shows a moderate positive correlation between the proportion of Immigrants from Brazil and percentage of males with a disability in the United States with a correlation coefficient (R) of 0.420 and weighted average of 10.8%, a difference of 22.6%.
Male Disability Correlation Summary
| Measurement | Scotch-Irish | Immigrants from Brazil |
| Minimum | 1.8% | 4.4% |
| Maximum | 100.0% | 30.6% |
| Range | 98.2% | 26.2% |
| Mean | 21.6% | 11.5% |
| Median | 18.6% | 10.7% |
| Interquartile 25% (IQ1) | 14.8% | 9.3% |
| Interquartile 75% (IQ3) | 25.6% | 12.8% |
| Interquartile Range (IQR) | 10.9% | 3.5% |
| Standard Deviation (Sample) | 12.6% | 4.0% |
| Standard Deviation (Population) | 12.6% | 4.0% |
Similar Demographics by Male Disability
Demographics Similar to Scotch-Irish by Male Disability
In terms of male disability, the demographic groups most similar to Scotch-Irish are Black/African American (13.2%, a difference of 0.32%), Crow (13.1%, a difference of 0.54%), French Canadian (13.3%, a difference of 0.74%), Spanish American (13.3%, a difference of 0.94%), and French (13.0%, a difference of 1.1%).
| Demographics | Rating | Rank | Male Disability |
| Immigrants | Nonimmigrants | 0.0 /100 | #296 | Tragic 12.9% |
| Inupiat | 0.0 /100 | #297 | Tragic 13.0% |
| Pennsylvania Germans | 0.0 /100 | #298 | Tragic 13.0% |
| Celtics | 0.0 /100 | #299 | Tragic 13.0% |
| Cheyenne | 0.0 /100 | #300 | Tragic 13.0% |
| French | 0.0 /100 | #301 | Tragic 13.0% |
| Crow | 0.0 /100 | #302 | Tragic 13.1% |
| Scotch-Irish | 0.0 /100 | #303 | Tragic 13.2% |
| Blacks/African Americans | 0.0 /100 | #304 | Tragic 13.2% |
| French Canadians | 0.0 /100 | #305 | Tragic 13.3% |
| Spanish Americans | 0.0 /100 | #306 | Tragic 13.3% |
| Arapaho | 0.0 /100 | #307 | Tragic 13.3% |
| French American Indians | 0.0 /100 | #308 | Tragic 13.4% |
| Blackfeet | 0.0 /100 | #309 | Tragic 13.4% |
| Immigrants | Azores | 0.0 /100 | #310 | Tragic 13.4% |
Demographics Similar to Immigrants from Brazil by Male Disability
In terms of male disability, the demographic groups most similar to Immigrants from Brazil are Immigrants from Nigeria (10.8%, a difference of 0.010%), Immigrants from Syria (10.8%, a difference of 0.040%), Uruguayan (10.7%, a difference of 0.080%), Immigrants from Eastern Europe (10.7%, a difference of 0.090%), and Immigrants from Greece (10.7%, a difference of 0.19%).
| Demographics | Rating | Rank | Male Disability |
| Immigrants | Romania | 96.5 /100 | #98 | Exceptional 10.7% |
| Immigrants | Switzerland | 96.1 /100 | #99 | Exceptional 10.7% |
| Immigrants | Kazakhstan | 95.9 /100 | #100 | Exceptional 10.7% |
| Immigrants | Greece | 95.6 /100 | #101 | Exceptional 10.7% |
| Immigrants | Eastern Europe | 95.3 /100 | #102 | Exceptional 10.7% |
| Uruguayans | 95.3 /100 | #103 | Exceptional 10.7% |
| Immigrants | Nigeria | 95.1 /100 | #104 | Exceptional 10.8% |
| Immigrants | Brazil | 95.0 /100 | #105 | Exceptional 10.8% |
| Immigrants | Syria | 94.9 /100 | #106 | Exceptional 10.8% |
| Immigrants | Eastern Africa | 94.3 /100 | #107 | Exceptional 10.8% |
| Immigrants | Belgium | 94.2 /100 | #108 | Exceptional 10.8% |
| Immigrants | Uganda | 94.0 /100 | #109 | Exceptional 10.8% |
| Immigrants | Immigrants | 93.9 /100 | #110 | Exceptional 10.8% |
| Immigrants | Uruguay | 93.8 /100 | #111 | Exceptional 10.8% |
| Ghanaians | 93.4 /100 | #112 | Exceptional 10.8% |