Scotch-Irish vs Lebanese Male Disability
COMPARE
Scotch-Irish
Lebanese
Male Disability
Male Disability Comparison
Scotch-Irish
Lebanese
13.2%
MALE DISABILITY
0.0/ 100
METRIC RATING
303rd/ 347
METRIC RANK
11.5%
MALE DISABILITY
15.4/ 100
METRIC RATING
199th/ 347
METRIC RANK
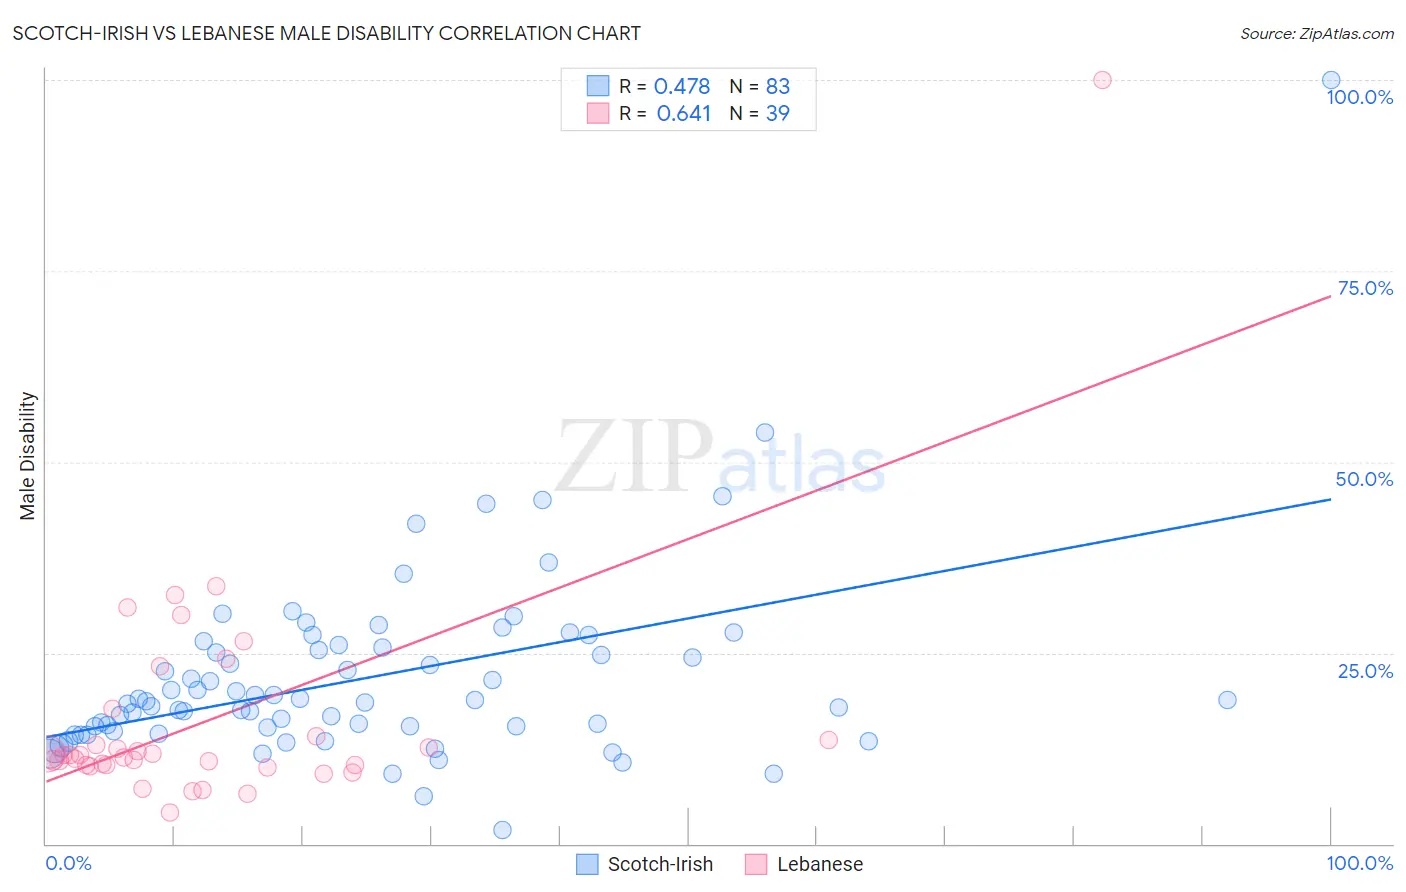
Scotch-Irish vs Lebanese Male Disability Correlation Chart
The statistical analysis conducted on geographies consisting of 548,574,277 people shows a moderate positive correlation between the proportion of Scotch-Irish and percentage of males with a disability in the United States with a correlation coefficient (R) of 0.478 and weighted average of 13.2%. Similarly, the statistical analysis conducted on geographies consisting of 401,575,974 people shows a significant positive correlation between the proportion of Lebanese and percentage of males with a disability in the United States with a correlation coefficient (R) of 0.641 and weighted average of 11.5%, a difference of 14.9%.
Male Disability Correlation Summary
| Measurement | Scotch-Irish | Lebanese |
| Minimum | 1.8% | 4.0% |
| Maximum | 100.0% | 100.0% |
| Range | 98.2% | 96.0% |
| Mean | 21.6% | 16.2% |
| Median | 18.6% | 11.6% |
| Interquartile 25% (IQ1) | 14.8% | 10.2% |
| Interquartile 75% (IQ3) | 25.6% | 14.1% |
| Interquartile Range (IQR) | 10.9% | 3.9% |
| Standard Deviation (Sample) | 12.6% | 15.7% |
| Standard Deviation (Population) | 12.6% | 15.5% |
Similar Demographics by Male Disability
Demographics Similar to Scotch-Irish by Male Disability
In terms of male disability, the demographic groups most similar to Scotch-Irish are Black/African American (13.2%, a difference of 0.32%), Crow (13.1%, a difference of 0.54%), French Canadian (13.3%, a difference of 0.74%), Spanish American (13.3%, a difference of 0.94%), and French (13.0%, a difference of 1.1%).
| Demographics | Rating | Rank | Male Disability |
| Immigrants | Nonimmigrants | 0.0 /100 | #296 | Tragic 12.9% |
| Inupiat | 0.0 /100 | #297 | Tragic 13.0% |
| Pennsylvania Germans | 0.0 /100 | #298 | Tragic 13.0% |
| Celtics | 0.0 /100 | #299 | Tragic 13.0% |
| Cheyenne | 0.0 /100 | #300 | Tragic 13.0% |
| French | 0.0 /100 | #301 | Tragic 13.0% |
| Crow | 0.0 /100 | #302 | Tragic 13.1% |
| Scotch-Irish | 0.0 /100 | #303 | Tragic 13.2% |
| Blacks/African Americans | 0.0 /100 | #304 | Tragic 13.2% |
| French Canadians | 0.0 /100 | #305 | Tragic 13.3% |
| Spanish Americans | 0.0 /100 | #306 | Tragic 13.3% |
| Arapaho | 0.0 /100 | #307 | Tragic 13.3% |
| French American Indians | 0.0 /100 | #308 | Tragic 13.4% |
| Blackfeet | 0.0 /100 | #309 | Tragic 13.4% |
| Immigrants | Azores | 0.0 /100 | #310 | Tragic 13.4% |
Demographics Similar to Lebanese by Male Disability
In terms of male disability, the demographic groups most similar to Lebanese are Immigrants from Jamaica (11.5%, a difference of 0.090%), Somali (11.4%, a difference of 0.27%), Immigrants from Iraq (11.5%, a difference of 0.27%), Immigrants from Panama (11.5%, a difference of 0.27%), and West Indian (11.4%, a difference of 0.29%).
| Demographics | Rating | Rank | Male Disability |
| Assyrians/Chaldeans/Syriacs | 23.2 /100 | #192 | Fair 11.4% |
| Greeks | 22.2 /100 | #193 | Fair 11.4% |
| Belizeans | 21.2 /100 | #194 | Fair 11.4% |
| Immigrants | Oceania | 20.9 /100 | #195 | Fair 11.4% |
| West Indians | 18.4 /100 | #196 | Poor 11.4% |
| Somalis | 18.2 /100 | #197 | Poor 11.4% |
| Immigrants | Jamaica | 16.3 /100 | #198 | Poor 11.5% |
| Lebanese | 15.4 /100 | #199 | Poor 11.5% |
| Immigrants | Iraq | 13.0 /100 | #200 | Poor 11.5% |
| Immigrants | Panama | 13.0 /100 | #201 | Poor 11.5% |
| Immigrants | Mexico | 12.6 /100 | #202 | Poor 11.5% |
| Jamaicans | 10.9 /100 | #203 | Poor 11.5% |
| Immigrants | Cambodia | 10.8 /100 | #204 | Poor 11.5% |
| Serbians | 10.7 /100 | #205 | Poor 11.5% |
| Ukrainians | 10.6 /100 | #206 | Poor 11.5% |