Scotch-Irish No Vehicles in Household
COMPARE
Scotch-Irish
Select to Compare
No Vehicles in Household
Scotch-Irish No Vehicles in Household
6.8%
NO VEHICLES AVAILABLE
100.0/ 100
METRIC RATING
9th/ 347
METRIC RANK
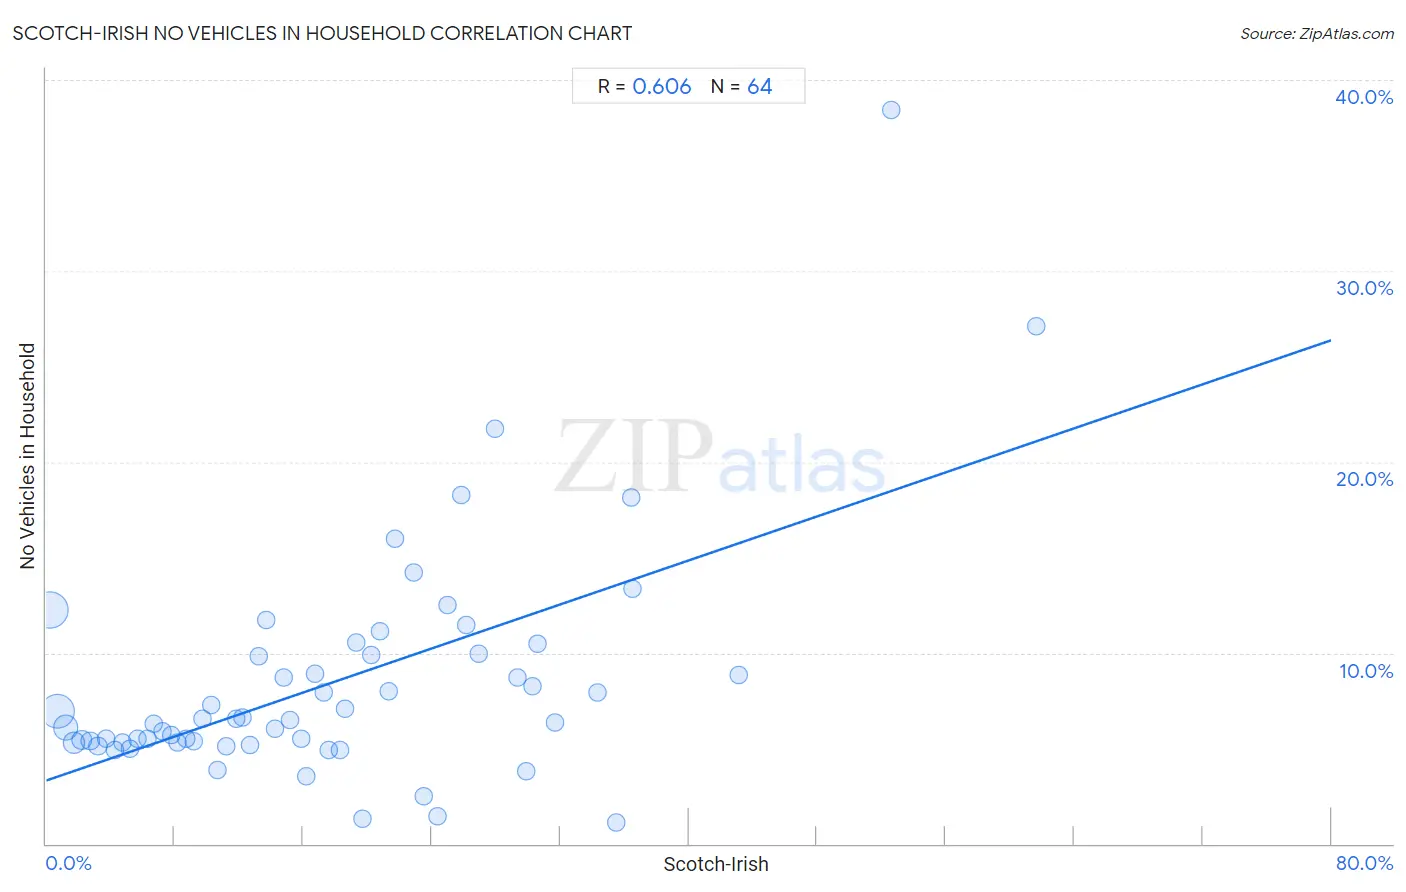
Scotch-Irish No Vehicles in Household Correlation Chart
The statistical analysis conducted on geographies consisting of 544,331,951 people shows a significant positive correlation between the proportion of Scotch-Irish and percentage of households with no vehicle available in the United States with a correlation coefficient (R) of 0.606 and weighted average of 6.8%. On average, for every 1% (one percent) increase in Scotch-Irish within a typical geography, there is an increase of 0.29% in percentage of households with no vehicle available.
It is essential to understand that the correlation between the percentage of Scotch-Irish and percentage of households with no vehicle available does not imply a direct cause-and-effect relationship. It remains uncertain whether the presence of Scotch-Irish influences an upward or downward trend in the level of percentage of households with no vehicle available within an area, or if Scotch-Irish simply ended up residing in those areas with higher or lower levels of percentage of households with no vehicle available due to other factors.
Demographics Similar to Scotch-Irish by No Vehicles in Household
In terms of no vehicles in household, the demographic groups most similar to Scotch-Irish are Swedish (6.8%, a difference of 0.21%), Dutch (6.8%, a difference of 0.51%), Scottish (6.8%, a difference of 0.68%), Czech (6.9%, a difference of 1.1%), and German (6.7%, a difference of 2.0%).
| Demographics | Rating | Rank | No Vehicles in Household |
| Norwegians | 100.0 /100 | #2 | Exceptional 6.4% |
| English | 100.0 /100 | #3 | Exceptional 6.5% |
| Danes | 100.0 /100 | #4 | Exceptional 6.6% |
| Yakama | 100.0 /100 | #5 | Exceptional 6.6% |
| Germans | 100.0 /100 | #6 | Exceptional 6.7% |
| Scottish | 100.0 /100 | #7 | Exceptional 6.8% |
| Swedes | 100.0 /100 | #8 | Exceptional 6.8% |
| Scotch-Irish | 100.0 /100 | #9 | Exceptional 6.8% |
| Dutch | 100.0 /100 | #10 | Exceptional 6.8% |
| Czechs | 100.0 /100 | #11 | Exceptional 6.9% |
| Assyrians/Chaldeans/Syriacs | 100.0 /100 | #12 | Exceptional 7.0% |
| Scandinavians | 100.0 /100 | #13 | Exceptional 7.0% |
| Mexicans | 100.0 /100 | #14 | Exceptional 7.0% |
| Whites/Caucasians | 100.0 /100 | #15 | Exceptional 7.0% |
| Europeans | 100.0 /100 | #16 | Exceptional 7.1% |
Scotch-Irish No Vehicles in Household Correlation Summary
| Measurement | Scotch-Irish Data | No Vehicles in Household Data |
| Minimum | 0.25% | 1.1% |
| Maximum | 61.7% | 38.5% |
| Range | 61.4% | 37.4% |
| Mean | 17.8% | 8.4% |
| Median | 16.0% | 6.5% |
| Interquartile 25% (IQ1) | 8.0% | 5.3% |
| Interquartile 75% (IQ3) | 25.4% | 9.9% |
| Interquartile Range (IQR) | 17.4% | 4.6% |
| Standard Deviation (Sample) | 12.7% | 6.0% |
| Standard Deviation (Population) | 12.6% | 6.0% |
Correlation Details
| Scotch-Irish Percentile | Sample Size | No Vehicles in Household |
[ 0.0% - 0.5% ] 0.25% | 209,765,348 | 12.2% |
[ 0.5% - 1.0% ] 0.72% | 182,124,708 | 6.9% |
[ 1.0% - 1.5% ] 1.21% | 82,075,894 | 6.1% |
[ 1.5% - 2.0% ] 1.72% | 36,049,861 | 5.3% |
[ 2.0% - 2.5% ] 2.21% | 15,638,424 | 5.5% |
[ 2.5% - 3.0% ] 2.73% | 7,679,489 | 5.4% |
[ 3.0% - 3.5% ] 3.23% | 4,998,293 | 5.1% |
[ 3.5% - 4.0% ] 3.75% | 2,363,401 | 5.5% |
[ 4.0% - 4.5% ] 4.25% | 1,198,603 | 4.9% |
[ 4.5% - 5.0% ] 4.76% | 676,720 | 5.3% |
[ 5.0% - 5.5% ] 5.23% | 616,279 | 5.0% |
[ 5.5% - 6.0% ] 5.71% | 292,204 | 5.5% |
[ 6.0% - 6.5% ] 6.28% | 174,627 | 5.5% |
[ 6.5% - 7.0% ] 6.71% | 122,505 | 6.3% |
[ 7.0% - 7.5% ] 7.22% | 90,642 | 5.9% |
[ 7.5% - 8.0% ] 7.79% | 97,793 | 5.7% |
[ 8.0% - 8.5% ] 8.20% | 66,217 | 5.3% |
[ 8.5% - 9.0% ] 8.75% | 55,846 | 5.5% |
[ 9.0% - 9.5% ] 9.21% | 26,708 | 5.4% |
[ 9.5% - 10.0% ] 9.72% | 30,191 | 6.5% |
[ 10.0% - 10.5% ] 10.28% | 32,629 | 7.3% |
[ 10.5% - 11.0% ] 10.67% | 20,391 | 3.9% |
[ 11.0% - 11.5% ] 11.23% | 16,539 | 5.1% |
[ 11.5% - 12.0% ] 11.82% | 14,936 | 6.5% |
[ 12.0% - 12.5% ] 12.20% | 6,000 | 6.6% |
[ 12.5% - 13.0% ] 12.70% | 2,008 | 5.2% |
[ 13.0% - 13.5% ] 13.22% | 18,133 | 9.8% |
[ 13.5% - 14.0% ] 13.70% | 15,141 | 11.7% |
[ 14.0% - 14.5% ] 14.26% | 14,822 | 6.0% |
[ 14.5% - 15.0% ] 14.81% | 824 | 8.7% |
[ 15.0% - 15.5% ] 15.14% | 4,873 | 6.5% |
[ 15.5% - 16.0% ] 15.88% | 3,325 | 5.5% |
[ 16.0% - 16.5% ] 16.17% | 6,580 | 3.5% |
[ 16.5% - 17.0% ] 16.70% | 2,228 | 8.9% |
[ 17.0% - 17.5% ] 17.25% | 4,974 | 7.9% |
[ 17.5% - 18.0% ] 17.60% | 6,987 | 4.9% |
[ 18.0% - 18.5% ] 18.31% | 1,748 | 4.9% |
[ 18.5% - 19.0% ] 18.62% | 1,971 | 7.1% |
[ 19.0% - 19.5% ] 19.26% | 379 | 10.6% |
[ 19.5% - 20.0% ] 19.71% | 1,020 | 1.3% |
[ 20.0% - 20.5% ] 20.26% | 306 | 9.9% |
[ 20.5% - 21.0% ] 20.79% | 1,539 | 11.1% |
[ 21.0% - 21.5% ] 21.34% | 759 | 8.0% |
[ 21.5% - 22.0% ] 21.74% | 1,118 | 15.9% |
[ 22.5% - 23.0% ] 22.86% | 245 | 14.2% |
[ 23.0% - 23.5% ] 23.48% | 903 | 2.5% |
[ 24.0% - 24.5% ] 24.34% | 189 | 1.4% |
[ 25.0% - 25.5% ] 25.00% | 60 | 12.5% |
[ 25.5% - 26.0% ] 25.87% | 317 | 18.3% |
[ 26.0% - 26.5% ] 26.16% | 237 | 11.5% |
[ 26.5% - 27.0% ] 26.91% | 431 | 9.9% |
[ 27.5% - 28.0% ] 27.91% | 86 | 21.7% |
[ 29.0% - 29.5% ] 29.37% | 252 | 8.7% |
[ 29.5% - 30.0% ] 29.91% | 662 | 3.8% |
[ 30.0% - 30.5% ] 30.25% | 2,843 | 8.2% |
[ 30.5% - 31.0% ] 30.57% | 386 | 10.5% |
[ 31.5% - 32.0% ] 31.65% | 79 | 6.3% |
[ 34.0% - 34.5% ] 34.33% | 233 | 7.9% |
[ 35.0% - 35.5% ] 35.46% | 141 | 1.1% |
[ 36.0% - 36.5% ] 36.40% | 728 | 18.1% |
[ 36.5% - 37.0% ] 36.53% | 605 | 13.3% |
[ 43.0% - 43.5% ] 43.13% | 473 | 8.8% |
[ 52.5% - 53.0% ] 52.63% | 38 | 38.5% |
[ 61.5% - 62.0% ] 61.67% | 60 | 27.1% |