Zip Codes with the Highest Percentage of Households with Income Below $10,000 in Birmingham, AL
RELATED REPORTS & OPTIONS
Household Income | $0-10k
Birmingham
Compare Zip Codes
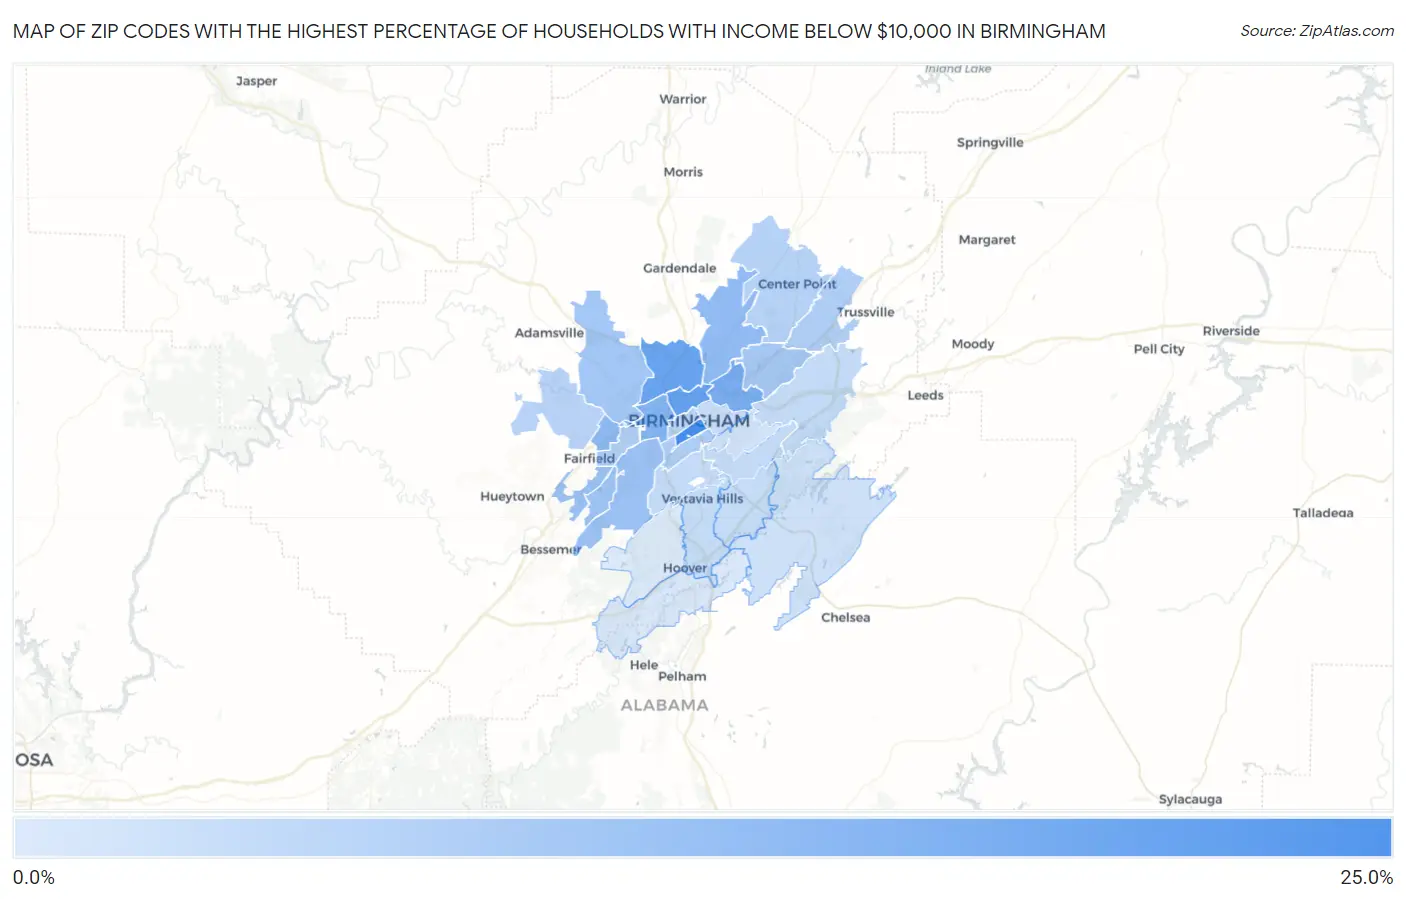
Map of Zip Codes with the Highest Percentage of Households with Income Below $10,000 in Birmingham
1.8%
24.5%
Zip Codes with the Highest Percentage of Households with Income Below $10,000 in Birmingham, AL
| Zip Code | Households with Income < $10k | vs State | vs National | |
| 1. | 35233 | 24.5% | 6.5%(+18.0)#11 | 4.9%(+19.6)#506 |
| 2. | 35234 | 19.6% | 6.5%(+13.1)#24 | 4.9%(+14.7)#832 |
| 3. | 35207 | 18.9% | 6.5%(+12.4)#29 | 4.9%(+14.0)#907 |
| 4. | 35212 | 16.2% | 6.5%(+9.70)#41 | 4.9%(+11.3)#1,292 |
| 5. | 35204 | 14.5% | 6.5%(+8.00)#50 | 4.9%(+9.60)#1,646 |
| 6. | 35218 | 13.0% | 6.5%(+6.50)#68 | 4.9%(+8.10)#2,074 |
| 7. | 35217 | 12.9% | 6.5%(+6.40)#75 | 4.9%(+8.00)#2,117 |
| 8. | 35211 | 11.3% | 6.5%(+4.80)#101 | 4.9%(+6.40)#2,786 |
| 9. | 35228 | 11.2% | 6.5%(+4.70)#104 | 4.9%(+6.30)#2,845 |
| 10. | 35221 | 10.7% | 6.5%(+4.20)#112 | 4.9%(+5.80)#3,137 |
| 11. | 35214 | 10.0% | 6.5%(+3.50)#130 | 4.9%(+5.10)#3,575 |
| 12. | 35206 | 9.7% | 6.5%(+3.20)#140 | 4.9%(+4.80)#3,813 |
| 13. | 35205 | 8.3% | 6.5%(+1.80)#189 | 4.9%(+3.40)#5,177 |
| 14. | 35235 | 8.2% | 6.5%(+1.70)#195 | 4.9%(+3.30)#5,303 |
| 15. | 35208 | 7.9% | 6.5%(+1.40)#206 | 4.9%(+3.00)#5,698 |
| 16. | 35215 | 7.3% | 6.5%(+0.800)#228 | 4.9%(+2.40)#6,471 |
| 17. | 35224 | 7.0% | 6.5%(+0.500)#245 | 4.9%(+2.10)#7,019 |
| 18. | 35203 | 6.6% | 6.5%(+0.100)#263 | 4.9%(+1.70)#7,809 |
| 19. | 35210 | 5.4% | 6.5%(-1.10)#334 | 4.9%(+0.500)#10,523 |
| 20. | 35223 | 5.4% | 6.5%(-1.10)#335 | 4.9%(+0.500)#10,531 |
| 21. | 35209 | 5.2% | 6.5%(-1.30)#346 | 4.9%(+0.300)#11,068 |
| 22. | 35216 | 5.1% | 6.5%(-1.40)#351 | 4.9%(+0.200)#11,348 |
| 23. | 35243 | 5.0% | 6.5%(-1.50)#356 | 4.9%(+0.100)#11,729 |
| 24. | 35222 | 4.7% | 6.5%(-1.80)#379 | 4.9%(-0.200)#12,758 |
| 25. | 35242 | 3.6% | 6.5%(-2.90)#440 | 4.9%(-1.30)#16,776 |
| 26. | 35213 | 3.5% | 6.5%(-3.00)#451 | 4.9%(-1.40)#17,321 |
| 27. | 35244 | 2.1% | 6.5%(-4.40)#536 | 4.9%(-2.80)#23,230 |
| 28. | 35226 | 1.8% | 6.5%(-4.70)#546 | 4.9%(-3.10)#24,351 |
1
Common Questions
What are the Top 10 Zip Codes with the Highest Percentage of Households with Income Below $10,000 in Birmingham, AL?
Top 10 Zip Codes with the Highest Percentage of Households with Income Below $10,000 in Birmingham, AL are:
What zip code has the Highest Percentage of Households with Income Below $10,000 in Birmingham, AL?
35233 has the Highest Percentage of Households with Income Below $10,000 in Birmingham, AL with 24.5%.
What is the Percentage of Households with Income Below $10,000 in Birmingham, AL?
Percentage of Households with Income Below $10,000 in Birmingham is 9.9%.
What is the Percentage of Households with Income Below $10,000 in Alabama?
Percentage of Households with Income Below $10,000 in Alabama is 6.5%.
What is the Percentage of Households with Income Below $10,000 in the United States?
Percentage of Households with Income Below $10,000 in the United States is 4.9%.