Zip Codes with the Highest Percentage of Population with a Degree in Arts and Humanities in Birmingham, AL
RELATED REPORTS & OPTIONS
Arts and Humanities
Birmingham
Compare Zip Codes
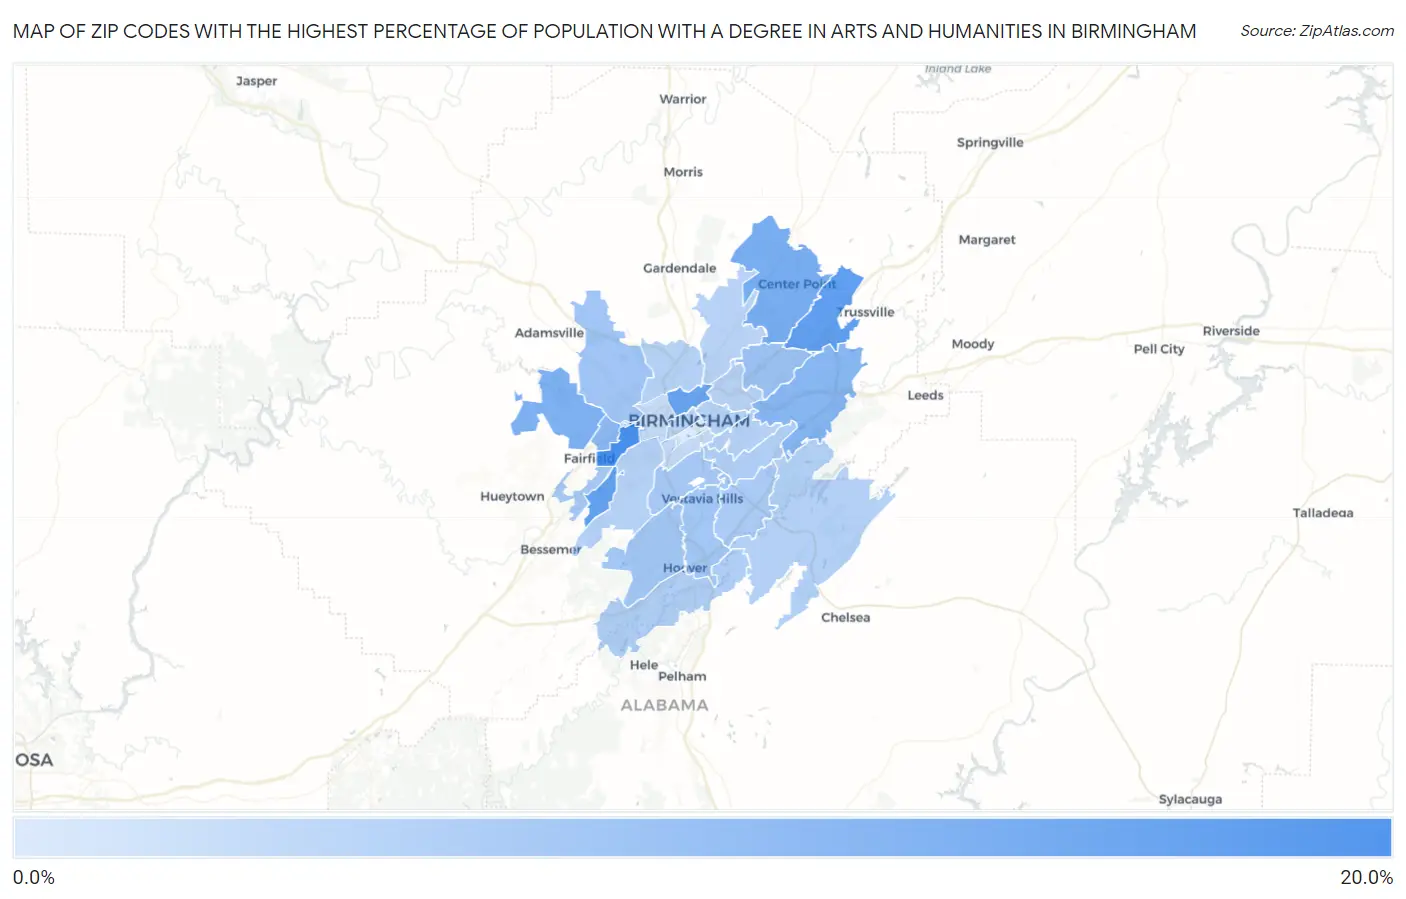
Map of Zip Codes with the Highest Percentage of Population with a Degree in Arts and Humanities in Birmingham
0.45%
17.5%
Zip Codes with the Highest Percentage of Population with a Degree in Arts and Humanities in Birmingham, AL
| Zip Code | % Graduates | vs State | vs National | |
| 1. | 35208 | 17.5% | 7.2%(+10.3)#40 | 6.0%(+11.5)#1,973 |
| 2. | 35235 | 14.3% | 7.2%(+7.08)#74 | 6.0%(+8.29)#2,965 |
| 3. | 35221 | 14.0% | 7.2%(+6.80)#78 | 6.0%(+8.01)#3,126 |
| 4. | 35234 | 13.5% | 7.2%(+6.25)#84 | 6.0%(+7.46)#3,385 |
| 5. | 35215 | 11.7% | 7.2%(+4.51)#114 | 6.0%(+5.71)#4,531 |
| 6. | 35224 | 10.9% | 7.2%(+3.65)#131 | 6.0%(+4.86)#5,262 |
| 7. | 35210 | 9.7% | 7.2%(+2.53)#160 | 6.0%(+3.74)#6,609 |
| 8. | 35218 | 9.3% | 7.2%(+2.13)#167 | 6.0%(+3.34)#7,180 |
| 9. | 35206 | 7.5% | 7.2%(+0.286)#223 | 6.0%(+1.50)#10,744 |
| 10. | 35214 | 7.0% | 7.2%(-0.218)#245 | 6.0%(+0.992)#11,996 |
| 11. | 35216 | 6.8% | 7.2%(-0.448)#257 | 6.0%(+0.762)#12,599 |
| 12. | 35226 | 6.6% | 7.2%(-0.572)#264 | 6.0%(+0.637)#12,925 |
| 13. | 35209 | 6.5% | 7.2%(-0.694)#271 | 6.0%(+0.515)#13,233 |
| 14. | 35228 | 6.2% | 7.2%(-0.959)#286 | 6.0%(+0.250)#13,967 |
| 15. | 35243 | 5.8% | 7.2%(-1.39)#312 | 6.0%(-0.176)#15,180 |
| 16. | 35244 | 5.5% | 7.2%(-1.75)#327 | 6.0%(-0.538)#16,236 |
| 17. | 35223 | 5.4% | 7.2%(-1.84)#335 | 6.0%(-0.626)#16,508 |
| 18. | 35242 | 4.9% | 7.2%(-2.28)#355 | 6.0%(-1.07)#17,822 |
| 19. | 35222 | 4.7% | 7.2%(-2.46)#369 | 6.0%(-1.25)#18,335 |
| 20. | 35211 | 4.7% | 7.2%(-2.52)#372 | 6.0%(-1.31)#18,489 |
| 21. | 35207 | 4.6% | 7.2%(-2.58)#377 | 6.0%(-1.37)#18,689 |
| 22. | 35213 | 4.5% | 7.2%(-2.67)#379 | 6.0%(-1.46)#18,913 |
| 23. | 35217 | 4.5% | 7.2%(-2.70)#380 | 6.0%(-1.49)#18,983 |
| 24. | 35212 | 4.5% | 7.2%(-2.75)#384 | 6.0%(-1.54)#19,139 |
| 25. | 35203 | 4.2% | 7.2%(-2.99)#394 | 6.0%(-1.78)#19,751 |
| 26. | 35205 | 3.2% | 7.2%(-4.03)#433 | 6.0%(-2.82)#22,313 |
| 27. | 35204 | 2.7% | 7.2%(-4.50)#442 | 6.0%(-3.29)#23,205 |
| 28. | 35233 | 0.45% | 7.2%(-6.76)#486 | 6.0%(-5.55)#25,676 |
1
Common Questions
What are the Top 10 Zip Codes with the Highest Percentage of Population with a Degree in Arts and Humanities in Birmingham, AL?
Top 10 Zip Codes with the Highest Percentage of Population with a Degree in Arts and Humanities in Birmingham, AL are:
What zip code has the Highest Percentage of Population with a Degree in Arts and Humanities in Birmingham, AL?
35208 has the Highest Percentage of Population with a Degree in Arts and Humanities in Birmingham, AL with 17.5%.
What is the Percentage of Population with a Degree in Arts and Humanities in Birmingham, AL?
Percentage of Population with a Degree in Arts and Humanities in Birmingham is 6.0%.
What is the Percentage of Population with a Degree in Arts and Humanities in Alabama?
Percentage of Population with a Degree in Arts and Humanities in Alabama is 7.2%.
What is the Percentage of Population with a Degree in Arts and Humanities in the United States?
Percentage of Population with a Degree in Arts and Humanities in the United States is 6.0%.